
記住我


Bacterial growth was performed for diluted water extracts of two soil samples using the spread plate method in nutrient agar plates. A total of 16 bacterial strains were identified and isolated based on morphology, texture, and color. These colonies were isolated and screening of these isolates was done in nutrient agar plates containing guaiacol as differential media. Potential laccase-producer bacterial isolates changed the color of the colony to reddish-brown after 10 days at 37 °C as presented in Table 1. The color change is an indicator of the presence of laccases, which catalyze guaiacol oxidation to produce light absorption at 460 nm (Vignesh et al. 2016). The seven potential laccase-producing bacterial strains (WR1, WR2, WR3, WR4, WR5, 13P*, and 38R) were identified. Gram staining was done for the bacterial isolates on glass slides, and the shape of the colonies was observed under a 100 × microscope. Their color, elevation, texture, margins, and shapes are elaborated in Table 1.
Table 1 Morphological characteristics of isolated bacterial coloniesCatalase testH2O2 drops were put on each isolate smear on microscopic glass slides, and observations were made on bubble formation. Negative catalase responses (few or no bubbles) were observed for WR1, WR3, and WR4, while positive catalase responses were observed for WR2, WR5, 38R (bubble formations), and 13P* (excellent bubble formation).
Growth on MacConkey agarSeven bacterial isolates were streaked on MacConkey agar plates and the plates were incubated overnight at 37 °C. MacConkey agar is a selective and differentiating agar that only grows Gram-negative bacterial species. Results showed that all seven bacterial isolates were Gram negative.
Production of laccase enzymeStudy of laccase enzyme productivity in nutrient brothTo study laccase enzyme productivity, the seven bacterial isolates were grown in nutrient broth (NB) containing 0.5 mM of guaiacol and laccase activity was checked on a daily basis. Gradual changes in the color of media from yellow to brown were observed during laccase production, showing laccase’s ability to oxidize guaiacol. Guaiacol oxidation in the broth was monitored by optical density measurement of aliquots taken from the broths. Laccase enzyme activity in μmol/(min mL) or U/mL, defined as the amount of enzyme required to oxidize 1 μmol of guaiacol per minute per unit volume, was quantitatively determined by a guaiacol oxidation assay (i.e., laccase assay) performed for each broth every day during the course of 10 days following the protocol described in the “Materials and methods” section.
The results of optical density measurement and laccase activity calculation are shown in Fig. 1a, b. The highest optical density of the guaicol oxidation product was observed for WR2 on day 7. Later, the optical density decreased with time, indicating that the guaiacol oxidation product was not stable in the broth. This justifies a separate laccase activity assay that was performed, where fresh guaiacol was added and the mixture was only incubated for a short time to minimize further degradation of the guaiacol oxidation product. The result in Fig. 1b shows that the maximum laccase activity (2.755 U/mL) was observed by the potential WR2 isolate on day 9 while the lowest activity was observed by the WR1 isolate.
Fig. 1
a Optical density at 450 nm of laccase assay mixtures of selected bacterial isolates. b Laccase activity of selected bacterial isolates
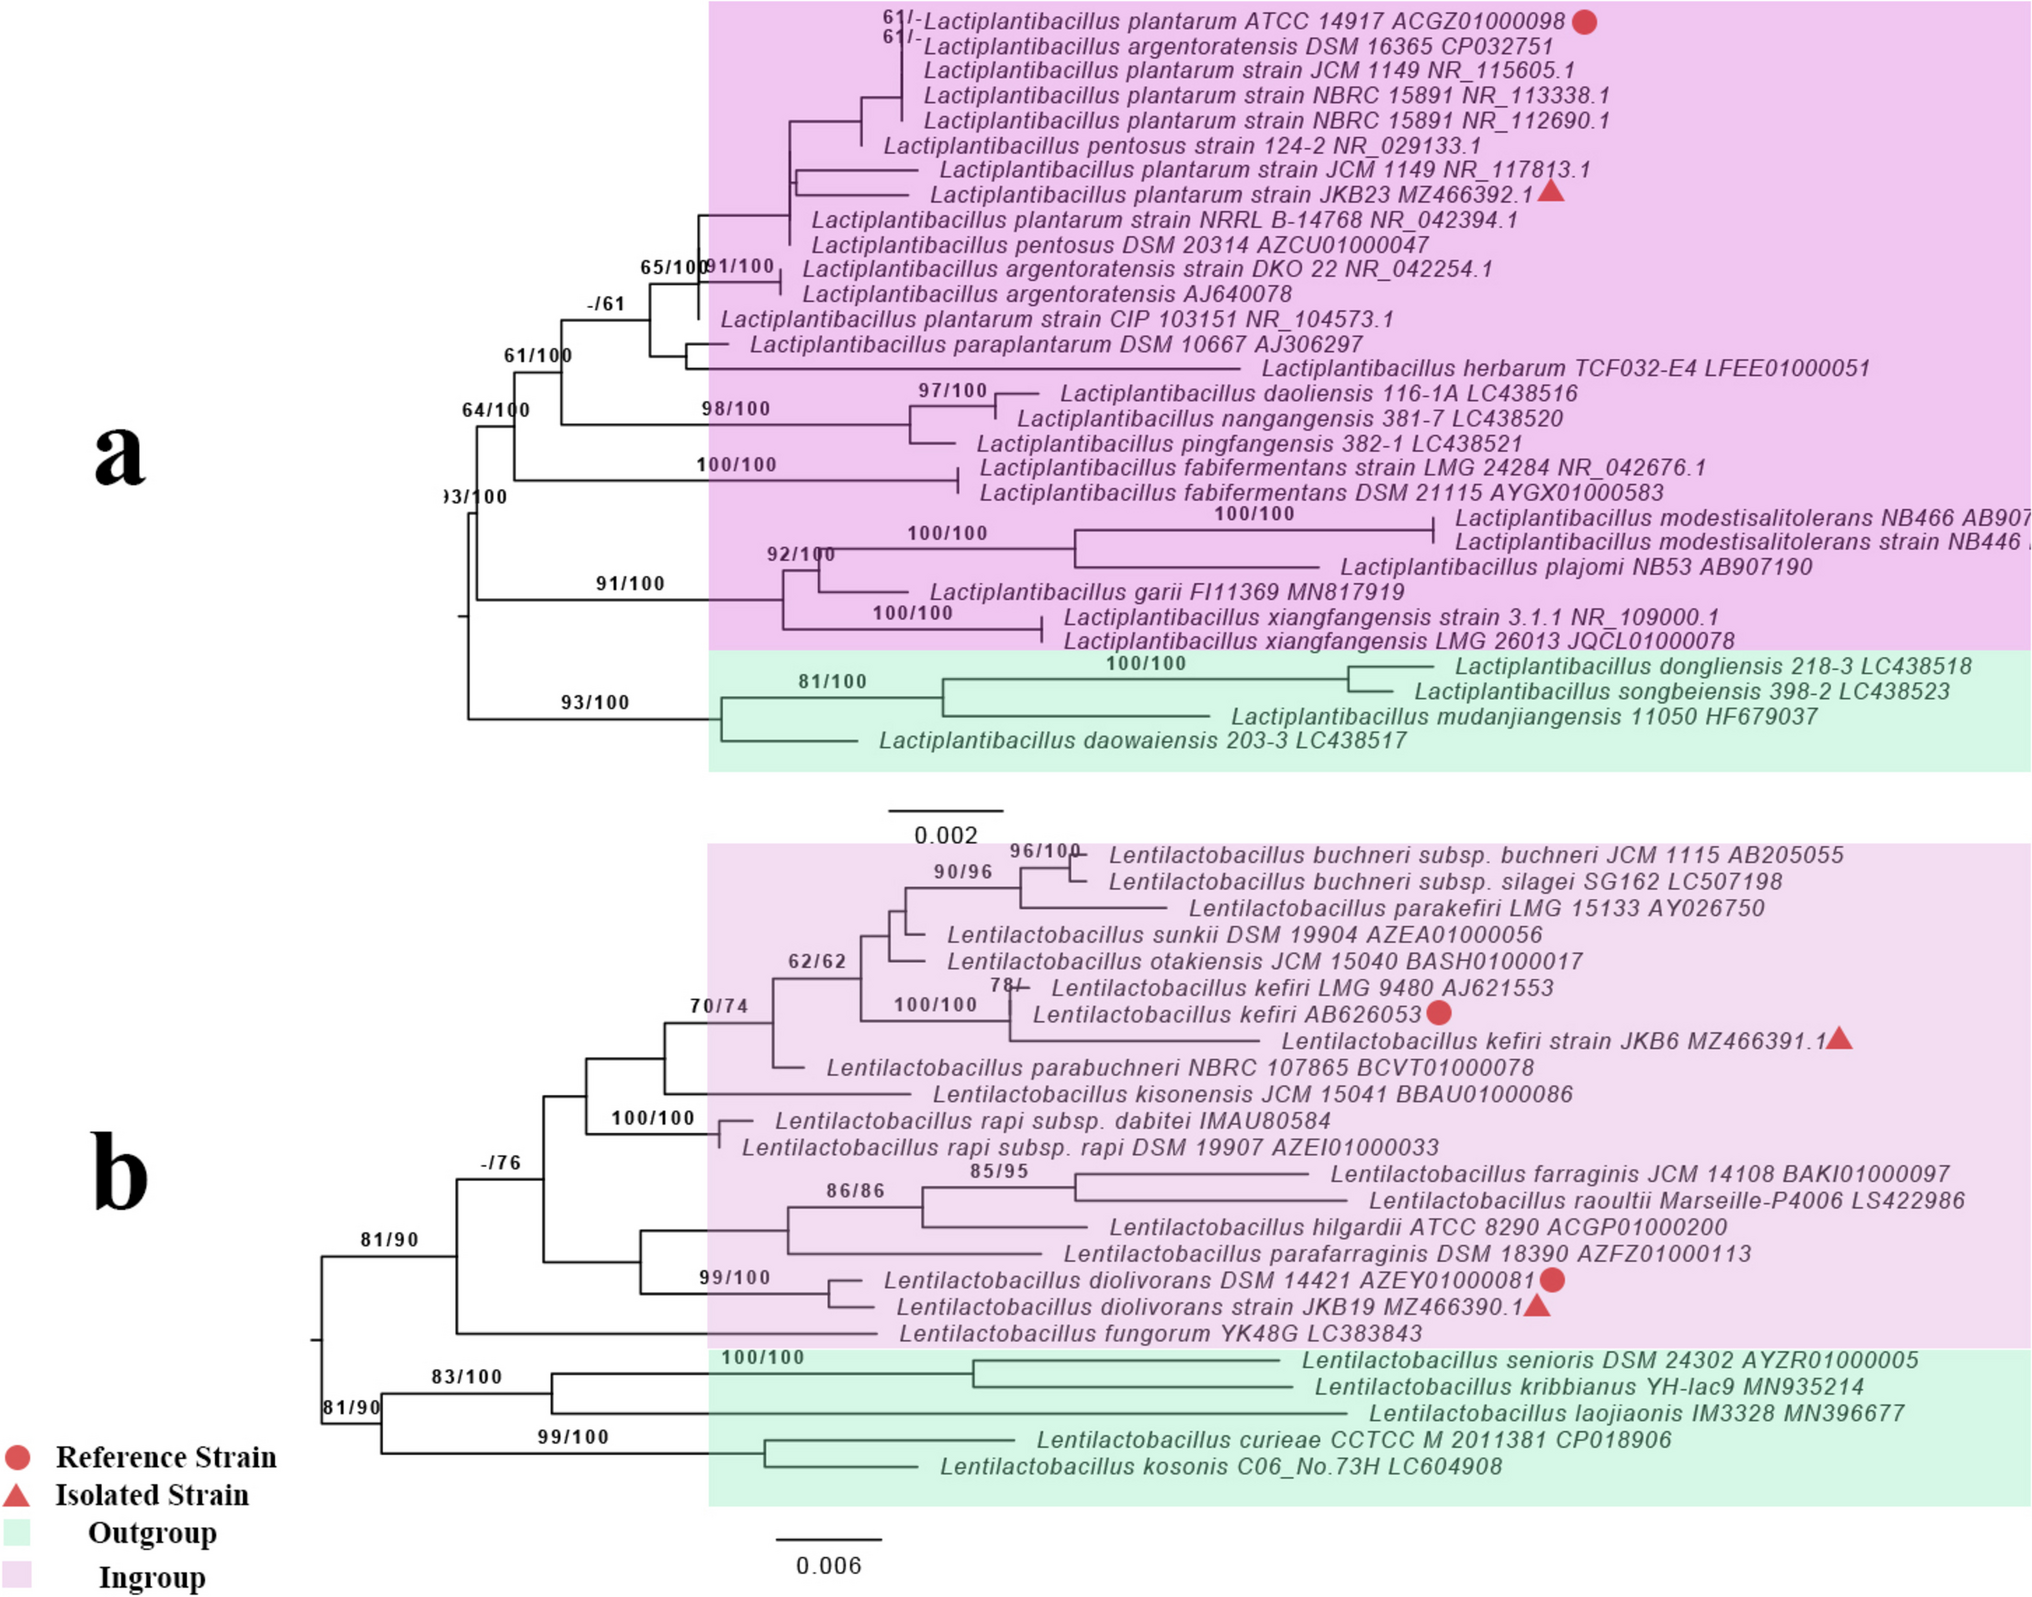
Molecular phylogenetic analysis by maximum likelihood methodThe WR2 isolate was identified as Pseudomonas stutzeri (Fig. 2) using NCBI BLAST of 16S rRNA gene sequences and its maximum similarity was 99.89%. Different strains of this bacterium have been reported for their laccase production for biodecolorization of textile azo dyes (Bera and Tank 2021; Joshi et al. 2020; Kuppusamy et al. 2017), use as a green catalyst (Shinde et al. 2020), crude oil degradation (Parthipan et al. 2017), etc.
Fig. 2
16S rRNA gene 1500bp of WR2
RSM study of laccase production using lignocellulosic biomassTo maximize the production of laccase from bacterial isolate WR2 using lignocellulosic biomass, 12 runs of experiments of Plackett–Burman design (Table 2) were performed on the following growth parameters: pH (5.5 or 6.8), incubation time (5 or 10 days), inoculum (1 or 2%), sugarcane bagasse (0 or 1%), wheat bran (0 or 1%), wheat straw (0 or 1%), rice straw (0 or 1%), cotton stalk (0 or 1%), yeast extract (0 or 0.5%), peptone (0 or 0.5%), and CuSO4 (0 or 100 µM). All the percentages were based on the amount of autoclaved distilled water (100 g) used to make the broth. Laccase inoculum was added after each parameter takes only two values as shown in the parentheses.
The observed laccase activities are given in the last column of Table 2. The highest laccase activity (1.86 U/mL) was achieved in run 4 under the following conditions: pH 6.8, 10 days, inoculum 1 mL/100 mL, sugarcane bagasse 0%, wheat bran 0%, rice straw 0%, wheat straw 1%, cotton stalk 1%, yeast extract 0.5%, peptone 0%, and CuSO4 100 µM, while the lowest laccase activity (0.086 U/mL) was observed in run 2 under the following conditions: pH 5.5, 5 days, inoculum 1 mL/100 mL, sugarcane bagasse 0%, wheat bran 0%, rice straw 0%, wheat straw 0%, cotton stalk 0%, yeast extract 0%, peptone 0%, and CuSO4 0 µM.
Table 2 Twelve Plackett–Burman designs and observed laccase activityThe data was statistically analyzed using Design Expert 10.0.1.0 to obtain the coefficient of determination (R2), which is a statistical measure of the dependence of laccase activity on the value of a growth parameter. With the R2 estimates obtained (Table 3), the dependence of laccase activity on growth parameters can be expressed in the formula below.
Table 3 Statistical summary of response surface methodology for the production of laccase activity$$\mathrm\;\mathrm\;=\;0.60\;+\;0.19A+0.27B-0.097C\mathit-0.11D\mathit-0.032E+0.19F\mathit-0.025G+0.087H+0.0621I-0.11\;J+0.078\;K\\$$
where variables A through K are the factors listed in Table 3. The negative sign in the equation shows a negative effect while the positive sign shows a positive effect. The formula can be used to estimate laccase activity for different production conditions using different values (within the scopes of values used in the experiments as given in Table 2) for the variables.
A half-normal plot is presented in Fig. 3 to visualize the importance of the various factors, where the orange color presents a positive effect while the blue color presents a negative effect. Time, pH, and wheat straw are the factors with the highest probability of positive effects.
Fig. 3
Half-normal plot with % probability of individual factors
3D response surface graphs can be plotted to show the effect of two variables on laccase activity. Figure 4 shows the effect of time and pH on laccase activity which highlighted that time and pH changed while other factors remained constant. An increase in time resulted in increased laccase activity whereas the same trend has also been observed with pH and wheat straw. Similar 3D response surface graphs can be obtained for various pairs of positive factors such as pH/wheat straw, pH/cotton stalk, and pH/CuSO4.
Fig. 4
Response surface curves (3D plots) showing response of laccase to both time and pH
Fourier transform infrared spectroscopy (FTIR)FTIR spectra of the biodegraded wheat straw and cotton stalk in run 4 are given in Fig. 5, together with the spectra of pristine wheat straw and cotton stalk. The pristine biomass spectra are very similar to the spectra in the literature (Adapa et al. 2011; Zeng et al. 2011). One of the most prominent changes is the weakening of the aromatic vibration peak at 1610 cm−1 and bending vibration peaks of Ar–H in the area of 1400–1300 cm−1, clearly indicating the substantial removal of lignin from the biomass by laccase. Reduction in this peak (at a lesser degree) has been reported as an indication of lignin degradation in wheat straw by lignin peroxidase expressed by Phanerochaete chrysosporium (Zeng et al. 2011). The strong peak at 1390 cm−1 and enhancement and broadening of the C-O signal at 1026 cm−1 are likely due to the inclusion of solid impurities which cannot be separated from the degraded biomass.
Fig. 5
Fourier transform infrared spectrum (FTIR) showing structural changes in biomass from run 4
留言 (0)