
記住我


A total of 167 allo-HSCT were included in this study. The median age at transplant was 9.3 years (range, 4 months–23 years). Among the included patients, 78% (n = 130) received an allograft for a malignant disease, mainly acute lymphoblastic leukaemia (39.5% of the whole cohort, n = 66). Regarding the type of donor, 61% (n = 101), 21% (n = 34) and 18% (n = 18) of the patients had MUDs, MSDs, and haploidentical donors, respectively. Regarding the stem cell sources, 80% (n = 132) of the patients received bone marrow stem cells, 15% (n = 24) received peripheral blood stem cells, and 5% (n = 8) received cord blood stem cells. A total of 92% of patients (n = 154) received MAC; among these patients, 63% (n = 97) received busulfan, and 15% (n = 23) received total body irradiation. Grade 2–4 aGvHD occurred in 31% of the patients (n = 51), whereas grade 3–4 aGvHD occurred in 11% (n = 19). The cumulative incidence of SOS/VOD was 16% (n = 27), with a median onset time of 11 days after HSCT (range 8–25). The one-year OS rate for the whole cohort was 76.1% (95% CI, 69.4% to 82.8%). The one-year cumulative incidence rate of NRM was 19.0% (95% CI, 13.9% to 26.2%) (Supplementary Fig. 1). The causes of one-year NRM are described in Supplementary Table 1. The detailed characteristics of the cohort are reported in Table 1.
Table 1 Clinical characteristic of allo-HCT procedures included in the study.EASIX score dynamicsThe dynamics of the EASIX score from admission to day +35 after allo-HSCT are represented in Fig. 1. The median EASIX values increased from before conditioning (−0.79, IQR −1.60–0.42) to a maximum on day + 20 (2.23, IQR 0.57–3.1) and then slightly decreased, reaching a value of 1.20 (IQR −0.16–2.34) at day +35. The median EASIX values at days +7 and +14 for the whole cohort were 0.99 (IQR −0.36–1.89) and 1.20 (IQR 0.35–2.59), respectively.
Fig. 1: Dynamics of EASIX score after allo-HCT.
a EASIX score dynamics over time post allo-HCT for the whole cohort. b EASIX score dynamics in patients developing or not developing SOS/VOD. EASIX score was normalized using log2 and calculated every day. LOWESS lines were added in (a) to illustrate trends for the whole cohort (red line and red dots) and in (b) for patients developing (red line and red dots) or not developing (blue line and blue dots) SOS/VOD.
No major differences were observed in EASIX score dynamics between patients receiving or not TBI-based or Busulfan-based conditioning regimens.
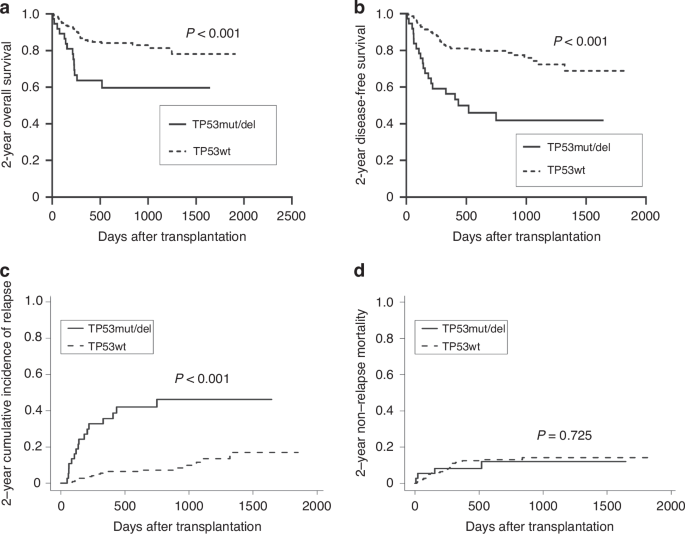
EASIX score dynamics and SOS/VODWe then determined EASIX score dynamics via LOWESS analysis in patients who did and did not develop SOS/VOD, as shown in Fig. 1. The median values of the EASIX score were comparable at admission (−0.72 vs. −0.85; p = 0.83) but diverged significantly from day +7 to day +22, with the maximum difference being observed on day +18 (4.67 vs. 0.99; p = 0.013). Given that the earliest onset of SOS/VOD in our cohort occurred on day +8, we investigated whether EASIX scores obtained before this time point could serve as predictors for the subsequent development of SOS/VOD. On day +7, the median EASIX score was significantly greater in patients who later developed SOS/VOD (2.29 vs. 0.80; p = 0.005) (Fig. 2a). Univariate logistic regression revealed that the EASIX score at day +7 (EASIX + 7) was significantly correlated with the incidence of SOS/VOD (OR 1.41; 95% CI, 1.04–1.92; p = 0.028). To exclude the individual predictive value of each parameter comprising the EASIX + 7 in predicting SOS/VOD, we conducted univariate logistic regression analyses for each parameter. However, none of the parameters showed a significant association (data not shown). Multivariate analysis confirmed that the EASIX + 7 score was an independent predictor of SOS/VOD (OR 1.52; 95% CI, 1.08–2.13; p = 0.017) (Table 2). We then calculated the ROC curves for the prediction of SOS/VOD, and the optimal calculated cut-off value of the EASIX + 7 score was 1.93. The difference (Δ) between the EASIX + 7 score and the EASIX score at admission was not a predictor of subsequent SOS/VOD; however, we observed a trend towards statistical significance (OR 1.39; 95% CI, 1,00–1.95; p = 0.053). We calculated the AUC of the EASIX score until day +7 for patients who did and did not develop SOS/VOD. We observed significant differences between the groups (93.08 ± 6.45 vs. 75.43 ± 4.99, p < 0.001). Considering the low rate of SOS/VOD-related mortality (Supplementary Table 1), we did not observe any correlation between the SOS/VOD-related mortality rate and the EASIX + 7 score.
Fig. 2: Comparison of EASIX + 7 score across different outcomes.
a Box plot comparison of EASIX + 7 in patients developing or not developing SOS/VOD. b Box plot comparison of EASIX + 7 in patients subsequently dying or not dying of NRM. Comparison made using the Mann–Whitney test: ***P < 0.001; **P < 0.01; *P < 0.05.
Table 2 Univariate and multivariate analysis on EASIX + 7 as a predictor of SOS/VOD.Median value of EASIX score at SOS/VOD diagnosis was 4.42, and no statistically significant associations were observed with SOS/VOD severity and outcome. All patients received defibrotide treatment from the day of diagnosis, and a statistically significant reduction was observed between EASIX score values at diagnosis and at day +35 (4.42 vs 1.87; p = 0.023).
EASIX score dynamics and NRMEASIX score dynamics were different in patients who died from NRM or all-cause mortality (ACM) after allo-HSCT than in patients who survived after allo-HSCT. In both cases, the median values of the EASIX score were comparable at admission (NRM: 0.86 vs. 0.72; p = 0.36; ACM: 0.95 vs. 0.80; p = 0.52) but significantly diverged from day −1 to day +14, with the maximum difference being observed on day + 12 (NRM: 5.43 vs. 0.97; p < 0.001; ACM: 3.84 vs. 0.91; p < 0.001).
At the same time, as described previously, we analysed the predictive value of the EASIX score for mortality. The EASIX + 7 score was significantly correlated with NRM (OR 1.56; 95% CI, 1.13–2.13; p = 0.006) and ACM (OR 1.32; 95% CI, 1.01–1.71; p = 0.041). The median EASIX score was greater on day +7 in patients who subsequently died from NRM (1.92 vs. 0.80; p = 0.035) or ACM (1.78 vs. 0.66; p = 0.03) (Fig. 2B). The single parameters composing the EASIX + 7 score were not predictors of NRM or ACM (data not shown). The EASIX + 7 score remained an independent predictor of NRM in the multivariate model (OR 1.68; 95% CI 1.16–2.42; p = 0.006), as shown in Table 3. Conversely, the association was not confirmed for ACM in multivariate analysis (Supplementary Table 2). We performed ROC analysis to identify the EASIX + 7 score with the highest sensitivity and specificity for NRM, which was 1.77 (Supplementary Fig. 2). We then compared the cumulative incidence of NRM in patients stratified into two groups, namely, those with EASIX + 7 scores higher or lower than 1.77. Compared with the group with EASIX + 7 scores lower than 1.77, in the group with EASIX + 7 scores higher than 1.77, the rate of NRM was significantly increased, as shown in Fig. 3 (45.0%; 95% CI, 26.2% to 77.3% vs. 11.2%; 95% CI, 4.8% to 26.4%; p = 0.002) (Fig. 3A). The OS rate differed significantly between the two groups (55.1%; Cl 95% 30.8% to 79.3% vs. 81.6%; Cl 95% 69.7% to 93.5%; p = 0.012) (Fig. 3B). The Δ between the EASIX + 7 score and EASIX score at admission was significantly associated with NRM (OR 1.45; 95% CI, 1.05–2.00; p = 0.023) but not with ACM (OR 1.21; 95% CI, 0.92–1.59; p = 0.18). With respect to the association between the EASIX score and NRM, the EASIX + 0 score was also a significant predictor of NRM according to univariate (OR 1.79; 95% CI, 1.24–2.58; p = 0.002) and multivariate analyses (OR 1.79; 95% CI, 1.13–2.49; p = 0.006) (Supplementary Table 3). Moreover, the EASIX + 14 score was associated with subsequent NRM in univariate (OR 1.68; 95% CI, 1.23–2.28; p = 0.001) and multivariate analyses (OR 1.84; 95% CI, 1.28–2.63; p = 0.002) (Supplementary Table 4). For all the time points, day +12 (univariate OR 2.72; multivariate OR 3.05) showed the highest OR, with an AUC of the ROC curve of 0.891 (Supplementary Table 5).
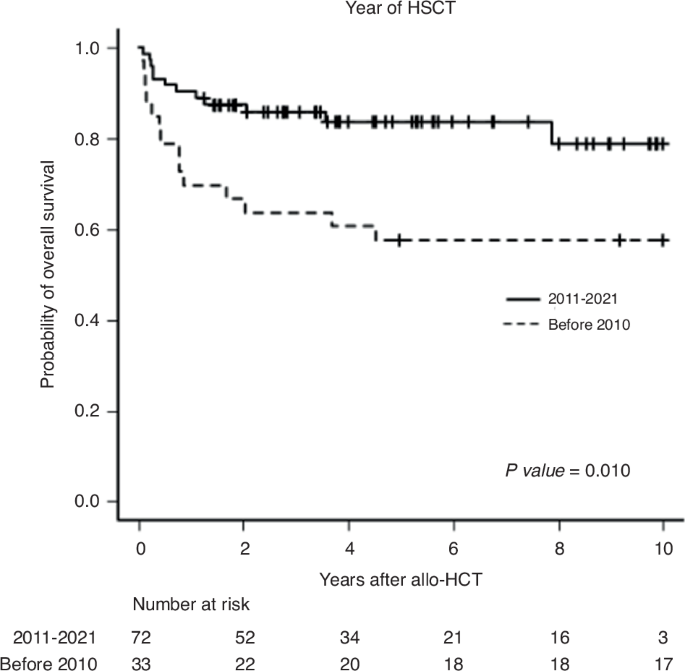
Table 3 Univariate and multivariate analysis on EASIX + 7 as a predictor of NRM.Fig. 3: Kaplan-Meier estimates for NRM and OS based on EASIX + 7 values.
a NRM based on EASIX + 7. Patients were grouped by the EASIX + 7 value with the most sensitivity and specificity for NRM based on ROC analysis (1.77). b OS based on EASIX + 7. Patients were grouped by the same EASIX + 7 value calculated for NRM.
EASIX score and ageAge correlated significantly with the EASIX score at all analysed time points. Specifically, there was a linear correlation between age and the EASIX + 7 score (p < 0.001), with the EASIX score increasing by 0.2064 units for each additional year of age (95% CI: 0.1413–0.2716) (Fig. 4). We then tried to assess whether the association between age and the EASIX score could be considered a confounder in the observed associations. However, the EASIX + 7 score was confirmed as an independent predictor of SOS/VOD and NRM even after age was added to the multivariate models (data not shown).
Fig. 4: Correlation between age and EASIX + 7 score.
Linear correlation between EASIX + 7 and age. Each data point represents the EASIX + 7 value plotted against the corresponding patient age. The solid line represents the best-fit linear regression line, with the equation Y = 0.2064*X -1.021. The dotted lines represent the 95% confidence interval for the regression line. Age measured in years at HCT.
EASIX scores and other clinical outcomesIn our cohort, the EASIX + 7 score was not a predictor of TAM (p = 0.88) or posterior reversible encephalopathy syndrome (PRES) (p = 0.62), two other complications considered secondarily to endothelial damage [23], as was the EASIX score at any other time point. The incidence of other known endothelial complications in our cohort was too low to perform any statistical analysis. Moreover, no correlations were found between the EASIX + 7 score and aGvHD, namely, any grade aGvHD, grade 2–4 aGvHD, grade 3–4 aGvHD, or steroid-resistant or steroid-dependent aGvHD. Conversely, the EASIX + 14 score was significantly associated with grade 3–4 aGvHD according to the univariate analysis (OR 1.39; 95% CI, 1.06–1.81; p = 0.017). Patients who developed severe aGvHD had higher EASIX scores at day +14 than patients who did not develop grade 3–4 aGvHD (2.80 vs. 1.06; p = 0.013) (Supplementary Fig. 3). Multivariate analysis confirmed the independent association between the EASIX + 14 score and grade 3–4 aGvHD (OR 1.57; 95% CI, 1.01–2.18; p = 0.008) (Supplementary Table 6).
留言 (0)