Since the American Institute of Medicine published their report “To Err is Human: Building a Safer Health System” in 1999 (1), medication errors have received more attention in clinical research. A medication error (ME) is defined as “an unintended failure in the drug treatment process that leads to, or has the potential to lead to, harm to the patient” (2). Medication safety is an important part of patient safety. However, in a comprehensive systematic review on “Patient safety in inpatient mental health settings”, Thibaut et al. (3) found only 17 articles related to medication safety, including five studies on adverse drug events (4–7). An adverse drug event (ADEs) is defined as “any untoward medical occurrence in a patient or clinical trial subject administered a medicinal product [ … ] which does not necessarily have a causal relationship with this treatment” (2). In contrast to an ADE, an adverse drug reaction (ADR) is defined as “an appreciably harmful or unpleasant reaction, resulting from an intervention related to the use of a medicinal product” (8).
Previously, in 2003, Grasso et al. found few reports on the incidence and characteristics of MEs in psychiatric hospitals (9). In the following years, further reviews on MEs have been published (10–12). In the most recent systematic review on MEs and ADEs in both inpatient and outpatient settings of mental health hospitals, 20 articles were identified and MEs and ADEs were categorized as prescribing errors (PEs), unintentional medication discrepancies, transcription errors, medication administration errors (MAEs), and dispensing errors (12) with an overall ME rate of 10.6–17.5 per 1000 patient-days (13, 14), 17.4% of total opportunities for error (4) and in 61.4% of patients (15). MEs and ADEs are categories of drug-related problems (DRPs) which are defined as “an event or circumstance involving drug therapy that actually or potentially interferes with desired health outcomes” (16). In the past six years since the last review’s publication, more reports on a broader range of DRPs have emerged, including pharmacodynamic and pharmacokinetic drug-drug interactions (17, 18), potentially inappropriate prescribing in older psychiatric patients (19), polypharmacy in psychiatry (20), prevalence, nature, severity and preventability of ADEs (21), and on clinical pharmacist interventions to solve DRPs (22).
Pharmacotherapy is an important part of the treatment of psychiatric patients, especially of those treated in hospitals due to the acute severity of their diseases. Psychiatric patients often need to take their prescribed psychotropic drugs for a longer time. Therefore, it is crucial for clinicians to be aware of the most prevalent DRPs occurring in psychiatric inpatients and to implement effective interventions to prevent or solve these DRPs before patients are discharged to ambulatory care. One possible way to identify medication discrepancies at transitions of care is medication reconciliation at hospital admission and discharge which is a process usually completed by clinical pharmacists (23). Its positive impact has been shown in a mental health hospital (24).
An important base for designing effective clinical interventions is the knowledge of potential risk factors for DRPs. A systematic review published in 2022 focused on risk factors for DRPs in hospital-based mental health units (25). The authors identified an increasing number of prescribed medications as the only factor consistently reported to be significantly associated with the occurrence of most types of DRPs in eleven of 14 included articles (25).
Furthermore, it has been established that many ADRs occur dose-dependently and therefore depending on drug blood concentrations (26). Clinical guidelines on psychopharmacological treatment provide recommendations for therapeutic drug monitoring (TDM) including therapeutic reference ranges in blood concentrations of many drugs (26). In Germany, the Consensus Guidelines for Therapeutic Drug Monitoring in Neuropsychopharmacology are well established for the interpretation of psychotropic drug concentrations in blood (26). Results from clinical studies which assessed blood concentrations of drugs with regard to recommended therapeutic reference ranges in patients experiencing DRPs, especially ADRs, would be helpful to guide future dosing decisions in clinical practice.
A number of reviews on different aspects of medication safety in psychiatric settings, e.g. medication safety in mental health in inpatient and outpatient settings (27), MEs and ADEs in mental health hospitals (12), MEs in older people with mental health problems (28), the prevalence and characteristics of psychotropic-related hospitalizations in older people (29), neuroleptic malignant syndrome (30), and certain interventions for its improvement in psychiatric settings, such as text messaging interventions to promote medication adherence (31) and clinical pharmacist interventions (22), have been published over the past twenty years.
However, no systematic review has yet been published on the overall prevalence of DRPs in the psychiatric inpatient setting and interventions to solve them.
With this systematic review, we aim to give an up-to-date overview to clinicians on the existing literature on a broad range of DRPs and interventions to solve them in the psychiatric inpatient setting. This review addresses the following questions: What are the most frequent DRPs and DRP subtypes in adult psychiatric inpatients and which interventions have been tested to solve them?
2 MethodsThe protocol for this systematic review was prepared according to the Preferred Reporting Items for Systematic Reviews and Meta-Analyses (PRISMA) 2020 checklist (32) and was registered with PROSPERO (CRD42022354958 (33),).
The definitions used in this review are given in Table 1.
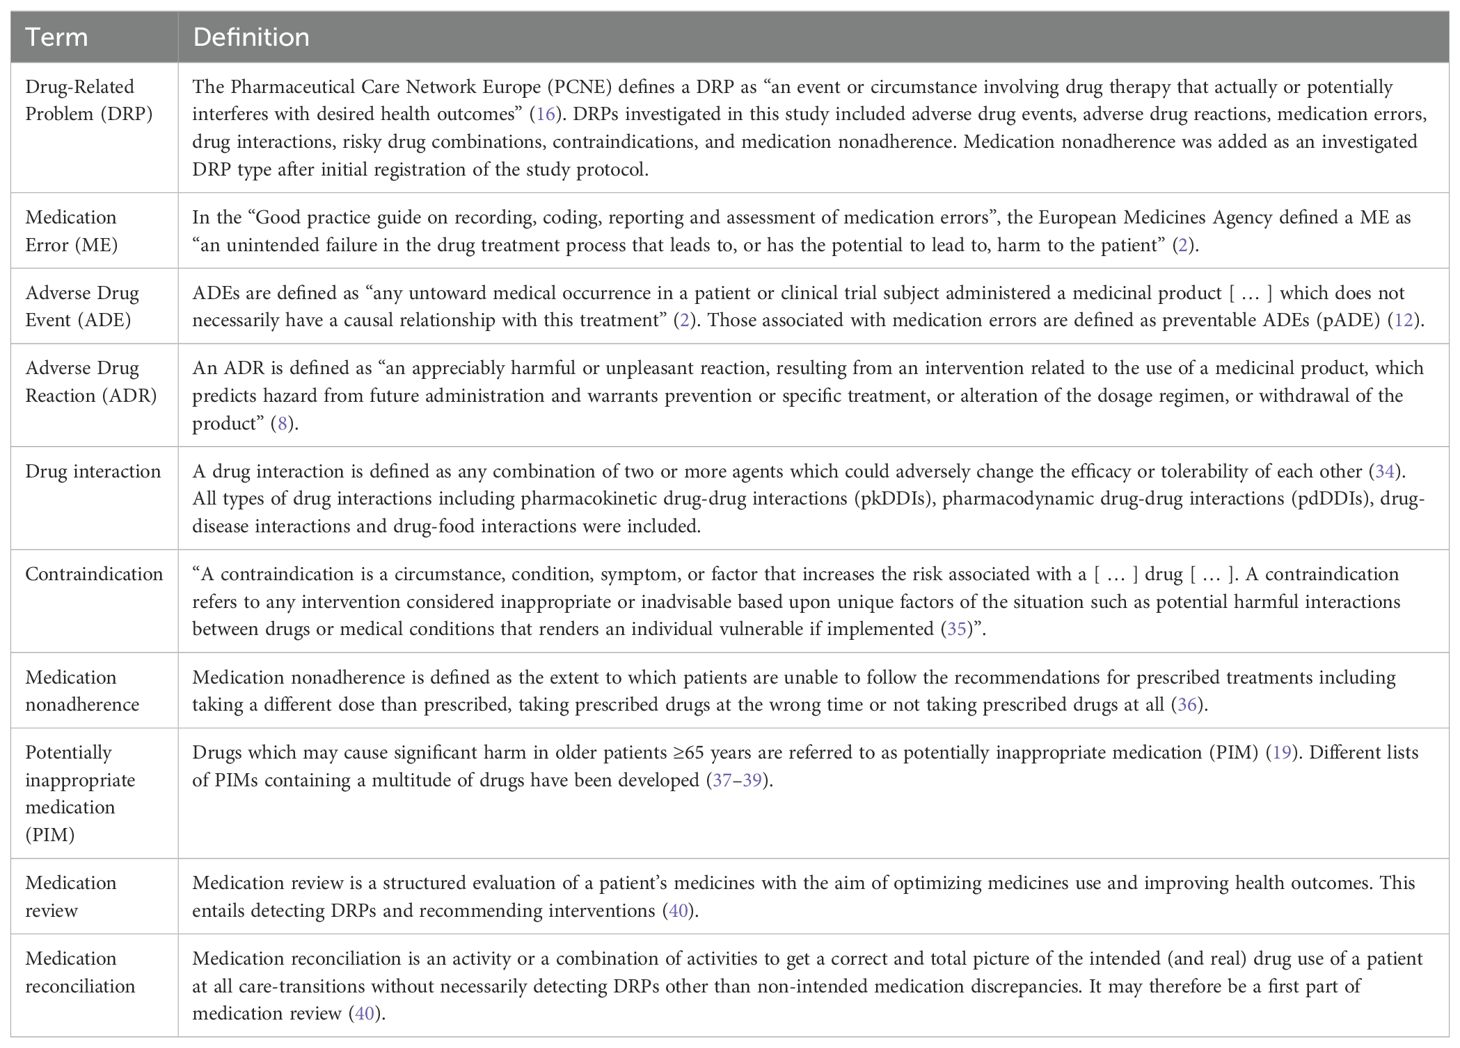
Table 1. Definitions used in this review.
2.1 Search strategyA search strategy was developed using the advanced search algorithms on the six databases listed below. The keywords were searched in titles and abstracts of articles. The search strategy included seven main keywords for DRPs (drug related problems, adverse drug events, medication errors, adverse drug reactions, drug interactions, contraindications and combination) and nine keywords for the study population and setting (psychiatry, mental health, inpatients, hospital, tertiary care, day hospital; NOT pediatric, children, adolescent). For the full search strategies, see the Supplementary Material. All types of studies published in English, German or French language between 1 January, 1999 and 31 December, 2023 were included. The language restriction was chosen because most relevant articles were expected to be published in these languages. The year 1999 was chosen as it was the year the report “To err is human” was written (1) and 1999 and 2000 were the years commonly used as starting dates for similar literature reviews (12, 25). The search strategy was tested by one author (KW) and discussed with two further authors (PR, GH) before the start of the main search.
2.2 Information sourcesThe following databases were searched in October 2022: MEDLINE via PubMed, Scopus, Google Scholar, The Cochrane Library, including the Cochrane Database of Systematic Reviews, PROSPERO, and clinicaltrials.gov. An alert was created on PubMed, Scopus and the Cochrane Library to receive new search results for the saved searches weekly via e-mail until December 2023. In addition to the protocol-driven search, the reference lists of the studies included in the review were checked manually for any relevant studies not identified by the computerized literature search and further relevant articles personally known by the study authors were checked against eligibility criteria (41).
2.3 Eligibility criteria2.3.1 Inclusion criteriaAll study types (including reviews and meta-analyses) were included, e.g. qualitative studies and surveys, prospective studies, retrospective studies, and case reports, that investigated a case or the prevalence of DRPs in psychiatric inpatients or patients in day hospital care and/or potential interventions aiming to solve them as primary or secondary outcomes if they included adult patients older than 18 years and if they were published between 1 January 1999 and 31 December 2023 (instead of 31 October 2022 as originally planned).
Both randomized and non-randomized interventional studies were included, as it is difficult to randomize groups when observing and analyzing DRPs. Most relevant studies were expected to have used a non-randomized study design. Since randomized controlled trials produce a higher level of evidence, studies were also included if they used a randomized design.
Multiple different classification systems for DRPs have been reported and translated to different languages for clinical use, e.g. “The PCNE Classification” for DRPs (42) and the NCC MERP Taxonomy of Medication Errors (43). Regardless of the classification system used, all reported DRPs from studies meeting inclusion criteria were included in the review.
After initial registration of the study protocol, it was specified that case reports on DRPs, especially ADRs caused by MEs, studies conducted in day hospital care and articles reporting either DRP prevalence rates or interventions to solve them, but not necessarily both, would be included in this review.
2.3.2 Exclusion criteriaStudies were excluded if full-text articles were not available, if they were conducted in general hospitals and data from the psychiatric department could not be extracted, if the methodology used to identify DRPs was not sufficiently described, if they reported ADR only for a specific drug or drug group without assessing an intervention for their prevention, and if statistical testing to evaluate their conducted interventions to solve DRPs was not performed. Commentaries, editorials, viewpoint articles, letters, and further additionally added article types after registration of the study protocol (books, study protocols of uncompleted studies, phase I or II clinical trials, poster and conference abstracts) were also excluded.
During full text screening, it was decided that all articles which reported the prevalence of potentially inappropriate medication (PIM) in elderly patients without any other DRPs such as ADRs as defined in our inclusion criteria were excluded. This decision was based on the fact that there is not a gold standard for content-related appropriate medication prescriptions and PIM does not necessarily have to lead to a manifest DRP in a patient prescribed with one of these drugs.
2.4 Selection processTitles and abstracts identified in the computerized searches on the six databases were screened for eligibility by one author (KW). Two authors (PR, GH) approved the screening based on a random of 10% of the studies (290 of 2827 articles), a good agreement (≥ 80%) of 84.8% (246/290 articles) was achieved. Included studies were approved by three authors (KW, PR, GH). In case of disagreement, studies were discussed and deliberated about whether all inclusion and exclusion criteria were met. In case of uncertainty, the articles were retained for full text screening.
2.5 Data collection process and data itemsTwo separate data extraction forms were developed to collect data from original studies and from (systematic) reviews, respectively. To ensure that the data extraction forms were comprehensive and that the data collection process was reliable, data extraction was performed independently for 20 articles during full text screening by three authors (KW, PR, GH). After achieving a good agreement of more than 80%, data from the remaining full texts was extracted by one author (KW) to save time resources (44). Types of DRPs were categorized according to categories listed in the guideline for medication management in pharmacies by the German Chamber of Pharmacists (45). Further categories were added based on the PCNE classification of DRPs V9.1 (46). All DRP classification categories used in this review with their corresponding definitions are listed in Table 2. The following data was collected from original studies: Title, authors, country, year of publication, demographics, aim and objectives of the study, study setting, study design, duration of the study, sample size, inclusion and exclusion criteria, data collection method, data collectors, type of prescription process (paper/electronic charts), DRPs identification method, types, subtypes and rates of DRPs investigated, drugs responsible for DRPs, number of patients with DRPs, total number of DRPs, severity of reported errors, if blood concentration of drugs was analyzed and correlated with DRPs (especially ADRs), if applicable: description of intervention to solve DRPs, unsolved DRPs after the intervention, statistical methods, and funding sources. The following data was additionally collected from (systematic) reviews: databases used for literature search, overall rates of DRPs.
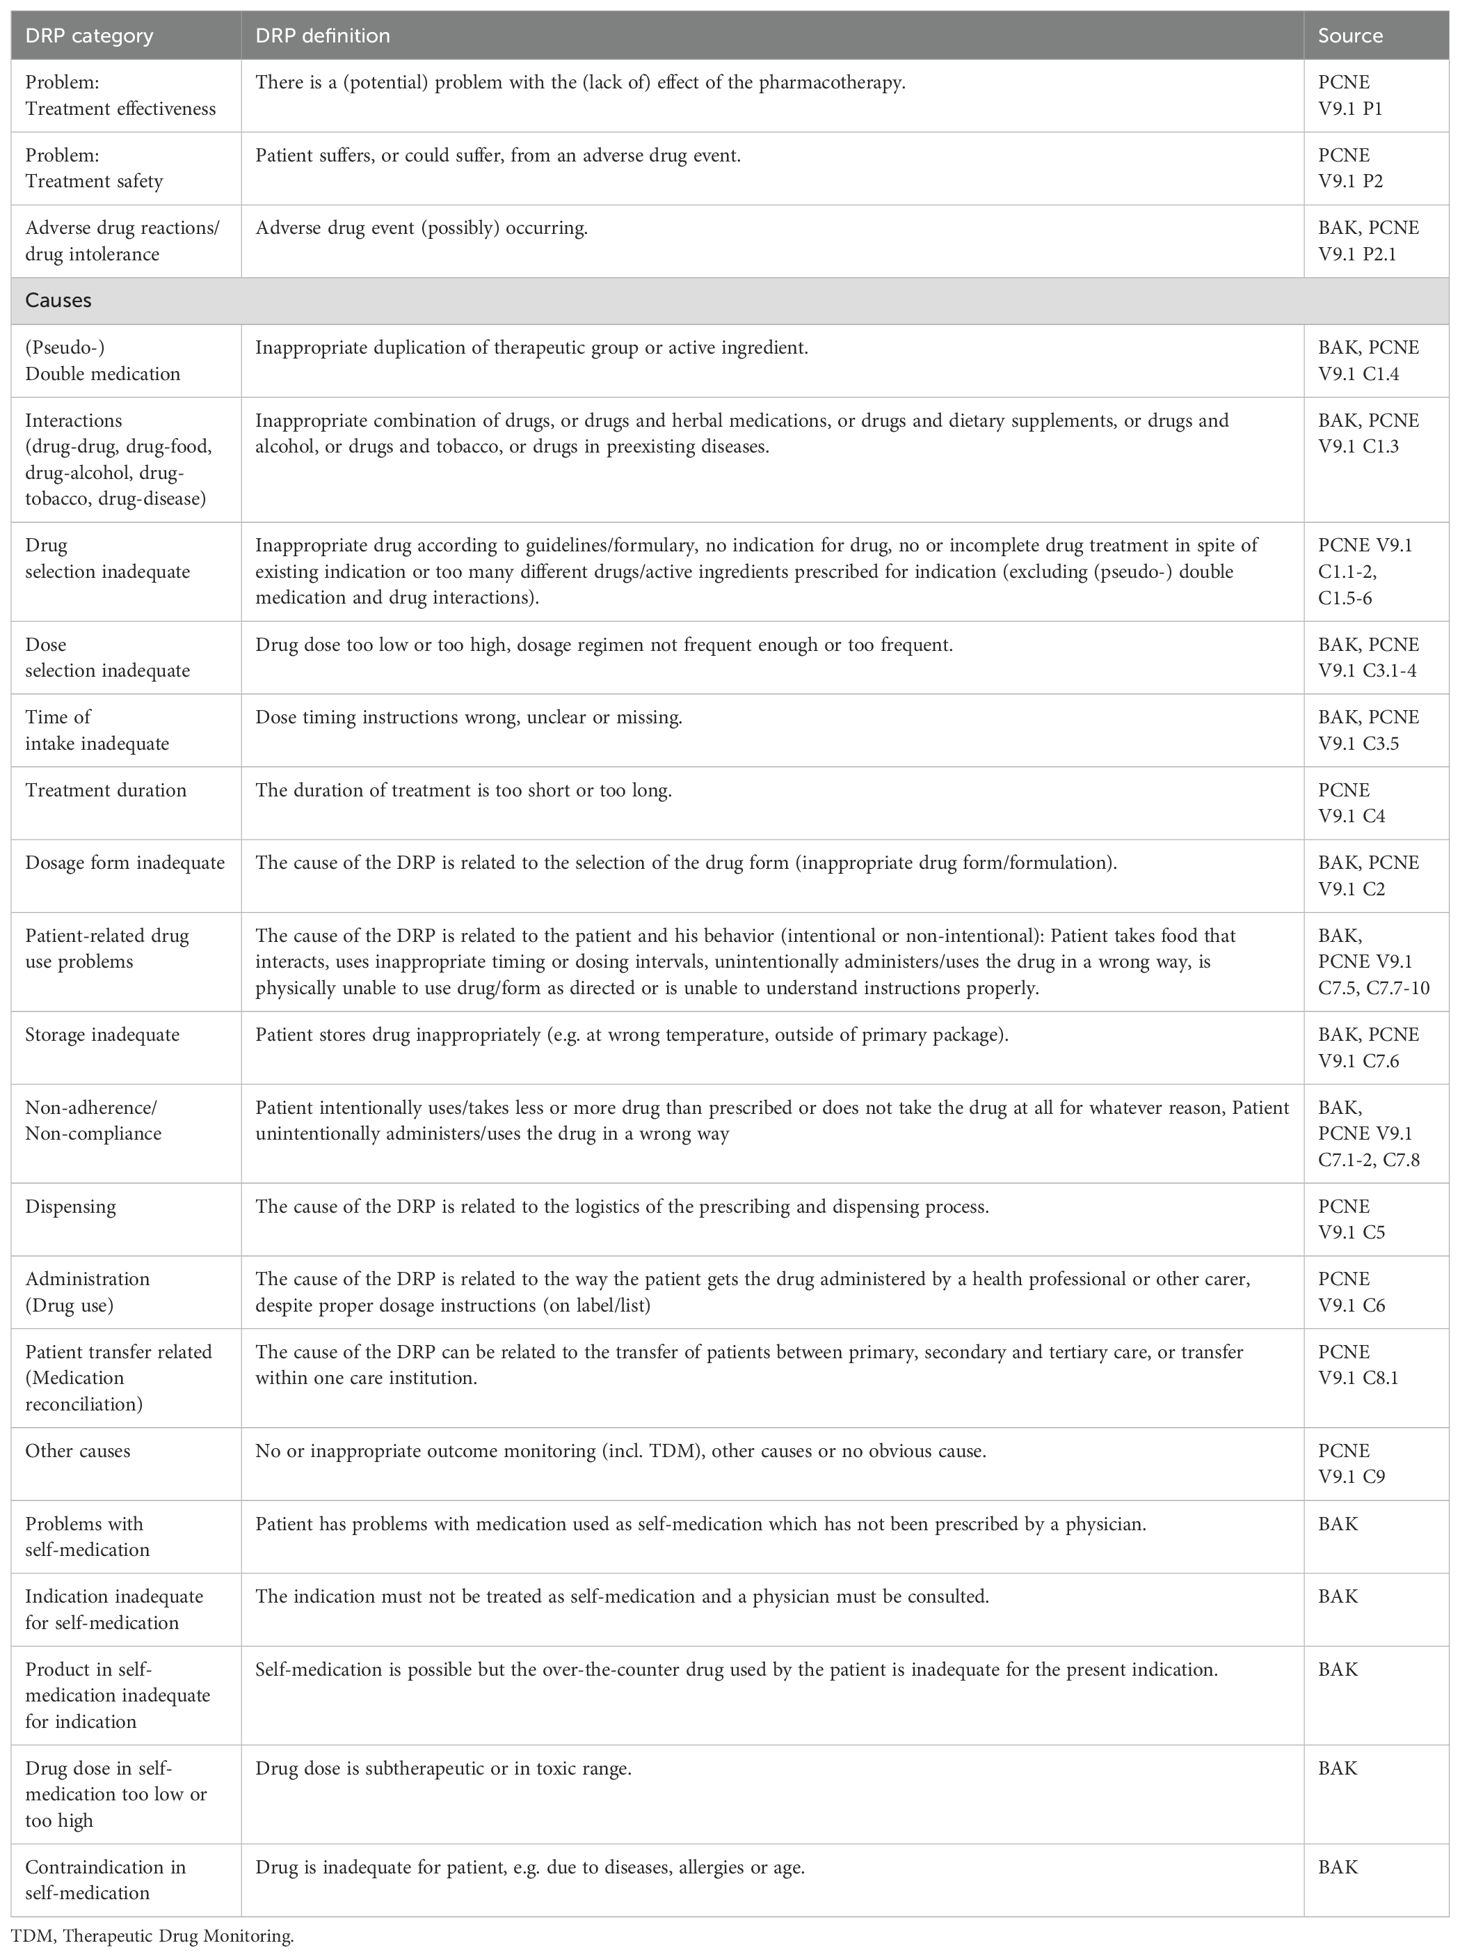
Table 2. Drug-related problem (DRP) classification categories and their definitions based on the guideline for medication management by the German Chamber of Pharmacists (BAK) (45, 47) and the PCNE classification of DRPs V9.1 (46).
2.6 Quality and bias assessmentsQuality and bias of included studies were assessed by one author (KW).
2.6.1 DRP reporting quality assessmentQuality assessment of the individual studies regarding reporting of DRPs was based on the criteria established by Allan and Barker (1990) (48), which have previously been used for other systematic reviews on MEs (12, 49, 50). A maximum of 12 points corresponding to high quality could be reached (Table 3).
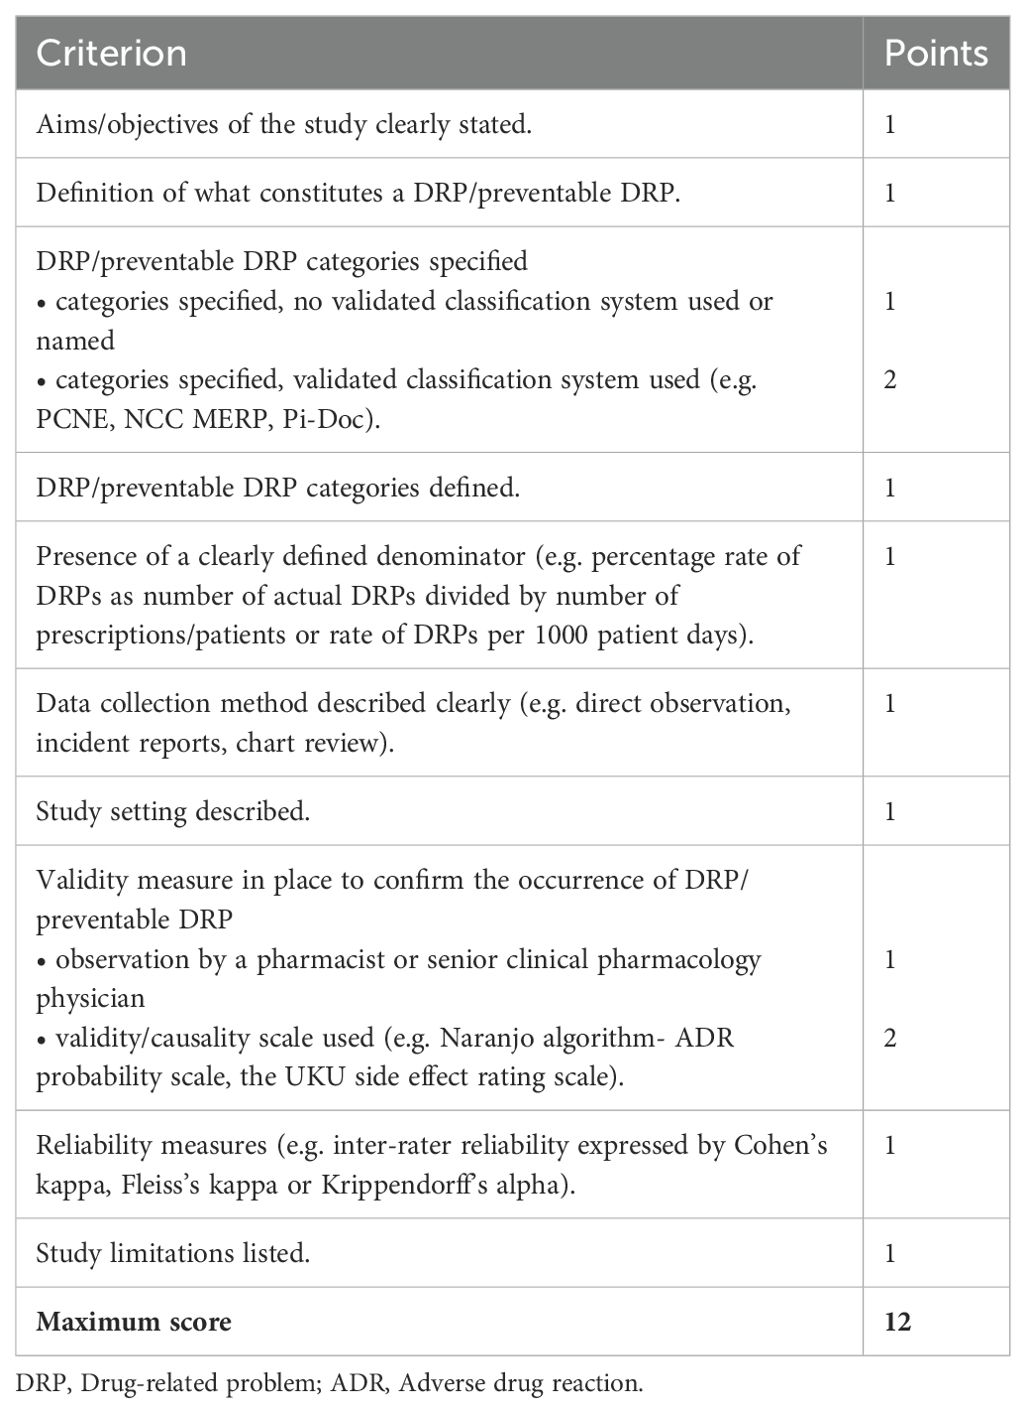
Table 3. Criteria for the quality assessment of included studies based on the criteria established by Allan and Barker (48).
Due to the heterogeneity of DRPs and since no validity measure for the detection of DRPs has been defined as gold standard, the observation of DRPs by a pharmacist or by a senior clinical pharmacology physician (1 point in the quality assessment) was considered as a poorer validity measure than the use of a validated validity or causality scale (2 points in the quality assessment; e.g. Naranjo algorithm-ADR probability scale, UKU side effect rating scale). To rule out the subjectivity of detection of DRPs, a study on DRPs with high quality should have assessed inter-rater reliability by calculating a reliability coefficient.
2.6.2 Study type specific quality assessmentThe selected studies were assessed for bias by the applicable JBI critical appraisal checklists by the University of Adelaide, available at https://jbi.global/critical-appraisal-tools (51). A total score achieved out of all study type specific criteria was calculated. The risk of bias was ranked according to the JBI criteria with ≤ 39% as high, 40% to 69% as moderate and ≥70% as low risk of bias.
2.6.3 Risk of bias assessmentAn assessment of meta-biases such as publication bias across studies and selective reporting within studies was completed. To achieve a high standard of reporting the updated ‘Preferred Reporting Items for Systematic Reviews and Meta-Analyses’ (PRISMA) 2020 statement (32) was adopted. Before publication, the interventional studies included in this review were assessed for bias by the AMSTAR 2 tool (44).
2.6.4 Certainty assessmentA final grading of available evidence was included in a summary of findings table of studies reporting the prevalence of DRPs or MEs using the Grading of Recommendations, Assessment, Development and Evaluation (GRADE) system (52). Interventions assessed in the included articles were not comparable and therefore not included in the summary of findings table.
2.7 Data synthesis and analysis2.7.1 Strategy for data synthesisStudies were aggregated based on classification of DRPs and conducted interventions. A distinction was made between manifest errors with or without an ADR, intercepted errors and potential errors with regard to preventability of errors. If study results appeared to be heterogenous in nature, underlying causes were investigated.
2.7.2 Effect measuresThe main outcomes of this review were the prevalence and types of DRPs and tested interventions. The prevalence was extracted from the included studies as the number of DRPs per 100 patients or per 1000 patient-days or per 100 opportunities for error. As an additional outcome, the percentages or rates of unsolved DRPs after an intervention were included from interventional studies. Furthermore, the included articles were checked for the availability of correlations between blood concentration of drugs and prevalence of DRPs, especially ADRs.
2.7.3 Data analysisThe included study data were inconsistent as different methods for detection, classification and reporting of DRPs were used. Therefore, a quantitative meta-analysis of the prevalence rates was not possible. Instead, results were summarized separately for each DRP category. The rate of DRPs, ADEs and MEs was usually calculated as a percentage rate of all patients/prescriptions or as a rate of DRPs, ADEs or MEs per 1000 patient days. The percentage rate of DRPs was calculated by dividing the number of actual DRPs that occurred or number of patients or prescriptions affected by DRPs by the total number of prescriptions or patients multiplied by 100. The rate of DRPs per 1000 patient days was determined by dividing the number of DRPs by the total number of patient-days multiplied by 1000.
2.8 Analysis of subgroups or subsetsWhen DRPs were not generally reported in a study, the prevalence rate per 100 patients or rate of a specific DRP (e.g. ADE, drug-drug interaction (DDI)) per 1000 patient-days was calculated. A subgroup analysis for DRPs in patients ≤ 65 years or > 65 years was planned but not calculated as few studies reported corresponding data.
3 ResultsIn the main literature search, 3509 records were identified from the databases. Among the total of 255 reports assessed for eligibility during full-text screening, 182 did not meet inclusion criteria and were therefore excluded. The remaining 73 studies were included in the review. By screening the reference lists of included studies and of excluded reviews, 12 additional studies were identified. Two further studies were identified using a snowballing technique based on the most relevant studies on DRPs retrieved in the main search. Lastly, one additional recently published study meeting inclusion criteria came to the attention of the study team. Overall, 88 studies were included in the review. The details of the search and selection process are presented in a PRISMA flow diagram (Figure 1). A list of excluded studies assessed for eligibility by full text screening and the respective justifications for exclusion is available online in the Supplementary Material as an Excel sheet.
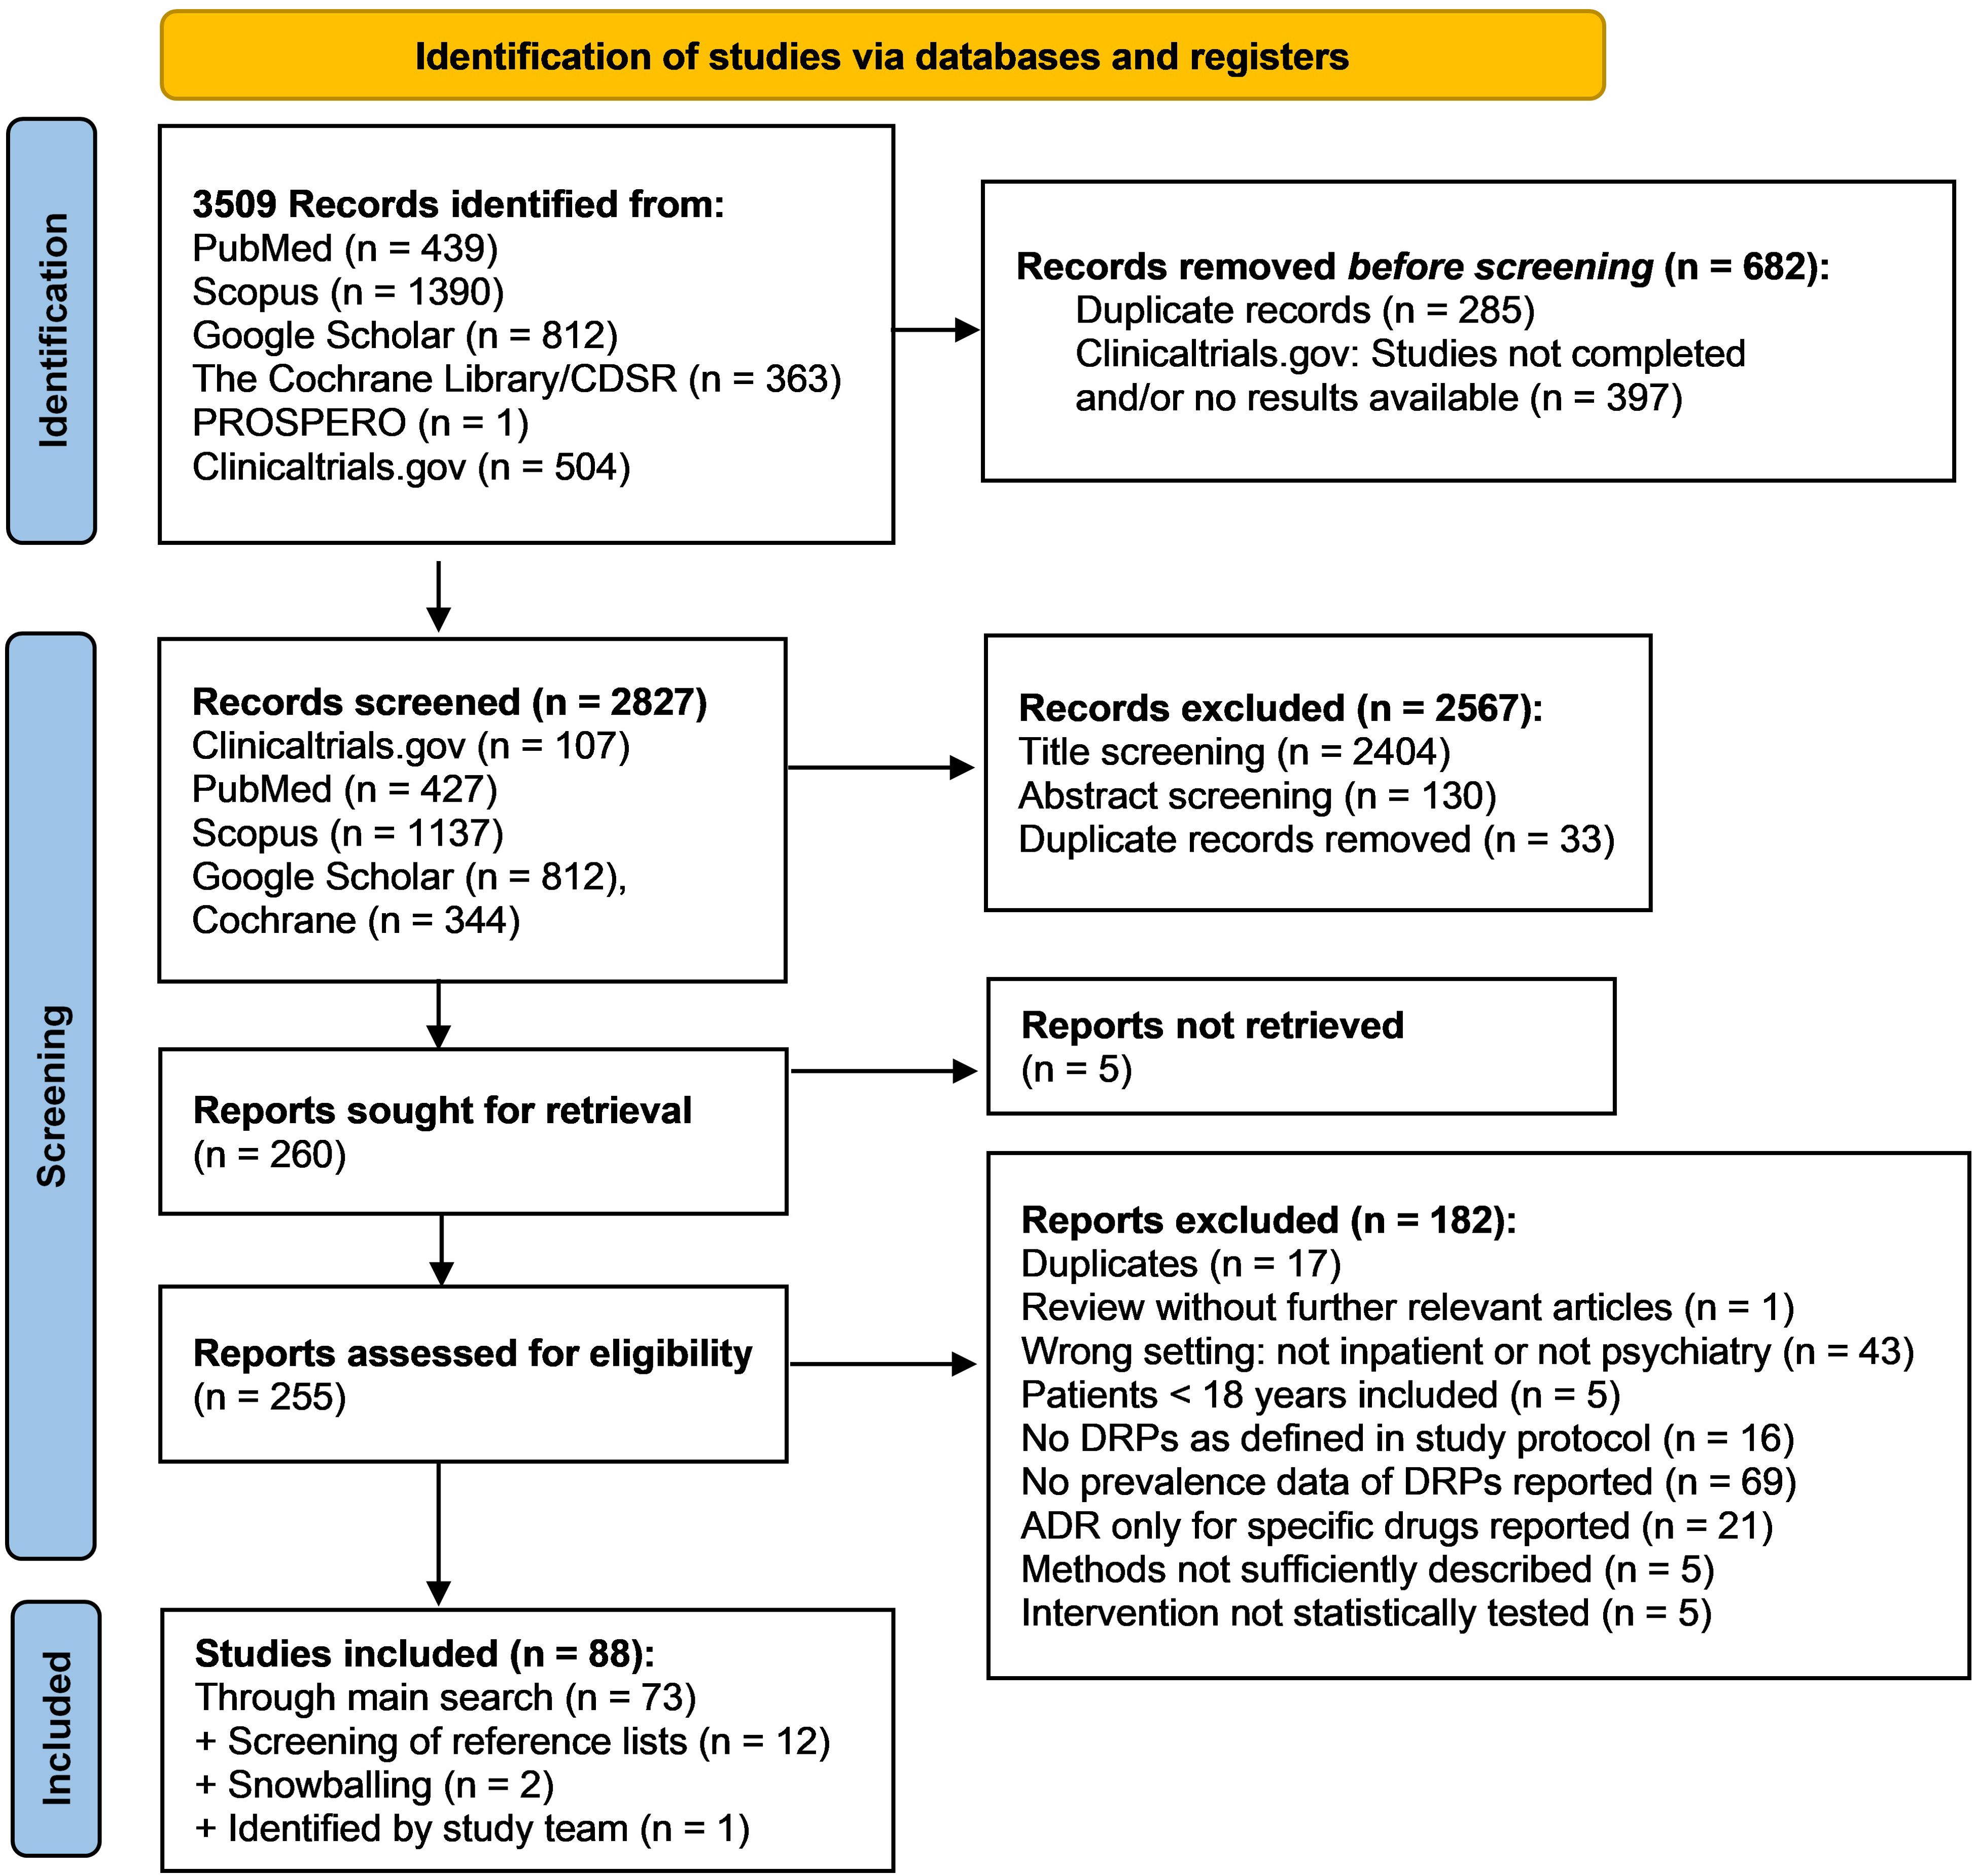
Figure 1. PRISMA flow diagram (32) of the search and selection process of studies for inclusion in the review.
3.1 Characteristics of included studiesAmong the 88 articles included in the review, 39 were prospective, observational studies (7, 13, 20, 53–88), 30 were retrospective studies (21, 89–117), two were mixed-methods studies (4, 118), and four were case series or case reports (119–122). 13 interventional studies were identified, eleven of them used a prospective (123–133) and two a retrospective design (134, 135). No review identified in the literature search met inclusion criteria as none was conducted only in inpatient settings. Overall, DRPs identified in 95.425 adult subjects (45.7% female, if reported) and by incident reports based on 192.372 admissions were included. In six reports, the number of subjects or admissions was not reported. Data synthesis of demographic characteristics was not possible due to the methodological heterogeneity of the studies. For each individual study, demographic details are shown in the data extraction form in the Supplementary Material.
The studies were conducted in various countries world-wide (Figure 2). 53 studies were conducted in Europe: 14 in Germany (61, 63, 66, 71, 90, 94, 96, 97, 105, 109, 122, 123, 128, 134), eleven in the UK (21, 53, 54, 69, 75, 80, 83–85, 101, 124), six in France (55, 60, 76, 79, 89, 114), five in Denmark (4, 86, 103, 113, 131), two each in Belgium (58, 59), Sweden (64, 99), The Netherlands (70, 104), and Turkey (92, 133), one study each in Austria (67), the Czech Republic (121), Montenegro (130), Norway (62), Portugal (68), Serbia (81), Spain (7), and Switzerland (20), and one multicentric study was conducted in Germany and Switzerland (95). 17 studies were conducted in the USA (13, 56, 65, 78, 91, 93, 100, 106, 107, 115, 118–120, 125–127, 135). Eight further studies were conducted in India (72–74, 77, 82, 88, 110, 111), five in Japan (57, 98, 102, 129, 132), two in Pakistan (108, 117), and one study each in Australia (112), Brazil (116) and Saudi Arabia (87).
Eight of the included studies reported the prevalence of DRPs in general (72, 87, 88, 96, 103, 110, 123, 130) and included a total of 2.208 psychiatric inpatients. Five of these studies described the results of interventions to solve DRPs (87, 88, 103, 123, 130), the other three were non-interventional studies (72, 96, 110). None of these studies reported blood concentrations of drugs involved in DRPs. Two further studies reported the prevalence of different types of DRPs including drug interactions, contraindications, and prescription errors (PEs) without aiming to include DRPs in general (63, 105).
The remaining 78 studies assessed the prevalence or cases of specific types of DRPs such as ADEs, ADRs, drug-drug interactions or prescription errors. 36 studies reported ADEs or ADRs, some among other types of DRPs (7, 20, 21, 56, 61, 62, 64, 66, 67, 70, 71, 73, 74, 77, 89, 91–93, 95, 98–100, 102–104, 107, 109, 113, 119, 120, 122, 125, 126, 128, 133, 134). 24 articles assessed the prevalence of drug interactions (54, 56, 58, 59, 76, 77, 81–83, 91, 92, 94, 97, 101, 108, 111, 112, 115–117, 121, 122, 128, 134). 26 studies reported on MEs; seven of them in general (4, 13, 57, 78, 102, 107, 118), five of them on MAEs (53, 80, 85, 93, 124) and 14 articles focused on PEs including transfer-related PEs (55, 60, 65, 68–70, 75, 79, 84, 86, 106, 114, 131, 135). Lastly, 5 studies assessed medication adherence or medication (non-) compliance as a subtype of DRPs (90, 127–129, 133).
The characteristics of studies reporting prevalence data, interventional studies and case reports are presented in Figure 3. An interactive online version of this tree map is also available (https://public.flourish.studio/visualisation/17502062/). Users can further explore the investigated DRP types and DRP detection methods using the interactive tree map (Figure 4).
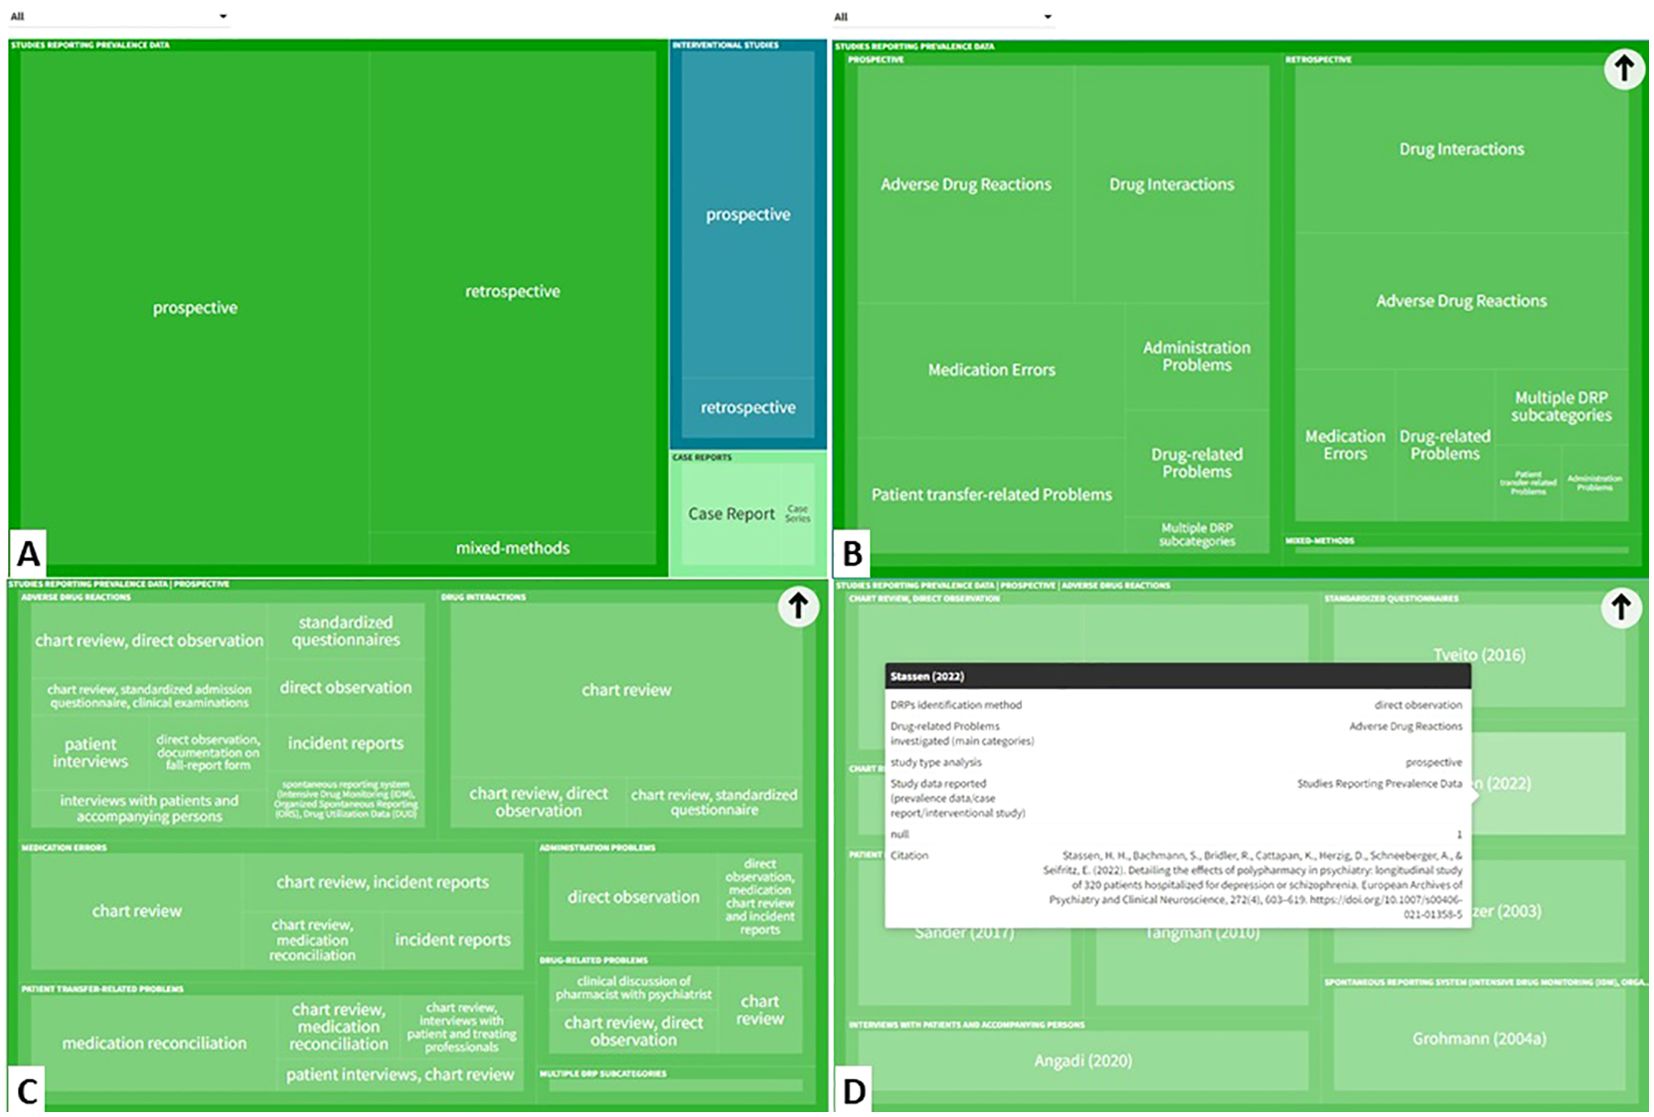
Figure 4. The interactive tree map available online can be explored by users in a hierarchical order: (A) Study type > (B) DRP categories investigated > (C) DRP detection method > (D) Individual references reporting this category/subcategory/variable permutation). (https://public.flourish.studio/visualisation/17502062/). Created with flourish.studio (https://flourish.studio). DRP, Drug-related problem.
3.2 Quality and bias assessments3.2.1 DRP reporting quality assessmentThe quality assessment of all included studies except the four case reports based on the criteria established by Allan and Barker (48) resulted in a median score of 8 points (out of 12 possible points; interquartile range, IQR: 2, range: 2-11). 82 out of 84 reports (97.6%) clearly describe the aims and objectives of the study. 78 of the reports (92.9%) describe the setting and 81 (96.4%) the data collection method. Regarding the reporting quality of DRPs, fewer studies fulfilled the criteria: 60 reports (71.4%) included a definition for their assessed DRPs, 18 reports (21.4%) specified DRP categories and used a validated classification system whereas 40 (47.6%) specified DRP categories but did not use or name a validated classification system. 35 reports (41.7%) defined the respective DRP categories. For 17 reports (20.2%), DRP categories and their definitions were no applicable criteria as no different DRP categories were assessed in these studies. A clearly defined denominator (e.g. percentage rate of DRPs as number of actual DRPs divided by number of prescriptions/patients or rate of DRPs per 1000 patient days) was present in 50 studies (59.5%). For one study, it was not an applicable criterion as the study assessed an intervention for the improvement of medication adherence without reporting any prevalence data (129). 21 studies (25%) used a validity or causality scale and 42 (50%) reported DRP observation by a pharmacist or senior clinical pharmacologist as validity measures to confirm the occurrence of DRPs. Thus, a total of 63 of the 84 reports (75%) included in the review, applied a validity measure. Reliability measures (e.g. inter-rater reliability assessment) were used in 30 articles (35.7%). Finally, in 68 of 84 reports (81%) study limitations were considered.
For all 31 articles which reported the prevalence of DRPs and medication errors including prescription errors in general (as opposed to only certain DRP subtypes), detailed results of the quality assessment are presented in Table 4. For these articles, a median score of 8 points (out of 12 possible points; IQR: 3, range: 4-11) was achieved.
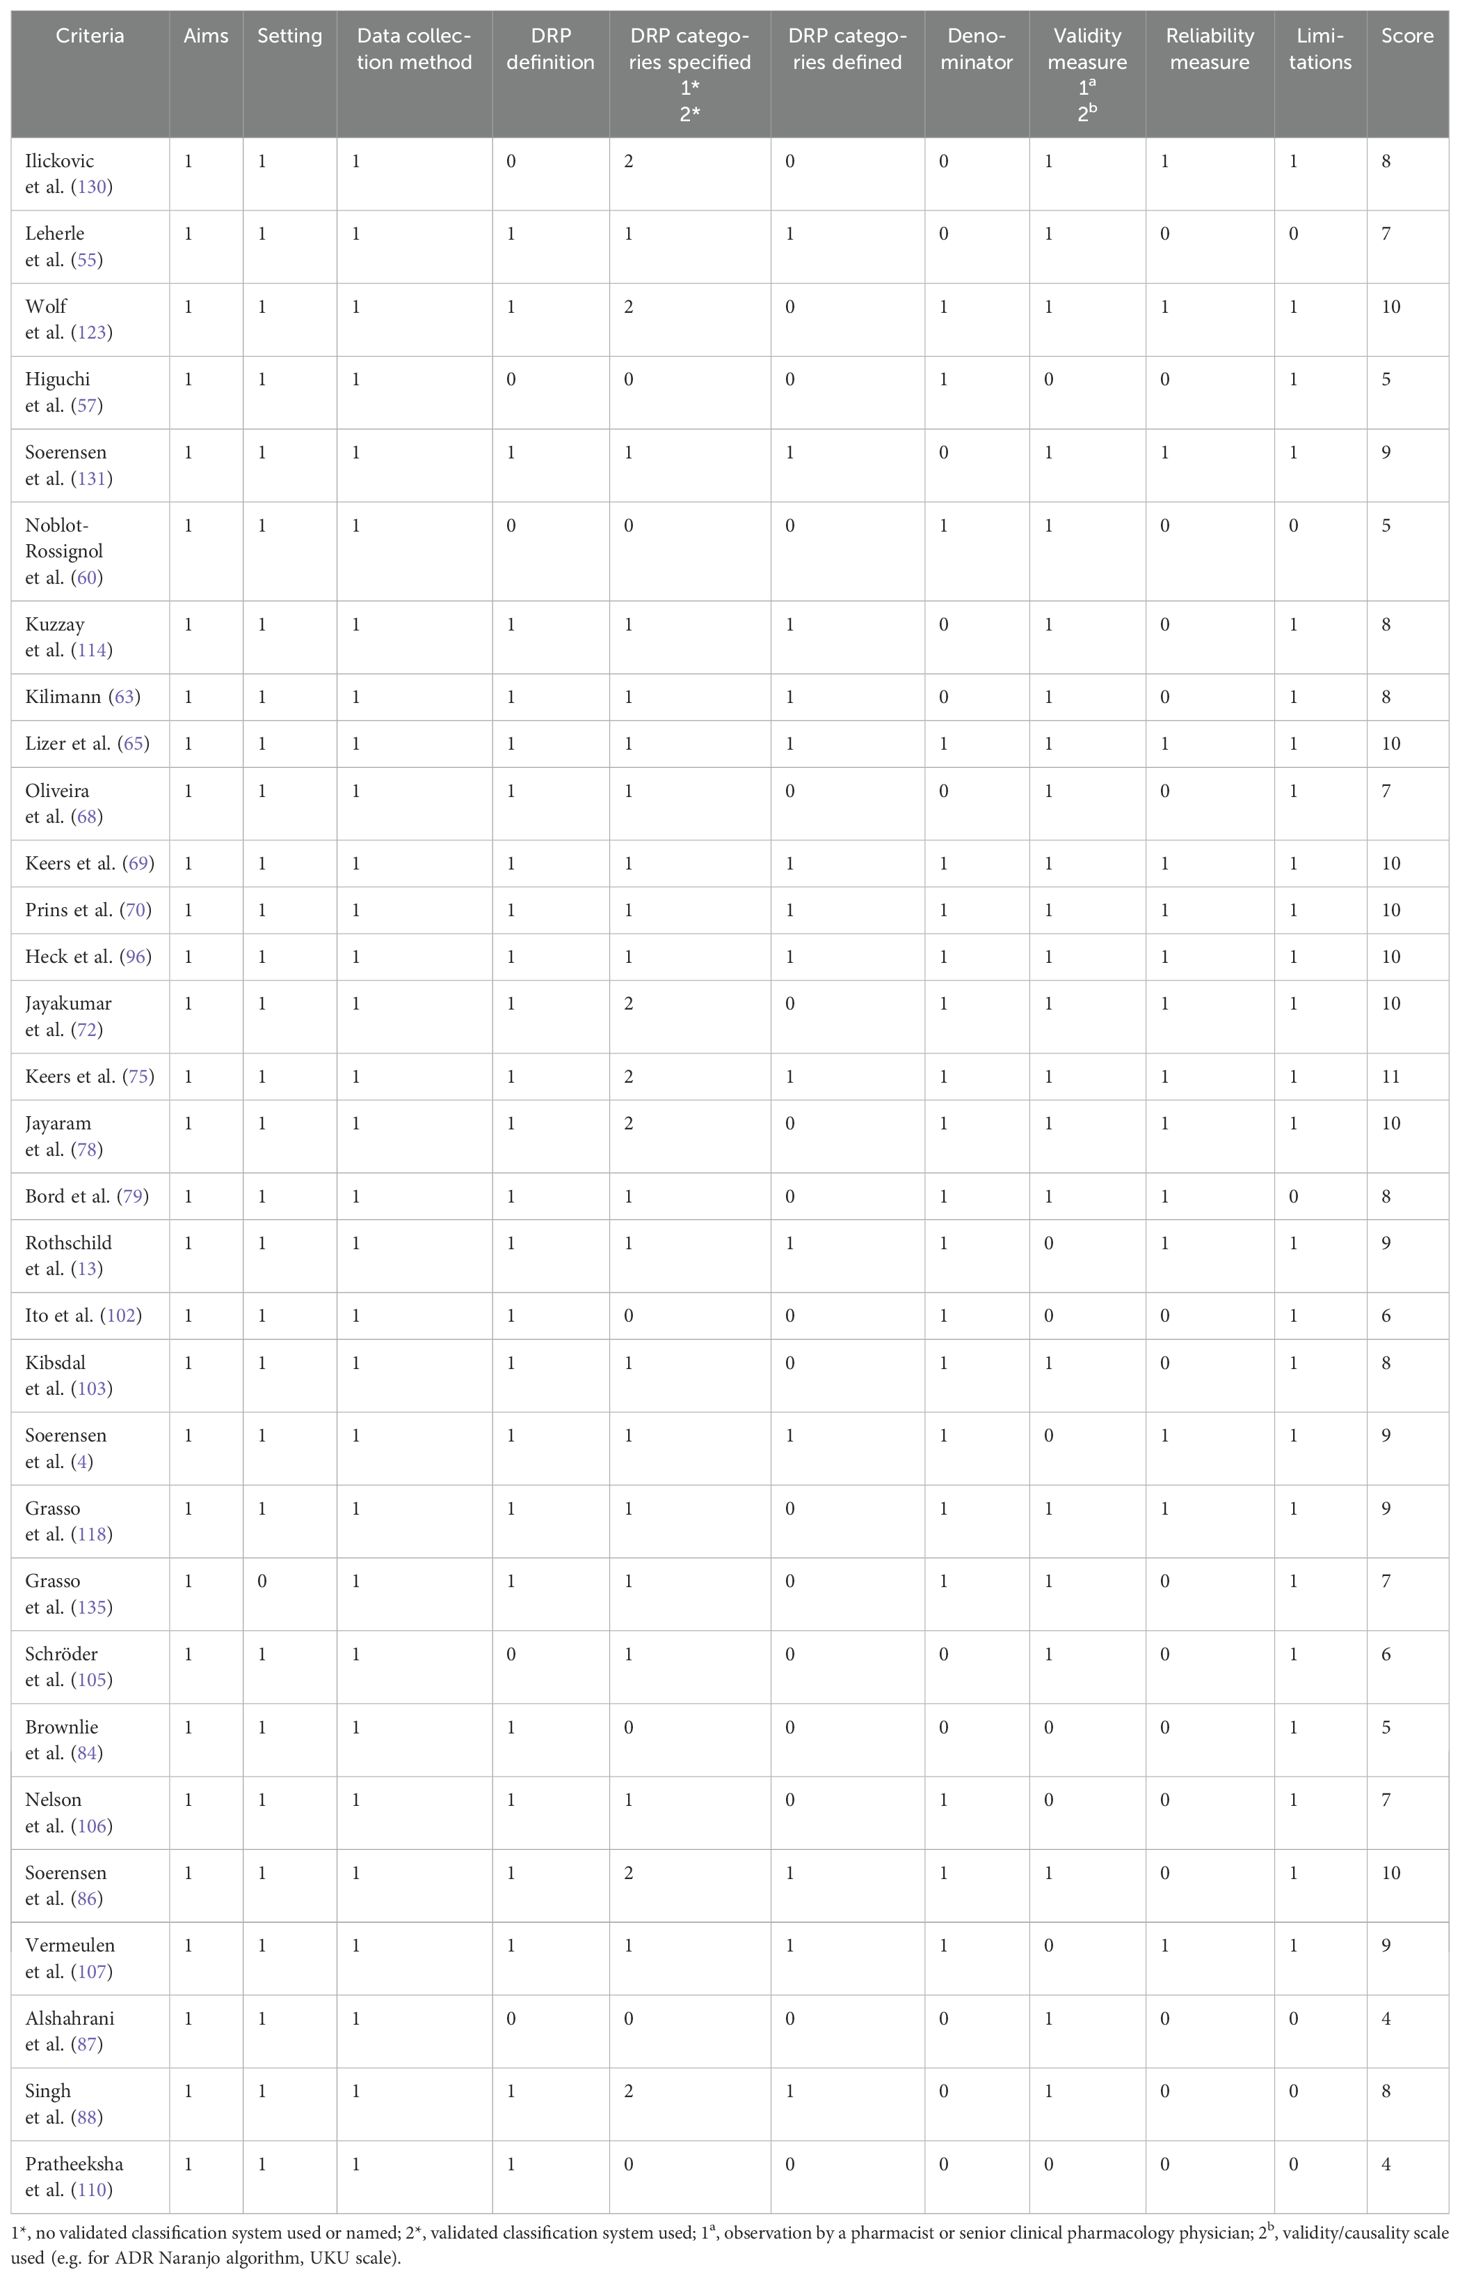
Table 4. Quality assessment of included studies which reported the prevalence of drug-related problems (DRPs) and medication errors including prescription errors, based on the criteria established by Allan and Barker (48).
3.2.2 Study type specific quality assessmentIn the study type specific quality assessments using the JBI critical appraisal checklists for studies reporting prevalence data, cohort studies and case reports a low risk of bias with a score of more than 70% was achieved for all study types.
In 70 studies reporting prevalence data of DRPs; a median score of 77.8% with 7 out of a maximum of 9 points (IQR: 2, range: 2-9) was reached.
A median score of 72.7% with 8 out of a maximum of 11 points (IQR: 2,75, range: 3-10) was achieved in 14 articles reporting the results of cohort studies.
The four case reports achieved a median score of 100% with 8 out of 8 points in the risk of bias assessment (IQR: 0.25, range: 7-8). Only one report of a case series of adverse effects requiring discontinuation of one or more of the medications in combination therapies with monoamine oxidase inhibitors and other antidepressants or stimulants (119) did not clearly describe the patients’ history and presented it as a timeline. All other criteria were met in all four articles.
3.2.3 Risk of bias assessmentThe search of grey literature was not comprehensive. Therefore, it is possible that other studies assessing the prevalence of different types of DRPs and interventions to solve them have been conducted but were not identified in this review. Furthermore, it is possible that interventions without a positive effect on reducing the prevalence of DRPs were not published by the authors or published in journals which were not indexed in the databases searched for this review, and were therefore omitted from this review.
This systematic review was assessed for bias regarding the included interventional studies by the AMSTAR 2 critical appraisal tool (44). The completed form is available online in the Supplementary Material.
3.2.4 Certainty assessmentThe final gradings of available evidence are included in the summary of findings table (Table 5). Most studies were observational studies reporting prevalence data of specific subtypes of DRPs. Only one study was designed as a randomized, controlled trial (127). Furthermore, different methods to detect DRPs were used (incident reports, chart review, direct observation, patient interviews) by data collectors with different professional backgrounds (e.g. clinical pharmacists, clinical pharmacologists, psychiatrists, nurses). Therefore, the identified prevalence rates of DRPs varied widely among studies. According to GRADE, the certainty of available evidence was rated as very low among all DRP subtypes.
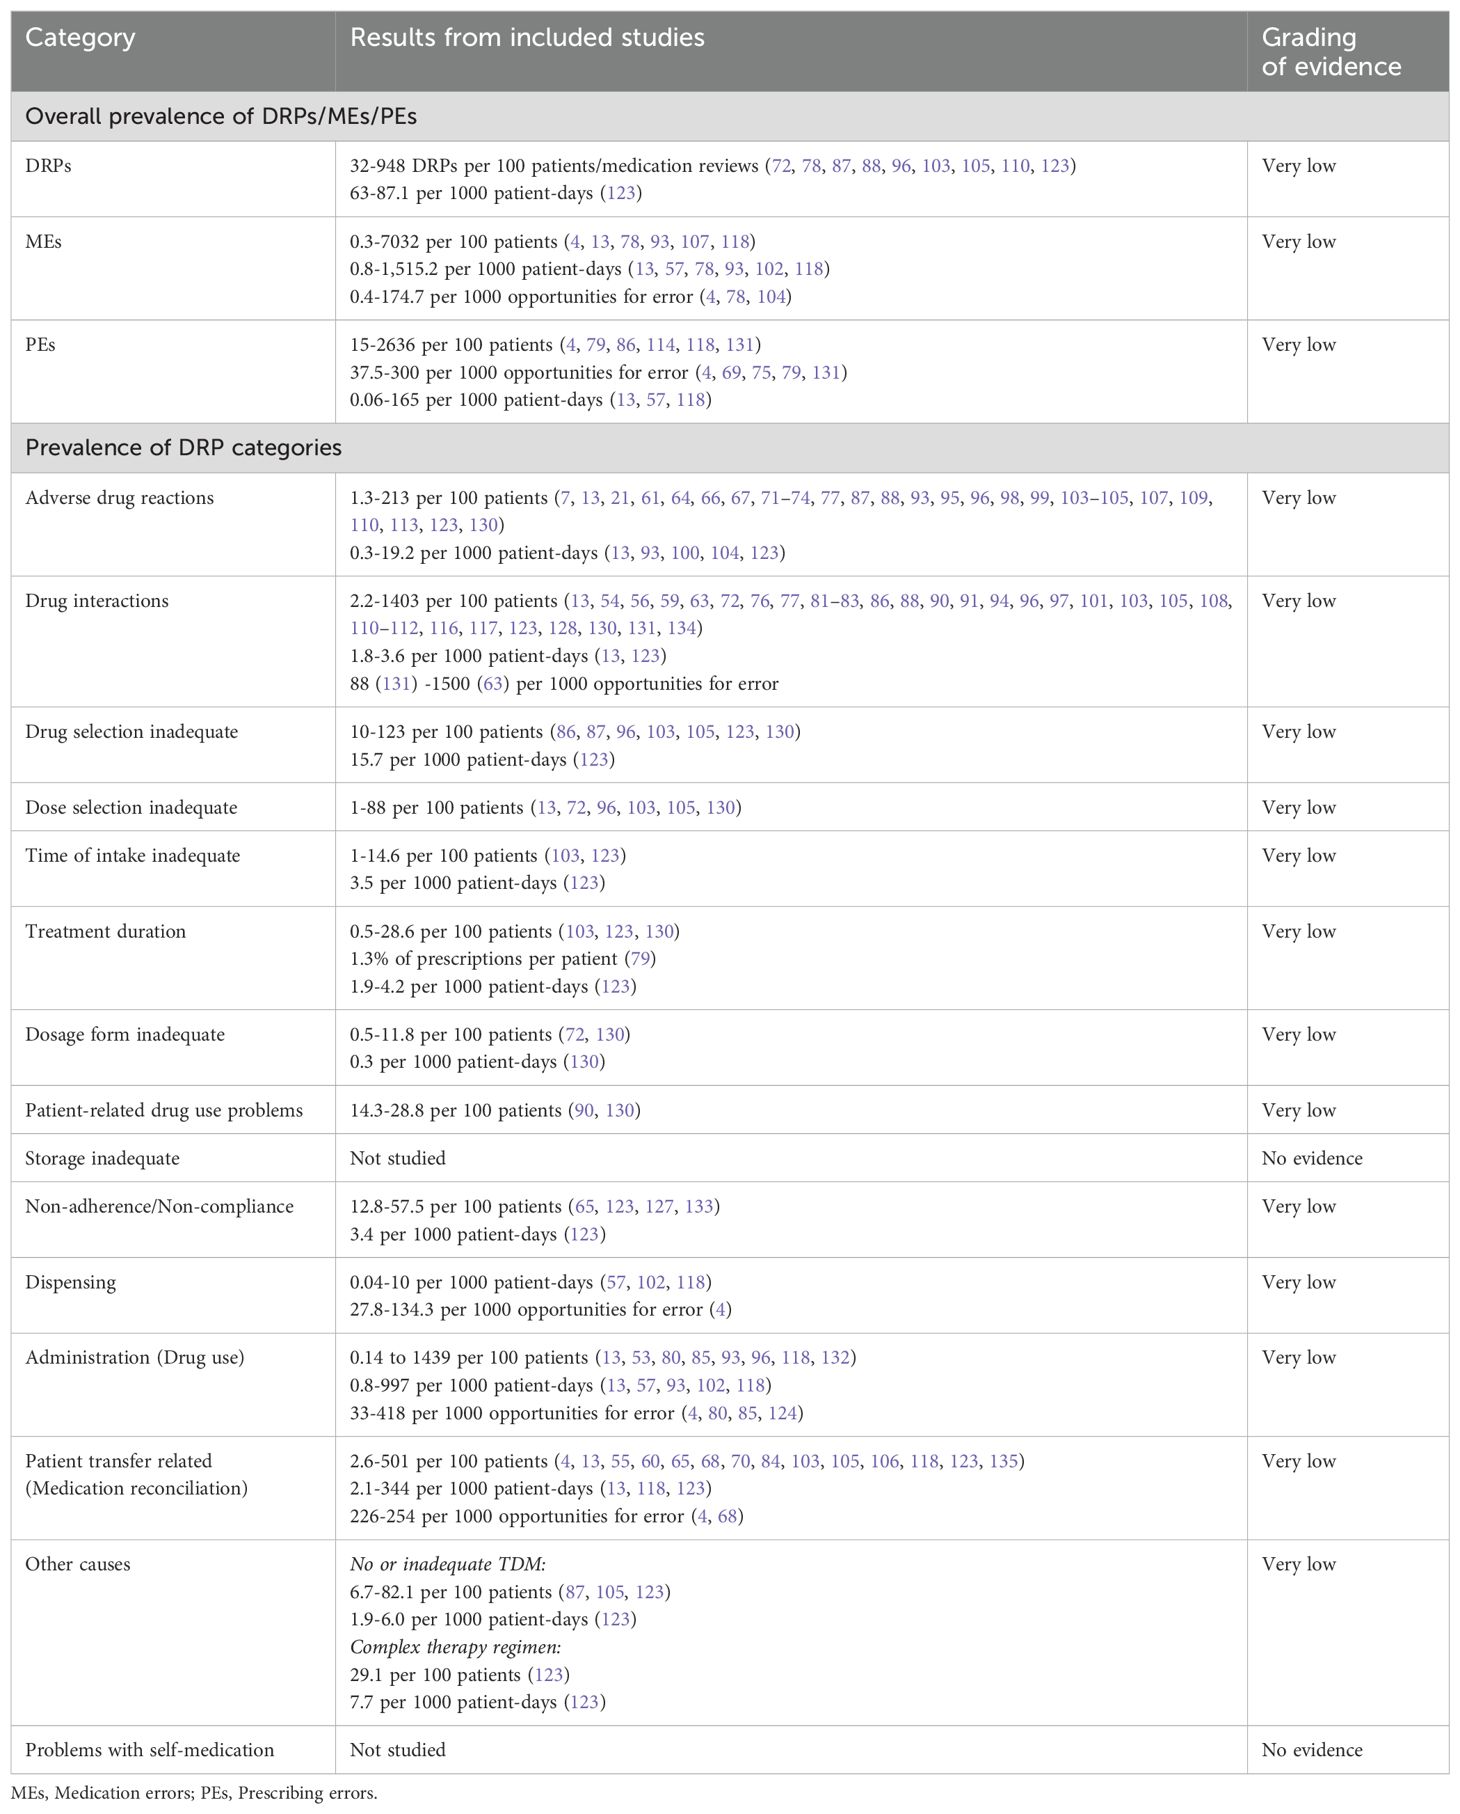
Table 5. Summary of findings table of drug-related problems (DRPs) in inpatient psychiatry based on the GRADE system (52).
The included reports of interventional studies did not present comparable clinical effect sizes and the tested interventions were not directly comparable by the reported outcome measures. Therefore, the interventions were not included in the summary of findings table.
3.3 Prevalence of drug-related problems in inpatient psychiatrySummaries of studies reporting the prevalence of DRPs or MEs in general are presented in Table 6. Their overall prevalence is presented in the summary of findings table (Table 5).
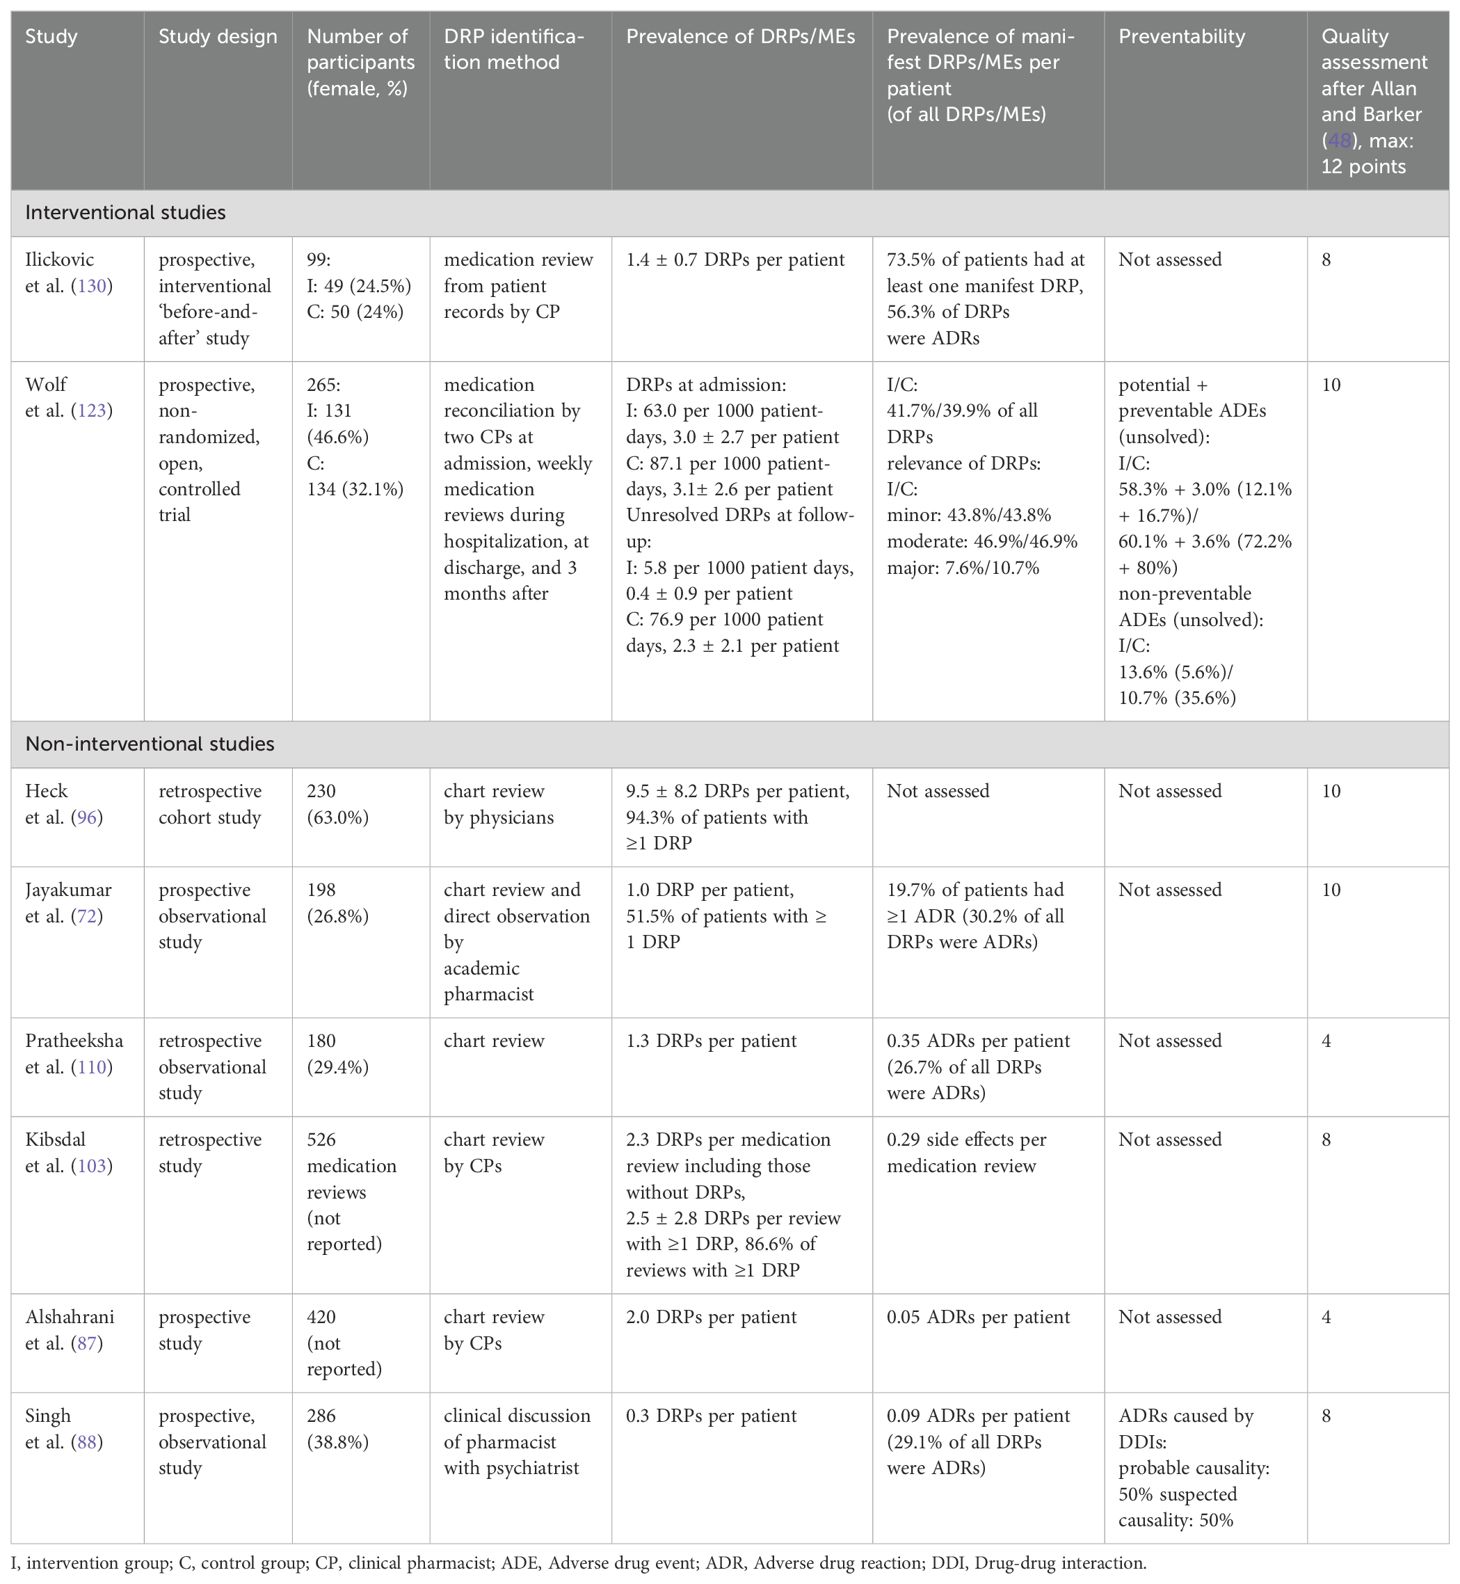
Table 6. Summary of studies reporting the overall prevalence of drug-related problems (DRPs) and medication errors (MEs) in inpatient psychiatry.
The prevalence rates of DRPs, MEs and DRP subtypes per 100 patients reported in the included studies are presented as a box plot including first quartile, median and third quartile in Figure 5. Users can further explore details of the investigated DRPs, DRP detection methods and the study specific data collectors in an interactive version of this chart, available online (https://public.flourish.studio/visualisation/17490375/).
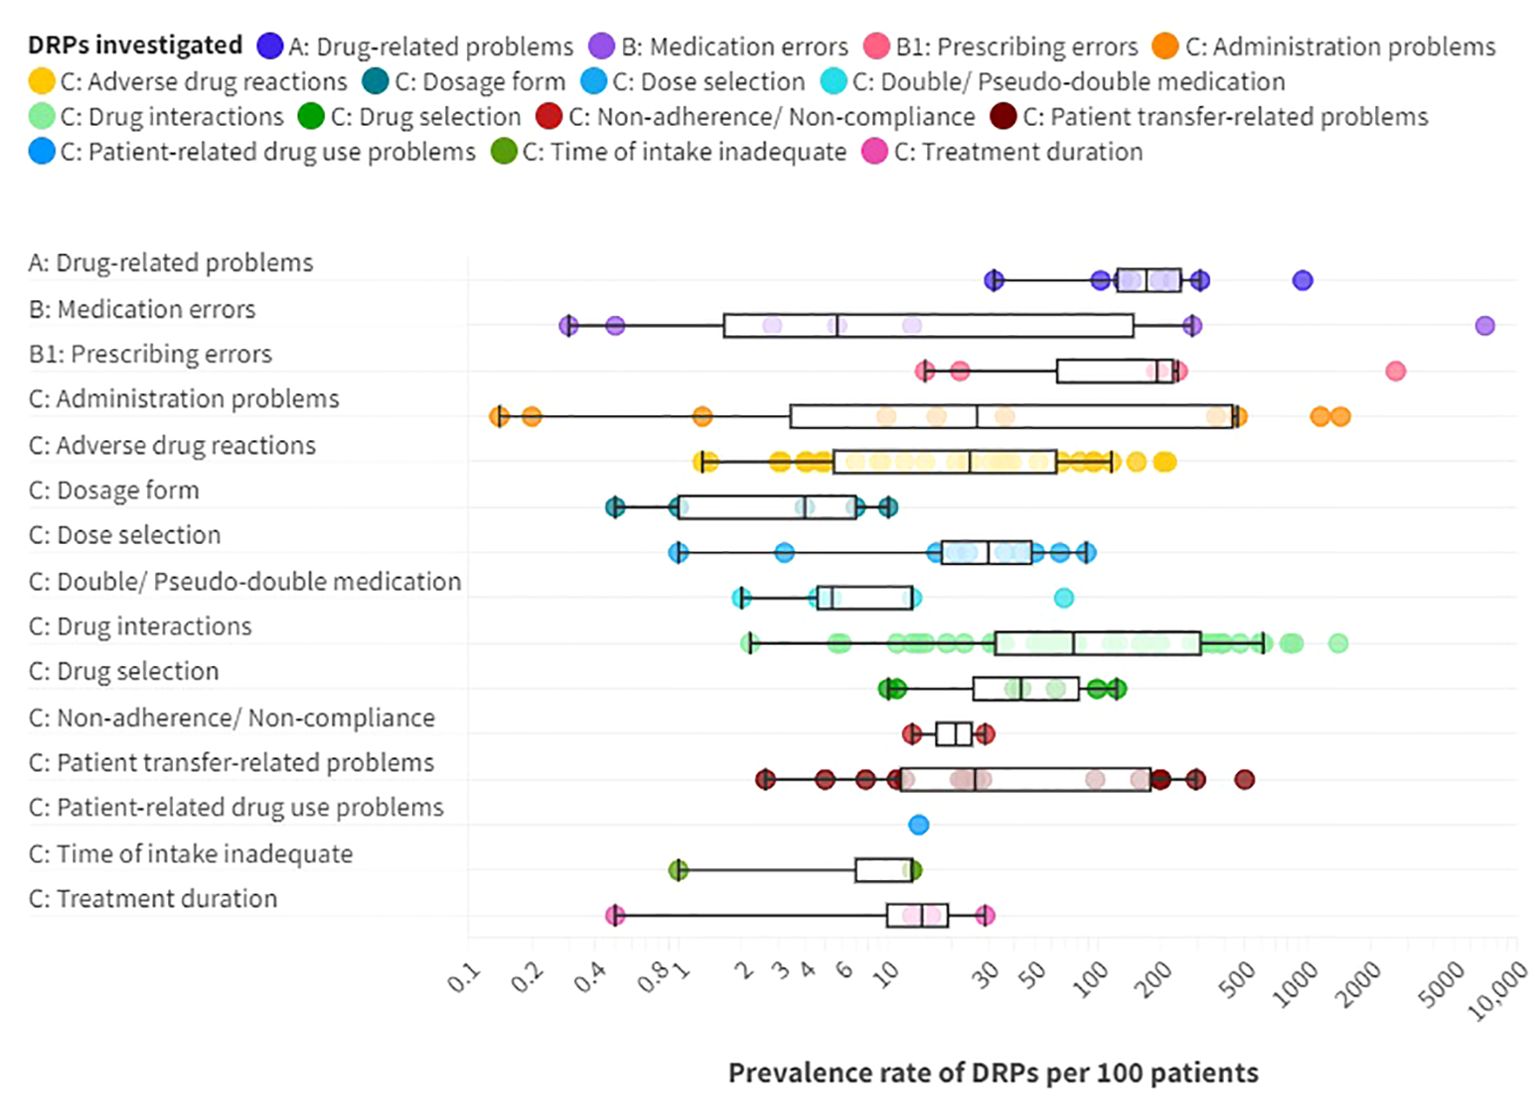
Figure 5. Prevalence rates per 100 patients of A: drug-related problems (DPRs), B: medication errors such as B1: prescribing errors, and C: DRP subtypes reported in the included articles providing prevalence data. Box plot with a logarithmic scale including first quartile, median and third quartile for each DRP category. An interactive online version is also available: https://public.flourish.studio/visualisation/17490375/. Created with flourish.studio (https://flourish.studio).
Overall, DRPs were reported with a prevalence range of 32 to 948 per 100 patients or medication reviews (72, 78, 87, 88, 96, 103, 105, 110, 123) and 63 to 87 per 1000 patient-days (123).
The highest prevalence rates of MEs were reported by Bord et al. (79) with 2636 PEs and Grasso et al. (118) with 7032 MEs per 100 patients, respectively. Furthermore, a high prevalence of 948 DRPs per 100 patients was reported by Heck et al. (96). As MEs, including PEs, and DRPs comprise different subtypes of DRPs, it is evident that the reported prevalence rates were higher than for specific DRP subtypes. The median prevalence rate per 100 patients, calculated from the included studies without weighing in different sample sizes and methodological differences, was highest for PEs (191 per 100 patients) with a range of 15-2636 per 100 patients (4, 79, 86, 114, 118, 131), followed by DRPs (170.5 per 100 patients) (72, 87, 88, 96, 103, 110, 123, 130) with a range of 32-948 DRPs per 100 patients or medication reviews (72, 78, 87, 88, 96, 103, 105, 110, 123).
PEs were identified in 3.8% (69) to 30% (79) of prescriptions (37.5-300 per 1000 opportunities for error) and on 0.06 (57) to 165 (118) of 1000 patient-days (4, 13, 57, 69, 75, 79, 118, 131). Missing dosage forms were identified as a subtype of PEs with a wide range of 0.8% of newly written or omitted items (69) to 89.4% of prescriptions (63) and on 56 of 1000 patient-days (118). While some hospitals used paper charts for drug prescriptions, others have implemented computerized physician order entry (CPOE) systems with or without integrated clinical decision support systems (CDSS) which allow physicians to prescribe on digital medication charts (136). CDSS generate automatic alerts to warn prescribers of possible hazards resulting from the prescribed medication, such as DDIs (136). CPOE-operating errors were identified as the cause of PEs in 7.4% of patients (114). The highest prevalence rate of inappropriate prescriptions, which were considered as PEs for simplification, were reported by Bord et al. (79). They included both formal and content-related problems such as DDIs and dosage problems. However, no prevalence rates per 100 patients could be calculated for the PE subcategories using the reported data. Therefore, only the overall prevalence of 2636 inappropriate prescriptions per 100 patients was included in the data synthesis in Figure 5.
Of note, the median prevalence rate of MEs (5.7 per 100 patients) (4, 13, 78, 107, 118) was lower than of multiple DRP subtypes, which can be explained by the wide range of ME prevalence rates reported in the included studies of 0.3 and 0.5 identified through incident reports (78) to 7032 per 100 patients identified by chart review and prospective self-reports of dispensing errors (118) or 0.8 to 1515 per 1000 patient-days (13, 57, 78, 93, 102, 118) or 0.4 to 174.7 per 1000 opportunities for error (4, 78, 104). The highest prevalence rates were identified through direct observation (4).
Regarding clinical implications of MEs, Rothschild et al. (13) reported a serious ME rate of 6.3 per 1000 patient-days and 7.7 per 100 patients.
3.3.1 What are the most frequent DRPs and DRP subtypes in adult psychiatric inpatients?Among the DRP subtypes, potential clinically relevant DDIs were reported with the highest median prevalence rate of 76.5 per 100 patients (13, 54, 56, 59, 63, 72, 76, 77, 81–83, 86, 88, 90, 91, 94, 96, 97, 101, 103, 105, 108, 110–112, 116, 117, 123, 128, 130, 131, 134) with a wide range of 2.2 (13) to 1403 per 100 patients (63), 1.8 to 3.6 per 1000 patient-days (13, 123) and 88 (131) to 1500 (63) per 1000 prescriptions.
Jabeen et al. (82) reported the prevalence of different drug interactions, including DDIs (72 per 100 patients), drug-food interactions (68 per 100 patients), drug-alcohol interactions (136 per 100 patients), and drug-tobacco interactions (28 per 100 patients) with an overall prevalence rate of 304 per 100 patients (82).
Other studies focused on potentially clinically relevant pharmacokinetic DDIs (pkDDIs) involving CYP-450-metabolism in regular prescriptions (CYP3A4: 27.2-36.1% of patients (54, 83), CYP2D6: 9.3-34.7% of patients (54, 83), CYP2C19: 6.5% of patients (54), CYP1A2: 3.2% of patients (54), CYP2C9: 2.3% of patients (54)) or in drugs prescribed to be taken as needed (CYP2D6: 25% of patients (101), CYP3A4: 11% of patients (101)).
DDIs of drugs with the potential to lead to prolongation of the patients’ QT-interval (QT-DDIs) were assessed in three studies with reported prevalence rates of 19.1 to 116 per 100 patients (59, 97, 117). Javelot et al. (76) analyzed hazardous or contraindicated DDIs in elderly and non-elderly psychiatric inpatients and reported that involvement of polypharmacy with a QT-prolonging antipsychotic was significantly higher in non-elderly patients, accounting for 65.4% (9.5 per 100 patients) of hazardous DDIs in non-elderly patients and 23% (3.9 per 100 patients) of hazardous DDIs in elderly patients (p=0.002) (76). ADRs caused by QT-DDIs are reported below in the paragraph on ADR prevalence rates.
Furthermore, DDIs with antidepressants were identified in 27% of patients (111), drug-disease interactions were found in 15 to 36.1% of patients (86, 96, 131) and 3.2% of prescriptions (131), and drug-genotype interactions were reported for 20% of patients (56).
The second highest median prevalence rate with 43 per 100 patients (86, 87, 96, 103, 105, 123, 130) with a range of 10 (130) to 123 per 100 patients (96) concerned drug selection, including e.g. omission of potentially useful drugs (1.1 to 22.6 per 100 patients, 0.1-6.0 per 1000 patient-days (123)), disregard of drug allergies (3 per 100 medication reviews (103)), missing indications (10.2 to 50 per 100 patients (79, 96, 123), 0.7-4.5 per 1000 patient-days (123), 45 per 1000 prescriptions (131)), disregard of contraindications (0.5 to 7.8 per 100 patients (79, 96)), and inappropriate choice of drugs according to guidelines (2.2 to 46.9 per 100 patients (63, 103)).
The third highest median prevalence rate with 30 per 100 patients (13, 72, 86, 87, 96, 103, 105, 123, 130, 131) with a range of 1 (72) to 88 per 100 patients (130) was reported for dose selection problems. On one hand, dosages were too low with a prevalence rate of 4 to 26.5 per 100 patients (105, 123), 1.6% of prescriptions per patient (79) or 1.7 to 5.9 per 1000 patient-days (123). On the other hand, dosages were too high in 6.4 to 27% of patients (86, 105, 123, 131), 3.7% of prescriptions (131), 14.7% of prescriptions per patient (79) or 1.5-1.7 per 1000 patient-days (123). Studies correlating TDM results with specific DRP subtypes are summarized separately below.
Dose selection was inadequate due to renal or hepatic insufficiency in 31.3% of all patients and in 10.2% of prescriptions on a gerontopsychiatric ward (63). Furthermore, inadequate dosing frequencies were present in 4.4 to 25 of 100 patients (123), 2.9% of prescriptions per patient (79) or 6.7 times per 1000 patient-days (123).
Similarly, a median prevalence rate of 26.5 per 100 patients (13, 53, 80, 85, 93, 96, 118, 132) and a range of 0.1 (132) to 1439 (118) was identified for administration problems (0.8-997 per 1000 patient-days (13, 57, 93, 102, 118), 33-418 per 1000 opportunities for error (4, 80, 85, 124)). Among the reported subtypes of administration errors, 0.8 to 10.2% of patients (85, 93) got or took drugs at the wrong times on 0.2 to 8.4 of 1000 patient-days (57, 93, 102) or in 2.9 per 1000 opportunities for error (85). Drugs were under-used or under-administered in 1.8 to 10.3% of patients (13, 80, 85, 93) on 0.1 to 13.4 of 1000 patient-days (13, 57, 93, 102) or in 12.5 per 1000 opportunities for error (85). The wrong dose was administered to 1.4 to 1.8% of patients (85, 93) on 0.1 to 1.8 of 1000 patient-days (93, 102) and in 6.0 per 1000 opportunities for error (85).
The wrong drug was administered to at least 0.7 to 0.8% of patients (85, 93) on 0.1 to 0.9 of 1000 patient-days (57, 93, 102) and in 2.6 per 1000 opportunities for error (85), as identified by incident reports. Lastly, drugs were identified as administered to the wrong patient in 0.06% (through direct observation) (85) to 0.17% (through incident reports) of patients (85, 132) on 0.1 out of 1000 patient-days through incident reports (57) and in 0.2 per 1000 opportunities for error through direct observation (85).
Stubbs et al. (53) and Haw et al. (80) studied unauthorized dose form modifications (crushed/opened oral solid doses) and identified problems in 7.8 to 11.2% of solid oral drugs (53, 80), in 44.0% of crushed/opened solid doses (53) and 3.7 times per patient (53). Oral solid drugs were crushed or opened contrary to manufacturer’s advice in 4.5% (53).
Dispensing problems were identified with a prevalence of 0.04 to 10 per 1000 patient-days (57, 102, 118) and, depending on the detection method, in 27.8 per 1000 opportunities for error through direct observation of nurses and in 134.3 per 1000 opportunities for error through control of drugs dispensed by nurses (4).
A median prevalence rate of 26 per 100 patients (4, 13, 55, 60, 65,
留言 (0)