
記住我


This cross-sectional SNA study aimed to examine D&I advice networks in the US and Canada. Study participants completed an online survey using Qualtrics between April 2023 and July 2023. Throughout all study procedures, the terms dissemination, implementation, and knowledge translation/knowledge mobilization were used and defined due to the different terminology used in the US and Canada [21, 22]. For this paper, we use the term D&I for simplicity. This study adhered to the Social Networks in Health Research reporting guidelines [23]. The Institutional Review Board at Washington University in St. Louis approved this study as exempt research.
Sampling approach and network boundariesThe study sample was defined through a combination of publication metrics and a key person identified network. We sought to include individuals across career stages including trainees and established D&I researchers.
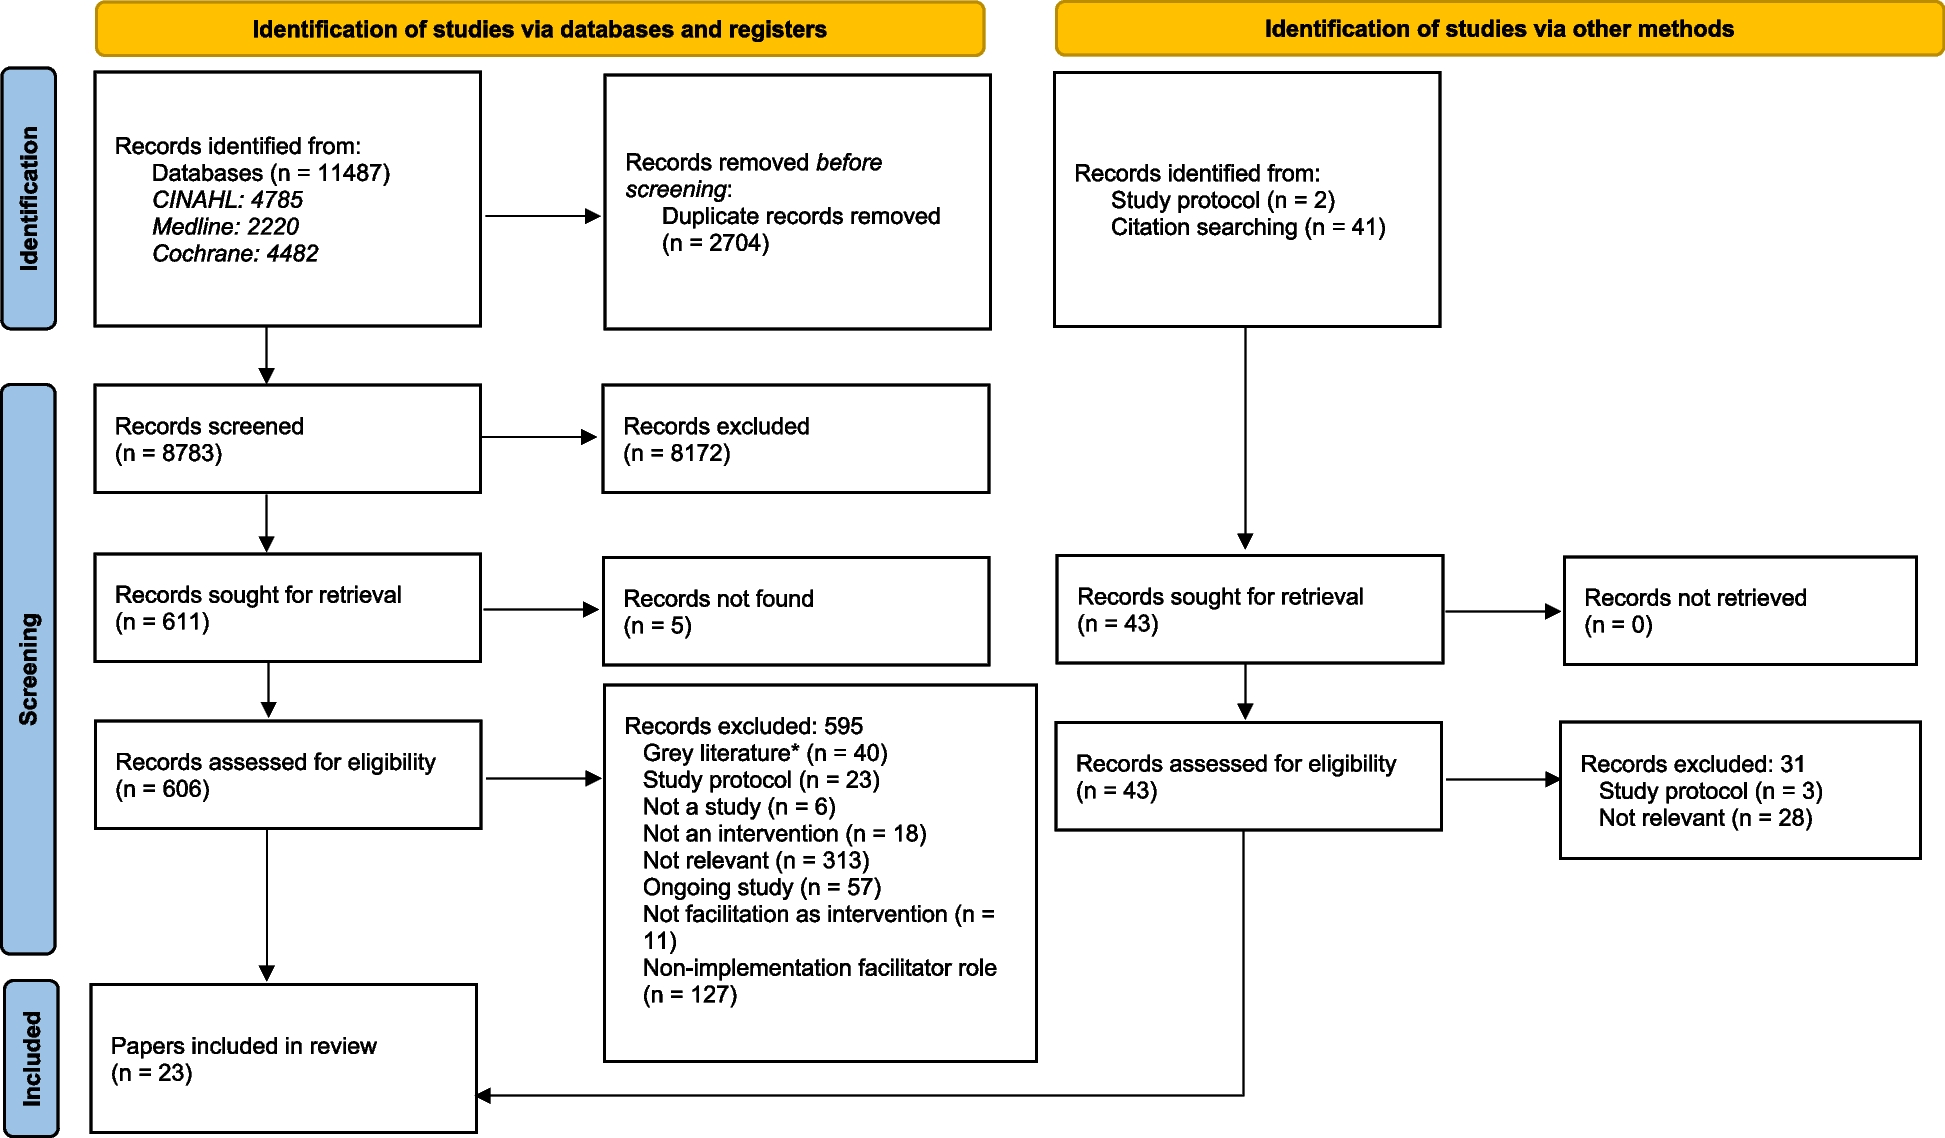
To identify the sample of individuals engaged in D&I research we started with individuals who published in one or more of five core D&I journals between January 2018 through December 2022. We pulled the names of the first, last/senior, and/or corresponding authors on all publications, including those with affiliations in the US or Canada. We considered these individuals as the primary contributors to the work and most likely to be engaged in D&I research. We chose not to include all authors because this may have artificially inflated the sample. Core D&I journals included: Implementation Science, Implementation Science Communications, Frontiers in Health Services- Implementation Science section, Global Implementation Research and Application, and Implementation Research and Practice. We added Journal of Clinical Epidemiology as it is a common dissemination channel for knowledge translation research in Canada. Keyword title searches using the terms dissemination, implementation, knowledge translation, and knowledge mobilization were used to identify potentially relevant articles/authors within the Journal of Clinical Epidemiology.
The team also identified core D&I faculty and trainees from US and Canada-based Universities from Huebschmann et al.’s (2022) work outlining implementation science capacity building programs [3]. We confirmed the sample included Editorial board members of core D&I journals and members of the main study section that reviews most D&I research applications at the National Institutes of Health [24]. To identify additional researchers in Canada, we searched the following sources: (1) the Canadian Institutes for Health Research trainee database (2) KT Canada Scientific Meeting abstracts and speakers (3) Canadian Association for Health Services and Policy Research Annual Meeting abstracts (4) Center for Implementation Research at Ottawa Hospital (5) University of Toronto Knowledge Translation program, and (6) University of Manitoba knowledge translation and synthesis services. The study lead (AL) and a D&I expert (RB) reviewed trainee scientific synopses and abstracts to assess involvement in D&I research. We limited trainee and abstract searches to 2018 through 2022. The study team reviewed the sample; they added seven individuals and removed 23.
Network operationalizationEach node, or circle on the network map, represents one individual in the network. Nodes are color-coded based on a participant characteristic (e.g., country, D&I expertise). The size of each node corresponds to the overall out-degree, or the number of individuals to whom somebody gave advice. A tie connects two nodes if one or both individuals reported giving advice to or receiving advice from the other; Fig. 1 presents a theoretical directed network. These ties are directed because they go to/from one node to another [25]. This study examines a whole, one-mode network [25] of individuals engaged in D&I research.
Fig. 1
Theoretical directed network. This theoretical network displays the bi-directional nature of data collection. Each circle, or node/individual, is labeled with a letter-#, where the number indicates the individual’s out-degree value. For example, A-2 indicates person A gave advice to two other individuals. All gray arrows indicate the node of origin reported giving advice to the end node (e.g., C reported giving advice to D). All red arrows indicate the end node reported receiving advice from the origin node (e.g., A reported receiving advice from H). Individuals received a tally for their out-degree when they reported giving advice to an individual and when an individual reported receiving advice from them, which is considered bi-directional data
Data collectionParticipants were emailed a personalized survey link and invited to complete a 10- to 15-min online survey using Qualtrics. The survey invitation was sent from a general D&I working group email via Qualtrics with the goal of not biasing respondents. Eligible individuals who did not respond to the survey were emailed up to four reminders one week apart, except for the final reminder, emailed two weeks after the previous reminder. Participants were offered a $20 USD electronic gift card after completing the survey.
Survey questions were informed by Norton et al.’s 2012 D&I network survey [19] and adapted based on team discussions about questions to prioritize based on how the field has evolved over the last 10 years. We further modified the survey based on feedback from researchers outside the research team with expertise in D&I research and SNA methods. Participants selected names from a pre-populated list of 1,576 individuals, which included the full list of individuals invited to complete the survey. Participants were asked to identify up to 10 people from whom they 1) received advice on D&I research issues and 2) gave advice on D&I research issues within the past two years. The question was limited to the past two years and selecting 10 individuals to support recall accuracy and to reduce respondent burden, particularly for individuals highly engaged in D&I advice networks. Participants had the option to type in the names of other individuals not included on the pre-populated list. For each individual selected, participants identified the type(s) of advice received including research methods (e.g., study design, theories/models/frameworks), grant funding (e.g., identifying funding agency or mechanism, drafting a specific aims page), career advice, or other types of advice. Participants were asked to select their top three reasons for seeking advice from the individuals they identified (e.g., trust, prior experience working together). Participant characteristics (e.g., involvement and experience with D&I research, current job position, race) were self-reported. For the full survey, see Additional file 1.
Missing dataNetwork data were managed and stored on a secure server and in R version 4.4.1 [26]. Due to the broad boundaries of the network, there was a large amount of missing data from survey non-respondents. These data are included in network analyses because they are considered network members. Individuals who did respond to the survey could still endorse an advice-seeking connection with non-respondents, but bi-directional data were not collected when one individual did not respond. Due to the nature of the research question and large number of non-respondents, imputation was not feasible.
Data analysisDemographic characteristics were summarized using descriptive statistics. A new variable was created representing each individual’s D&I expertise level based on two survey questions: self-rated level of D&I experience (beginner, intermediate, advanced) and number of years engaged in D&I research (< 2 to > 15). After combining these two variables, D&I expertise level was divided into four categories: beginner, intermediate, advanced, and expert (Table 2). Participants had the option to select ‘other’ when reporting demographic characteristics.
Table 2 Categorization of D&I expertise levelWhen respondents typed in names not included on the pre-populated list, our team reviewed these responses to assess if the names were included in the original list. When a write-in response was a duplicate of an individual already in the network, these responses were merged with the original sample. Based on write-it responses, we added two individuals to the network. More than ten respondents wrote in the names of these individuals.
Connectedness Based on D&I expertise and demographic characteristicsTo describe the network, or to what extent D&I researchers are connected, we explored visualizations (graphs) and common network metrics to describe each of the five networks (any advice, research methods, grant funding, career, and other advice). Metrics calculated included the number of connected actors or nodes, total number of ties or advice given/received, number of isolates or actors without any ties, density, largest component size, average geodesic distance, average degree, and each network’s transitivity or clustering coefficient. These metrics are further defined in the results section. To understand if some groups of researchers differ in the number of advice connections, we examined the average out-degree (number of nodes that were provided advice from one node) for each group (country, expertise, gender, and race) and each of the 5 advice networks with Kruskal–Wallis rank sum tests. We explored the tendency for researchers to connect or form ties with other researchers who share similar characteristics (country, expertise, gender, or race) calculating assortment coefficients and the proportion of within group ties shared [27, 28]. Our goal was to analyze a complete network.
Reasons people seek adviceTo understand what factors contribute to advice-seeking, we examined differences between participant characteristic (experience level, gender, race) by advice reason type with chi-square tests.
Prominent individuals in the D&I advice networkWe used out-degree calculations to identify prominent individuals in the D&I advice network. Each individual’s out-degree score was ranked, with those having the highest out-degrees (giving advice to more contacts) ranked for the US and Canada, and for researchers with beginner or intermediate D&I expertise level. All data were cleaned, analyzed and visualized in R version 4.4.1 using the tidyverse, arsenal 3.6.3, igraph 2.0.3, and assortnet packages [26, 29,30,31,32].
留言 (0)