Kidney transplantation is the best treatment for kidney function in patients with advanced chronic kidney disease or end-stage kidney disease (ESKD) (1, 2). Transplantation significantly reduces overall mortality and improves the quality of life for patients with renal disease (3, 4). However, kidney transplantation is a complex procedure that relies on several pivotal immunological and non-immunological factors that directly affect the graft’s survival and functionality (5, 6).
Antibody-mediated rejection is undoubtedly the most important factor that adversely affects the survival of the transplanted kidney in the medium and long term (7, 8).
Antibody-mediated rejection (ABMR) constitutes organ injury triggered by circulating donor-specific antibodies (DSA), which can target either human leukocyte antigens (HLAs) or non-HLA antigens (9). Identifying ABMR typically involves assessing the levels of DSAs and performing a kidney biopsy that reveals features such as microvascular inflammation (MVI) and C4d deposition in the endothelium (10–12).
While the compatibility of HLA molecules between donor and recipient has historically been the main focus in kidney transplantation, recent studies suggest that incompatibilities at other loci, such as MICA (major histocompatibility complex class I-related chain A) and KIR genes and NKG2D (natural killer group 2 member D) (KLRK), can influence graft outcome (13–17).
MICA acts as a ligand for NKG2D, an activating receptor expressed on NK cells, NKT cells, γδ T cells, and CD8+ αβ T cells (1, 18, 19). The binding of MICA ligands to NKG2D activates NK cells, enhances their functions, and allows them to function as a bridge between innate and adaptive immunity (20).
The pathogenic role of MICA-specific antibodies in kidney transplantation remains controversial. However, recent studies indicate that patients with MICA mismatches exhibit notably diminished graft survival compared to those with MICA-matched donors, with respective five-year graft survival rates of 88% and 96% (15). Additionally, genetic variability of NKG2D also may influence the receptor’s functional capacity, with at least two haploblocks identified to affect receptor expression activity levels (21).
This study aims to 1) evaluate the impact of MICA polymorphisms on kidney transplantation, focusing on the incidence of antibody-mediated rejection and graft function survival in the Sardinian population 2) Investigate how NKG2D polymorphisms in combination with MICA compatibility may influence immunological activity and assess their immunological significance relative to the classic HLA system.
2 Materials and methods2.1 Study populationFrom July 2012 to July 2022, 524 patients underwent kidney transplantation at the Organ Transplantation Center of the G. Brotzu Hospital in Cagliari, Italy. We excluded 1) cases lacking patient/donor biological material or incomplete clinical data. 2) patients who underwent a second transplant or had pre-transplant donor-specific HLA antibodies (pre-Tx DSA) (Figure 1).
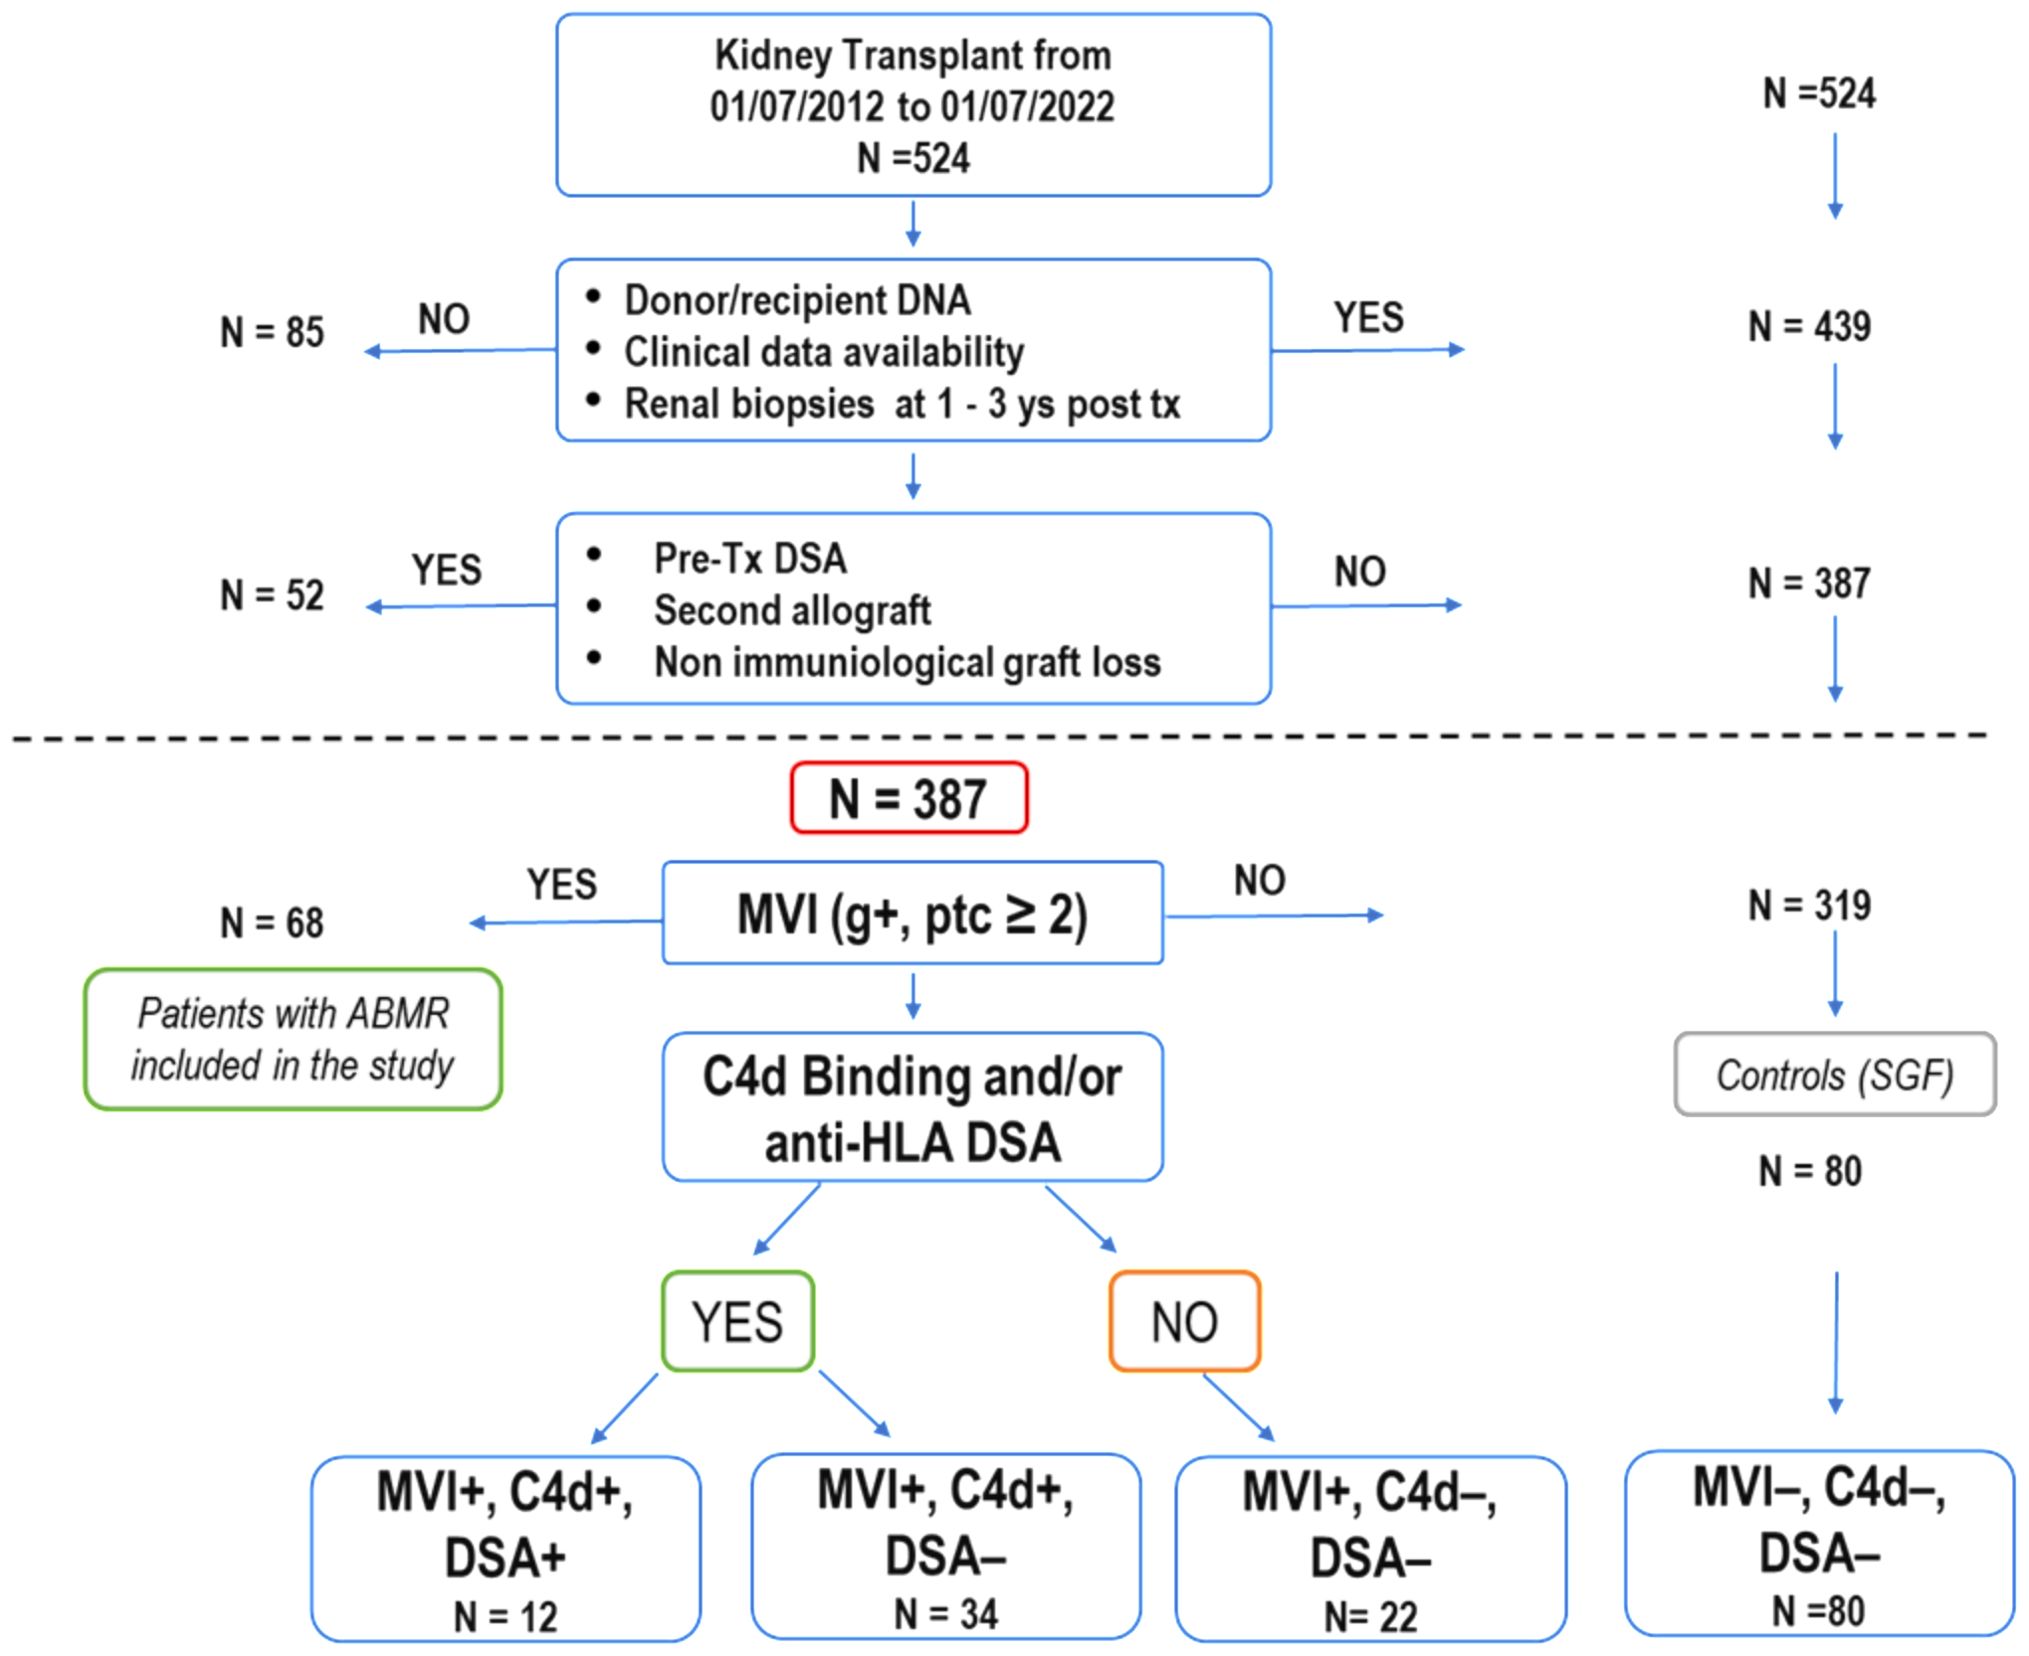
Figure 1. Selection process and characteristics of kidney transplant recipients in the study. Out of 524 patients who underwent kidney transplants over ten years, 387 were enrolled for analysis based on specific criteria, including renal biopsies at 1 and 3 years after transplantation (as required for post-transplant follow-up by the Cagliari transplant center), absence of second transplant and pre-transplant donor-specific HLA antibodies. Among these, 68 patients (21.3%) experienced a progressive decline in graft function attributed to antibody-mediated rejection (ABMR), with histological confirmation through renal biopsies. Some of these patients showed a mixed histological picture of ABMR and TCMR. The 68 patients with ABMR presented with a histological picture of MVI+ (g+, ptc ≥ 2). They were divided into three subgroups based on the presence or absence of C4d and the presence or absence of DSA (MVI+, C4d+, DSA+;MVI+, C4d+, DSA-; MVI+, C4d-, DSA-). The remaining 319 patients never exhibited clinical, histological, or laboratory signs of organ damage. Eighty patients (MVI-, C4d-, DSA-), randomly selected, were used as a control group (SGF). (ABMR, antibody-mediated rejection; DSA, donor-specific HLA antibodies; MVI, microvascular inflammation; TCMR, T-cell-mediated rejection).
Of the remaining 387 eligible patients, 68 manifested ABMR while 319 showed normal renal function. Out of these 319, 80 patients were randomly selected to be used as the stable graft function (SGF) control group.
Moreover, the total number of SGF and ABMR patients (148) was compared with a healthy cohort of 146 individuals of Sardinian descent and underwent a systematic evaluation of clinical and immunological parameters significantly impacting transplantation outcomes. These parameters included HLA class I (0-2 HLA-A, 0-2 HLA-B, 0-2 HLA-C) mismatches (score 0-6), HLA class II (0-4 HLA-DRB1, HLA-DQB1) mismatches (score 0-4), recipient NKG2D (KLRK1) polymorphisms rs1049174 and rs2255336, MICA mismatches (score 0-2). The analysis of MICA alleles matching was performed considering two categories of mismatches: i) mismatches in the host-versus-graft (HvG) direction where the donor but not the recipient is mismatched, and ii) all types of mismatches, independent of their directions. Additional factors examined included panel-reactive antibodies (PRA) exceeding 5-10%, the duration of graft cold ischemia, the type of induction therapy received, and the immunotherapy administered post-transplant.
2.2 Allograft pathologyKidney biopsies were performed when clinically justified due to suspected graft dysfunction, such as unexplained changes in graft function, new-onset proteinuria, rising serum creatinine, or other deviations from the standard post-transplantation course. These biopsies were carried out to promptly detect and address any potential pathological alterations affecting graft function. Each specimen was assessed according to the standards from the 15th Banff Conference held in 2019 (22). All samples were reviewed by three independent renal pathologists. The analysis included H&E, PAS, AFOG, and silver stain, along with immunofluorescence for IgG, IgA, IgM, kappa, lambda, C3, C4, C1q, and albumin, and immunohistochemistry for C4d, with additional stains as required (e.g., SV40).
2.3 Donor-specific antibodyThe presence of anti-MICA and anti-HLA class I and II antibodies were determined in all pre-transplant patients. The presence of anti-HLA DSA precluded kidney transplantation at our center. Anti-HLA and MICA DSA levels: This assessment was conducted using LAB Screen Single Antigen kits from One Lambda, following the manufacturer’s instructions. Beads with a normalized MFI above 2500 for HLA or 1000 for MICA were considered positive as reported in other work (23). According to the transplant center’s operational standards, antibody testing was performed during the one-year post-transplant follow-up, or earlier if the patient showed clinical signs of rejection (renal injury/graft impairment) within the first year.
2.4 Genetic analysisHLA and MICA typing. Genomic DNA (gDNA) was isolated from peripheral blood using QIAcube (Qiagen, Hilden, NW, Germany) and the DNA Blood Mini kits according to the manufacturer’s instructions. Isolated gDNA was HLA genotyped using the AlloSeq Tx17 assay (Care Dx, Brisbane, CA) following the recommended protocol. The AlloSeq Tx17 assay incorporates 17 specific probes designed to target HLA-A, HLA-B, HLA-C, HLA-E, HLA-F, HLA-G, HLA-H, HLA-DRB1, HLA-DRB3, HLA-DRB4, HLA-DRB5, HLA-DQA1, HLA-DQB1, HLA-DPA1, HLA-DPB1, MICA, and MICB loci. Library quantification was performed using the Qubit™ dsDNA HS Assay (Life Technologies, Carlsbad, California, USA), and sequencing was performed on the Illumina MiSeq platform (San Diego, CA) with 2x150 sequencing. MICA allele matching/mismatching was analyzed based on the recipient-versus-graft direction, where the donor, but not the recipient, is mismatched. The codon position 129 of the MICA gene was considered to determine the presence of Methionine (Met) or Valine (Val) (rs1051792) and to evaluate recipient/donor MICA mismatches. Allele frequencies of MICA were calculated using direct gene counting.
2.4.1 NKG2D rs1049174 and rs2255336 sequencingPrimer sets targeting specific regions were designed with the assistance of Primer3 version 4.1.0 (24). The annealing temperature was optimized for each primer set. The two SNPs located within the NKG2D (KLRK1) gene rs1049174 and rs2255336 belong to two different haplotype blocks (NKG2D hb-1 and hb-2), each of which generates two major haplotypes associated with low (LNK) and high natural cytotoxic activity (HNK) phenotypes as shown in Table 1 (21). Several studies have demonstrated that high and low natural cytotoxic activity haplotype alleles (HNK1 or LNK1) belonging to NKG2D haplotype blocks 1 (hb-1) may be successfully predicted by only a single SNP (dbSNP: rs1049174) and haplotype blocks 2 (hb-2) by dbSNP rs2255336 (25, 26). Primers are reported in the Supplementary Table S1. The PCR was performed according to the protocol supplied with AmpliTaq Gold™ DNA Polymerase (Applied Biosystems/Thermo Fisher Scientific, Waltham, MA). Sequencing was performed using the BigDye™ Terminator v3.1 Cycle Sequencing Kit (Applied Biosystems, USA), with the same primers described previously and cleaned up with CleanSEQ Dye-Terminator Removal Kit (Beckman Coulter, Inc.). Capillary electrophoresis was performed on the ABI 3500 Genetic Analyser (Applied Biosystems), and sequences were analyzed with Sequencher 5.3 (© 2017 Gene Codes Corporation).

Table 1. Haplotype blocks (NKG2D hb-1 and hb-2) are split into low and high natural cytotoxic activity haplotypes.
2.5 Statistical analysisSummary statistics were calculated for the clinical and biochemical data of patients diagnosed with or without antibody-mediated rejection: interquartile ranges (IQR), medians, means, standard deviations (SD), and mean differences were calculated on all continuous variables; percentages and odds ratios (OR) were calculated on categorical data. P values and 95% confidence intervals (95% CI) were obtained using Student’s t-test or Fisher’s exact test, as appropriate. Statistical analysis was performed by using R software version 4.3.2 (27). The frequencies of rs1049174 G>C and rs2255336 A>G SNPs in the NKG2D gene and MICA alleles were compared between patients with ABMR, stable graft function (SGF), and an appropriate group of Sardinian healthy controls. The Hardy-Weinberg Equilibrium (HWE) of the SNPs and allele frequencies was examined by computing X2HWE and P values. Deviation from HWE was assessed using HaploView 4.2 software (28). The linkage disequilibrium (LD) between the rs1049174 G/C and rs2255336 A/G haplotypes of the NKG2D gene was evaluated in transplanted patients and healthy group controls. The observed and expected frequencies in each sample were compared using the chi-square test. LD was measured by the parameters D (difference between the observed and expected frequencies) and D′ (i.e., D normalized to one: -1 ≤ D′ ≤ 1). D′ was obtained using the normalization formulas proposed by Lewontin (29) for two-loci haplotypes. We also computed the parameter r2 expressing the correlation between the alleles at two loci. To compare the LD in the control and patient groups or the SGF and ABMR cohorts, we evaluated the P value associated with the chi-square variable (with two degrees of freedom) given by the difference between the chi-square variables in the two groups (with one degree of freedom). Kaplan-Meier curves were used to illustrate the cumulative incidence of antibody-mediated rejection from the date of transplantation to the date of clinical, histopathological, and immunohistochemical detection or the date of the last follow-up or death with a functioning graft. Transplant recipients were stratified into several groups according to genotypes and allele mismatches. The log-rank test was used for comparisons of the different gene profile combinations. Serum creatinine levels and glomerular filtration rate were measured at 1, 6, 12, 36, and 72 months from the date of transplantation. Comparison between groups of stratified patients was performed by computing the area under the curve (AUC) for the corresponding plots (30). AUC was evaluated using the trapezium formula extended to include all times at which serum creatinine and glomerular filtration rate (eGFR) were measured. The Student’s t-test was used to confirm statistical significance. A multivariate analysis was conducted to determine the independence from donor age and gender of the other clinical and genetic variables influencing rejection incidence and graft function. In the multivariate comparison between patients with SGF and ABMR, a logistic regression model was used to compute P values (PM), odds ratios (ORM), and 95% confidence intervals (95% CIM) adjusted accordingly to age and gender and for the potential confounder. The analysis included cold ischemia time, R/D MICA alleles full mismatch (MICA 2MM), allelic mismatches R/D HLA-DRB1, HLA-DQB1 (HLA II Class 1-2MM) and HLA class I (HLA-A, -B, -C > 3MM), genotypes NKG2D rs2255336 AA and NKG2D rs1049174 GG, de novo DSA HLA Class I and II, and the combination of MICA 2MM with the genotype NKG2D rs1049174 GG, which was confirmed to be strongly associated with rejection incidence. The de novo DSA HLA Class I observations in the two groups of patients were too few to yield fully reliable results for ORM and 95% CIM.
3 Results3.1 Patient selection algorithmBetween July 2012 and July 2022, 524 kidney transplant patients (KTPs) were treated at the Brotzu transplant center in Cagliari (Figure 1). Eighty-five patients (16.2%) were excluded due to insufficient patient/donor biological material or incomplete clinical data, including the lack of renal biopsy in the 1st and 3rd year of post-transplant follow-up. To accurately evaluate the immunological impact of allelic MICA mismatch and NKG2D genotype on long-term graft function, we further excluded 52 patients (9.9%) who underwent a second transplant or had pre-transplant donor-specific HLA antibodies (pre-tx DSA). Out of 387 patients enrolled in the study, 68 (17.6%) had clinically manifested a progressive decline in graft function attributed to antibody-mediated rejection (ABMR), characterized by MVI+ (Banff score: g+, ptc ≥ 2) as evidenced in all cases through renal biopsies. They were divided into three subgroups based on the presence or absence of C4d+ and the presence or absence of DSA (12 patients were MVI+, C4d+, DSA+; 34 were MVI+, C4d+, DSA-; and 22 were MVI+, C4d-, DSA-). The presence of calcineurin inhibitor toxicity, hypertensive damage, BK virus, and bacterial infections was ruled out. All patients were compliant with post-transplantation immunosuppressive therapy. Three hundred nineteen patients, who showed no clinical, histological, or laboratory signs of organ damage, were included in the control group (SGF), which consisted of 80 randomly selected patients (MVI-, C4d-, DSA-).
3.2 Clinical characteristics of transplanted patients and donorsThe age, sex, clinical, and demographic characteristics of recipient-donor pairs are detailed in Table 2. No significant differences were observed between the two groups of patients with SGF or ABMR in terms of the age and gender of the recipients. The number of HLA Class I (HLA-A, -B, -C) mismatches (0-6), HLA Class II (HLA-DRB1, HLA-DQB1) mismatches (0-4), and the percentage of sensitized patients (PRA > 5%) (31), showed no substantial differences between the SGF and ABMR groups. Significantly, the cold ischemia time in the ABMR patient group was notably more protracted than in the SGF group (747.5 ± 211.5 vs. 590.3 ± 22.9, OR = 157.2, 95% CI 74.0 – 590.3; P = 3.0 x 10⁻⁴).
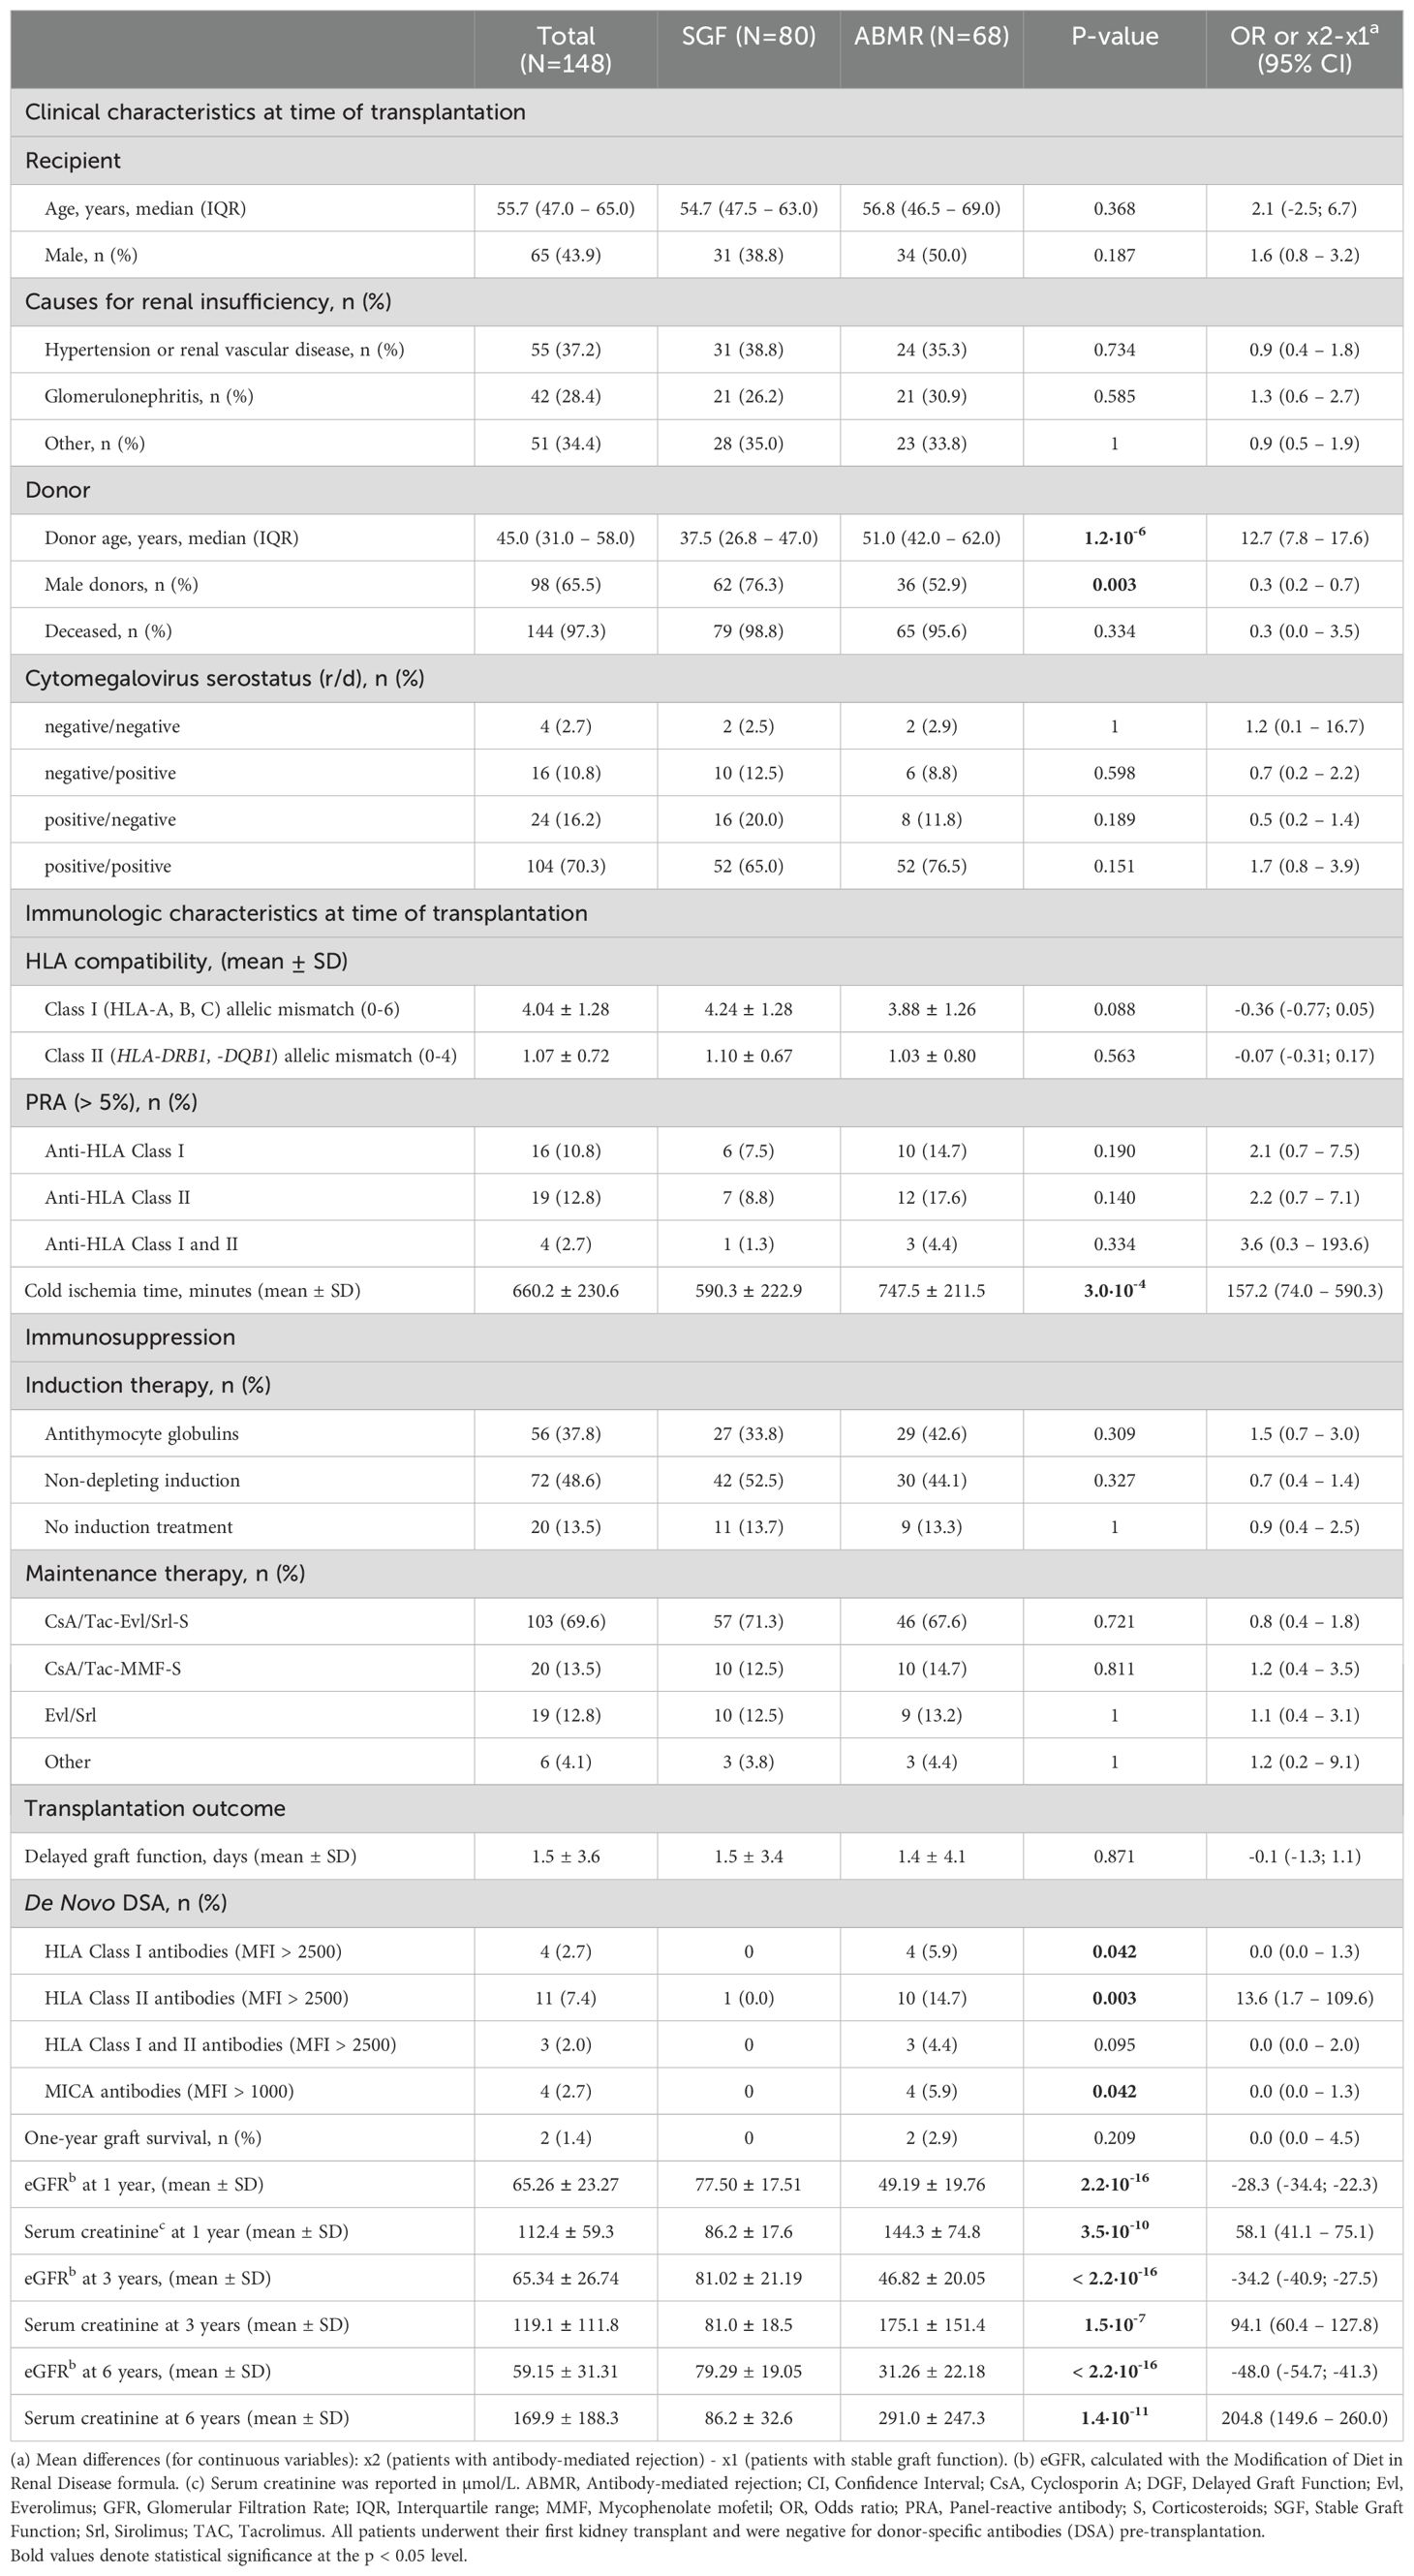
Table 2. Clinical and immunological characteristics of transplant patients.
After the transplant, only 1.3% (1/80) of patients with stable graft function (SGF) developed de novo donor-specific antibodies (DSAs) with a MFI above 2500 for HLA or 1000 for MICA, compared to 17.6% (12/68) of patients with antibody-mediated rejection (ABMR) (OR = 16.9, 95% CI 2.1–134.0; P = 0.001). Most of these DSAs were directed against HLA class II antigens.
Additionally, 17 out of 68 (25.0%) patients with ABMR had MICA DSA alloantibodies (Supplementary Table S3). However, most of these patients had a low MFI level (<1000). Only 4 of the ABMR patients developed MICA DSAs with a mean fluorescence intensity (MFI) > 1000 (ranging from 1100 to 4500). Three of these patients had anti-MICA alloantibodies against the donor MICA-129 Methionine antigen (MICA 18 and MICA 01), while one patient had antibodies against both MICA-129 Methionine and Valine antigens (MICA 01, 08). Overall, 5 out of 6 anti-MICA DSAs with an MFI level > 1000 targeted Methionine at residue 129 (Supplementary Table S3).
Considerable overlap in treatment regimens administered before and after transplantation was observed between the two groups (Table 2). It is noteworthy to observe that the maintenance regimen based on mTOR inhibitors was statistically significantly associated with a higher number of episodes of ABMR compared to therapeutic regimens consisting of CNI [55.8% (48/86) vs. 32.3% (20/62); P = 0.007; OR: 2.6 (1.3 – 5.6)].
3.3 MICA allele frequencies and recipient/donor MICA alleles matchingMICA alleles were compared in 148 KTPs and 146 healthy controls. The analysis revealed a few substantial differences in allele frequencies between patients and healthy controls (Table 3). The frequency of the MICA*002:01 was significantly lower in the kidney transplant patient group compared to the control group [16.9% (50/296) in KTPs vs. 24.0% (70/292) in controls; p-value: 0.040; OR: 0.65 (0.42 - 0.99)]. The other alleles did not exhibit substantial differences and had comparable frequencies between controls and patients.
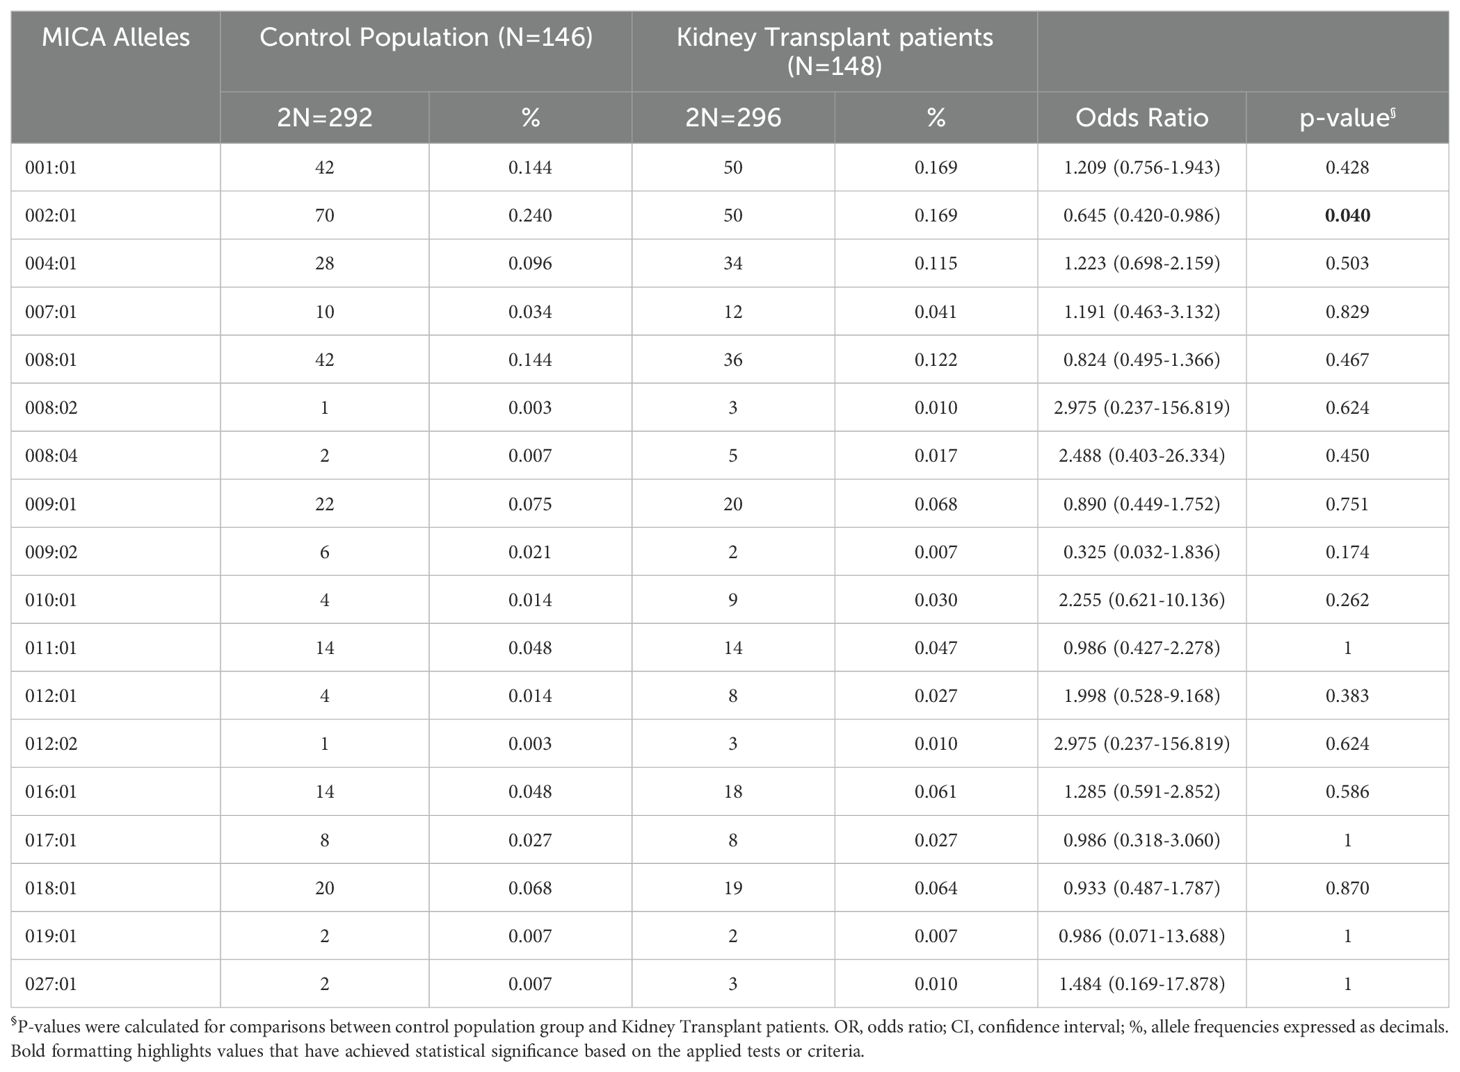
Table 3. MICA alleles their frequencies in the control population and kidney-transplant patients.
Furthermore, when dividing the patients based on transplant outcomes (ABMR or SGF), the most represented alleles in both groups were MICA*001:01 and MICA*002:01 (Table 4). The MICA*010:01 allele was more frequent in SGF patients [0.007% (1/136) in ABMR, 0.05% (8/160) in SGF; P = 0.042; OR: 7.105 (0.877-57.548)]. Furthermore, ABMR and SGF groups were compared based on each allele’s heterozygote and homozygote frequencies. In particular, no significant differences were observed in the frequencies of homozygotes and heterozygotes for the most frequent allele: MICA*001:01, *002:01, *004:01, *008:01, *009:01 and *010:01 (Table 4).

Table 4. MICA alleles their frequencies in the group of antibody-mediated rejection patients and patients with stable graft function.
Figure 2A shows the 95% cumulative incidence curves over 120 months for antibody-mediated rejection (ABMR) in 148 patients, stratified into three groups based on the number of MICA allele mismatches with their donors. Of these, 24 R/D pairs (16.2%) were matched (0 MM), 52 R/D pairs (35.1%) had one mismatch (1 MM), and 72 R/D pairs (48.7%) had two mismatches (2 MM). The median follow-up was 52.9 months for MICA-matched patients and 64.7 months for MICA-mismatched patients. At 5 years post-transplantation, graft survival was 79.2% (19/24) for MICA-matched patients and 64.5% (80/124) for MICA-mismatched patients (1 and 2 MM). Compared to MICA-mismatched patients, those matched for MICA alleles exhibited a significantly reduced risk of antibody-mediated rejection (X² = 6.95; Log-rank = 0.03). Indeed at 120 months post-transplantation, the incidence of ABMR was only 20.8% (5/24) in MICA-matched patients, compared to 49.1% (26/52) and 52.7% (38/72) in patients with 1 and 2 mismatches (1 MM and 2 MM), respectively.
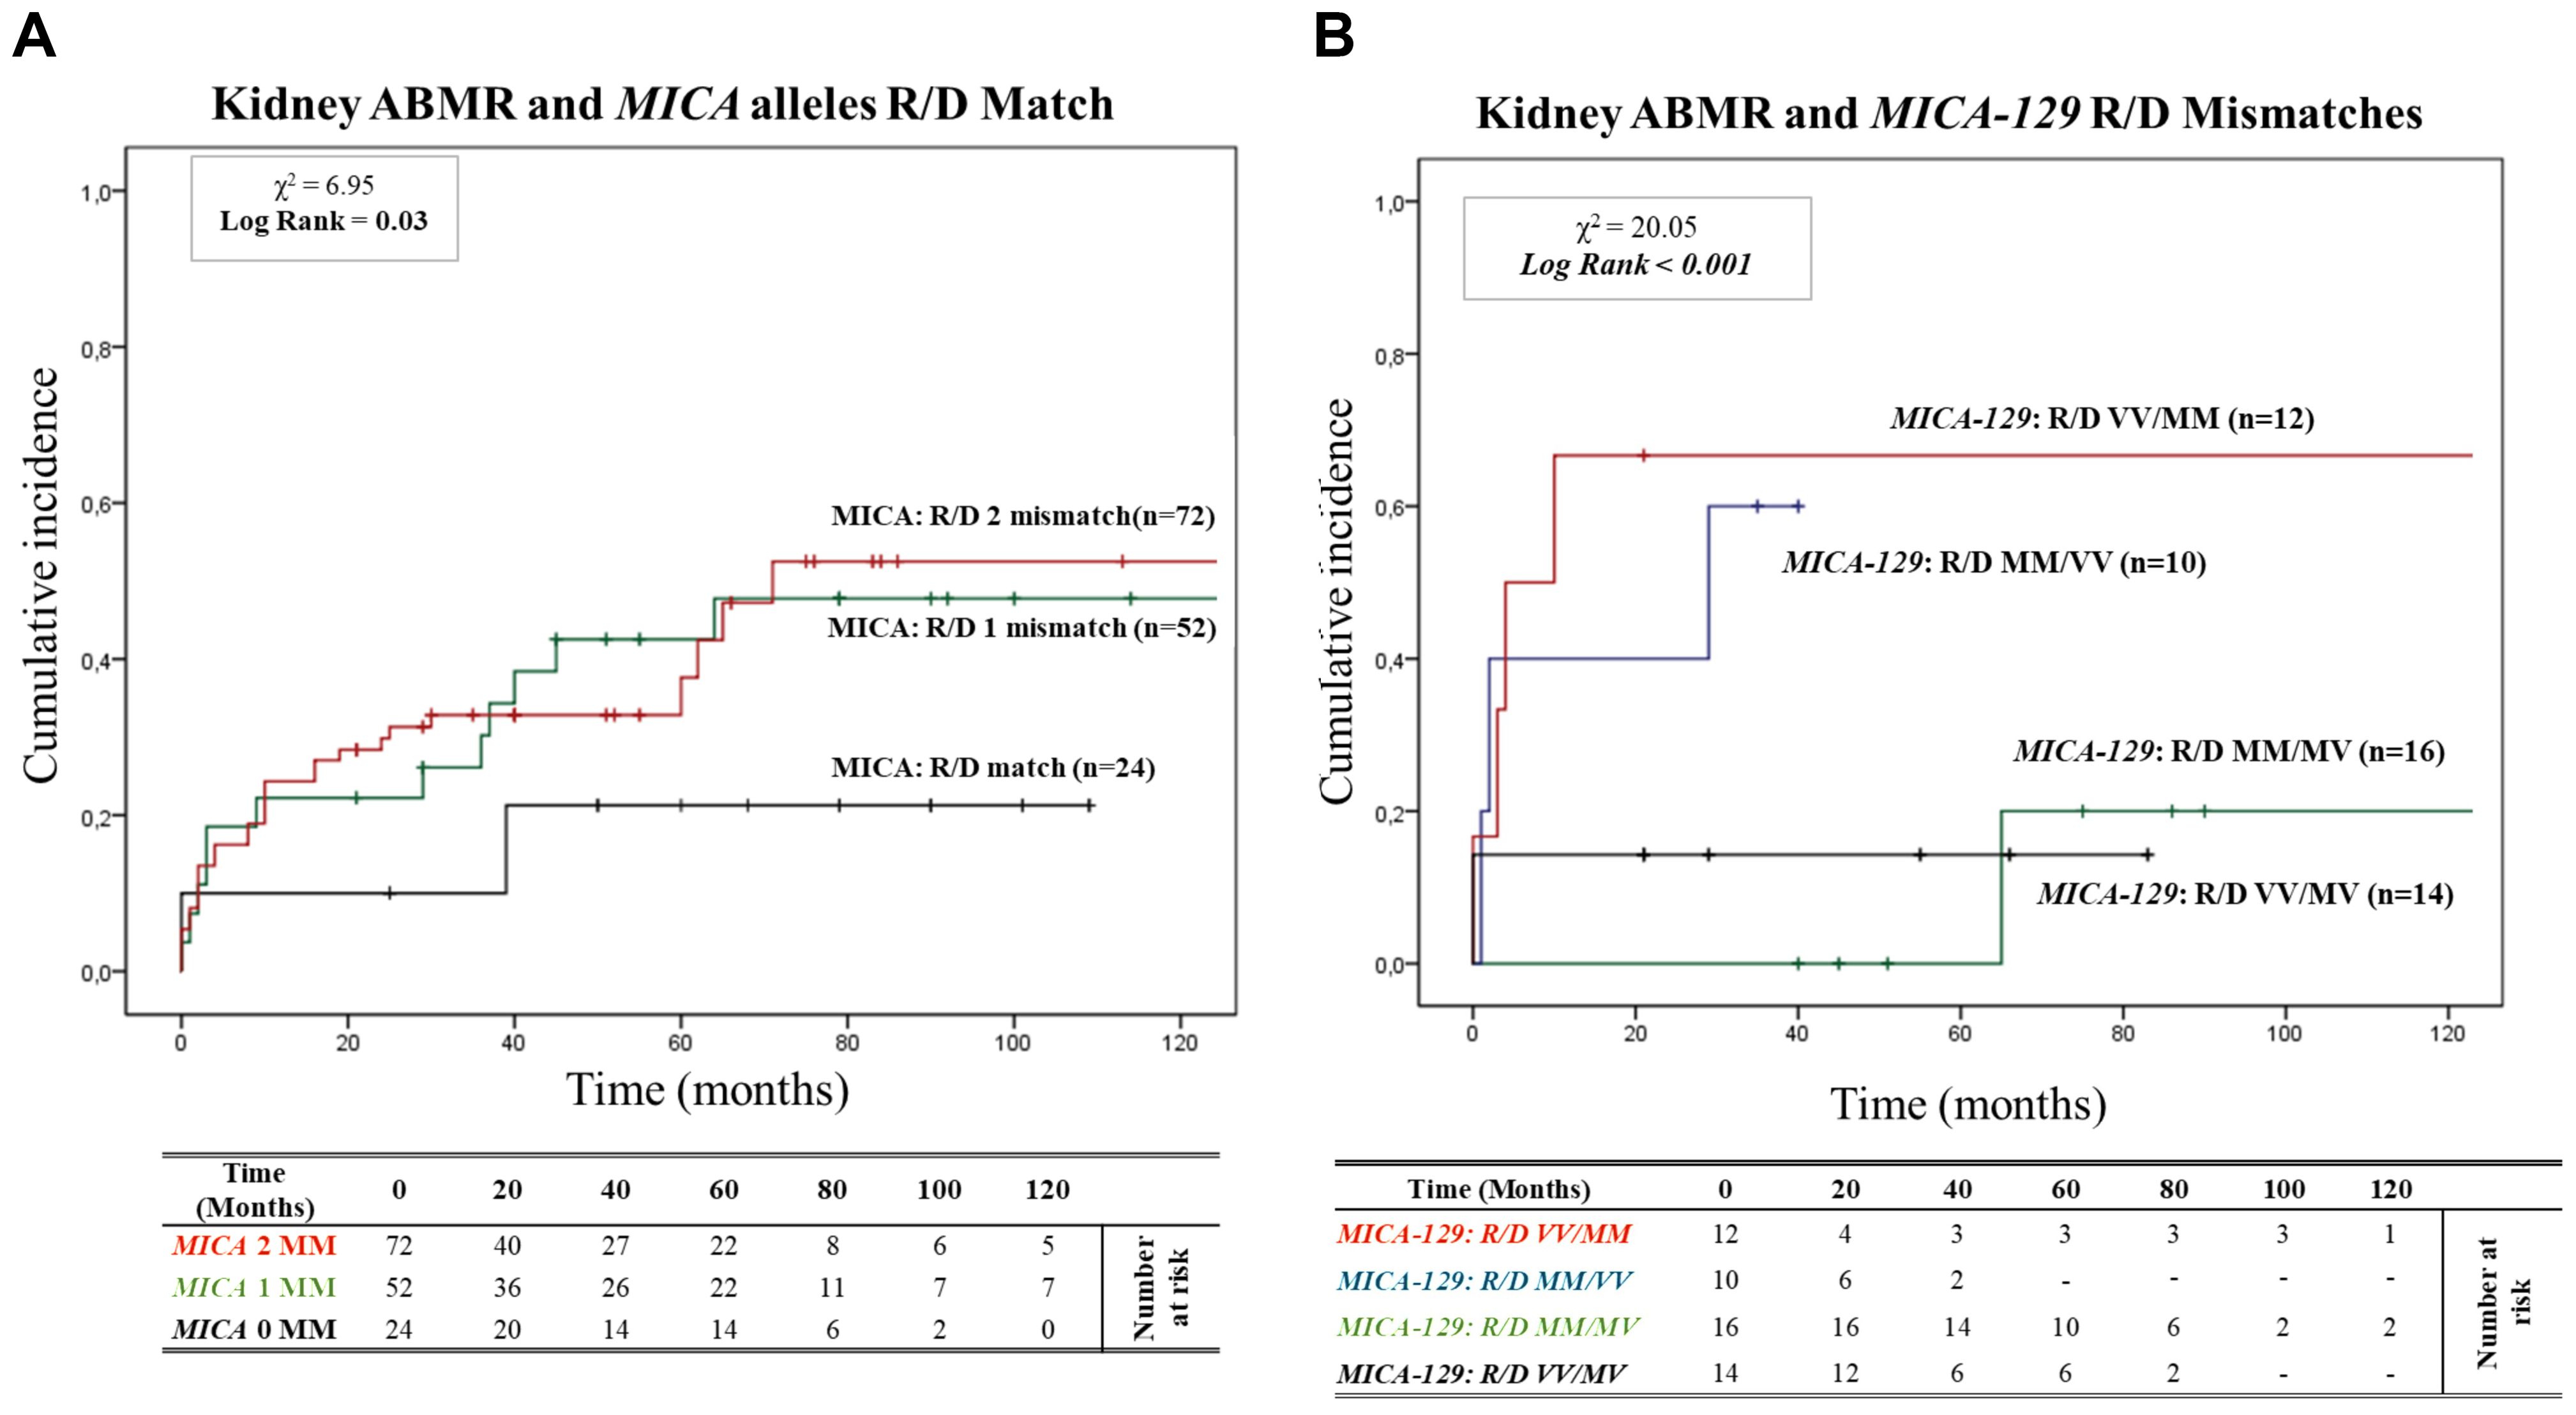
Figure 2. (A) Cumulative incidence for antibody-mediated rejection according to recipient-donor (R/D) MICA allele mismatches. The cumulative incidence of rejection events is graphically presented for a cohort of 148 patients observed over 120 months. Patients were categorized based on three groups of patients stratified according to donor-recipient MICA allele mismatches [0MM (black), 1MM (green), 2 MM (red)]. P-values were calculated using the two-sided Log-rank test without correction. χ2: Chi-square. MM: Mismatches. (B) Cumulative incidence for antibody-mediated rejection according to recipient-donor (R/D) MICA-129 allele mismatches. The cumulative incidence of rejection events is graphically presented for a cohort of 148 patients observed over 120 months. Patients were categorized on four groups of patients stratified according to recipient-donor MICA allele mismatches based on substitution of valine (V) with methionine (M) at position 129 (MICA-129) of the MICA protein: [R/D VV/MM (Red), R/D MM/VV (blue), R/D MM/MV (green) and R/D VV/MV (black)]. P-values were calculated using the two-sided Log-rank test without correction. χ2, Chi-square.
In addition to a detailed exploration of the consequences of the MICA mismatching model, we closely monitored renal function through assessments of serum creatinine levels and glomerular filtration rate (eGFR) (Supplementary Figures S2, S3). This additional analysis further confirmed the impact of recipient/donor (R/D) MICA allele matching on renal outcomes.
Building on this analysis, we further investigated the specific role of MICA-129 mismatches and their potential interactions with antibody-mediated rejection. We analyzed the cumulative incidence curves over 120 months for ABMR based on the R/D MICA-129 1 or 2 mismatches (1 MM and 2 MM) as R/D: MM/MV, VV/MV, MM/VV, VV/MM (Figure 2B). Two MICA-129 mismatches were observed in 12 R/D pairs VV/MM (8.1%) and 10 R/D pairs MM/VV (6.8%), while 1 MICA-129 mismatch was observed in 16 R/D pairs MM/MV (10.8%) and 14 R/D pairs VV/MV (9.5%).
The median follow-up was 27.9 months for MICA-129 2 mismatched patients (VV/MM and MM/VV) and 60.6 months for patients with 1 MICA-129 mismatch compared to the donor (VV/MV and MM/MV). Patients with 2 MICA-129 mismatches exhibited a significantly higher risk of antibody-mediated rejection (X² = 20.05; Log-rank < 0.001).
At 5 years post-transplantation, graft survival was 100% (16/16) for MICA-129 1 mismatch R/D MM/MV, and 85.7% (12/14) for MICA-129 1 mismatch R/D VV/MV, while in the presence of 2 MICA-129 mismatches, graft survival decreased to 40% (4/10) for R/D MM/VV pairs and to 33.3% (4/12) for R/D VV/MM pairs.
At 120 months post-transplantation, the cumulative incidence of ABMR remained significantly higher in the pairs that presented two MICA-129 mismatches, particularly in R/D VV/MM pairs [66.7% (8/12)].
3.4 Association of recipient RNKG2D rs1049174 (G>C) and rs2255336 (A>G) polymorphisms and antibody-mediated rejection risk3.4.1 RNKG2D rs1049174 (G>C) and rs2255336 (A>G) Hardy–Weinberg equilibrium and linkage disequilibrium analysisThe two index SNPs, rs1049174 (G>C) and rs2255336 (A>G), located in the RNKG2D gene, were analyzed in 146 healthy control individuals and 148 kidney transplant patients stratified into two groups: SGF and ABMR. The comparison did not reveal significant differences in the frequencies of these SNPs. (Tables 5A, B). The rs1049174 (G>C) variant was found to be in Hardy–Weinberg equilibrium (HWE) within the control group population and the Stable graft function (SGF) group [X2HWE = 0.1222; p = 0.726661 and X2HWE = 0.8765; p = 0.34916 respectively] (Tables 5A, B). Only patients with ABMR had frequencies deviating from HW expectations [X2HWE = 11.0717; p= 0.000877] (Table 5B). Consequently, the entire group of kidney transplant patients lost the HWE [X2HWE = 9.0317; p = 0.002653] (Table 5A). In contrast, rs2255336 (A>G) was in HWE within the control population group and kidney transplant patients [X2HWE = 1.828; p = 0.1763 and X2HWE = 0.0587; p = 0.8080 respectively] (Table 5A) and the due subgroup ABMR and SGF [X2HWE = 0.2369; p = 0.626 and X2HWE = 0.7405; p = 0.3895 respectively] as shown in detail in (Table 5B). Moreover, these two SNPs in the NKG2D gene, despite being a few thousand bases apart (21), do not show strong linkage disequilibrium in all examined groups (Supplementary Tables S2A–C).The only observed association pertains to the SNPs rs1049174G with rs2255336A, which exhibit weak LD in the patient group (D’= 0.70, r2 = 0.32; X2 = 14.87, P =0.0001) including the two subgroups SGF and CR (D’= 0.74, r2 = 0.41; X2 = 9.80, P =0.002 and D’= 0.66, r2 = 0.24; X2 = 4.59, P =0.032, respectively).
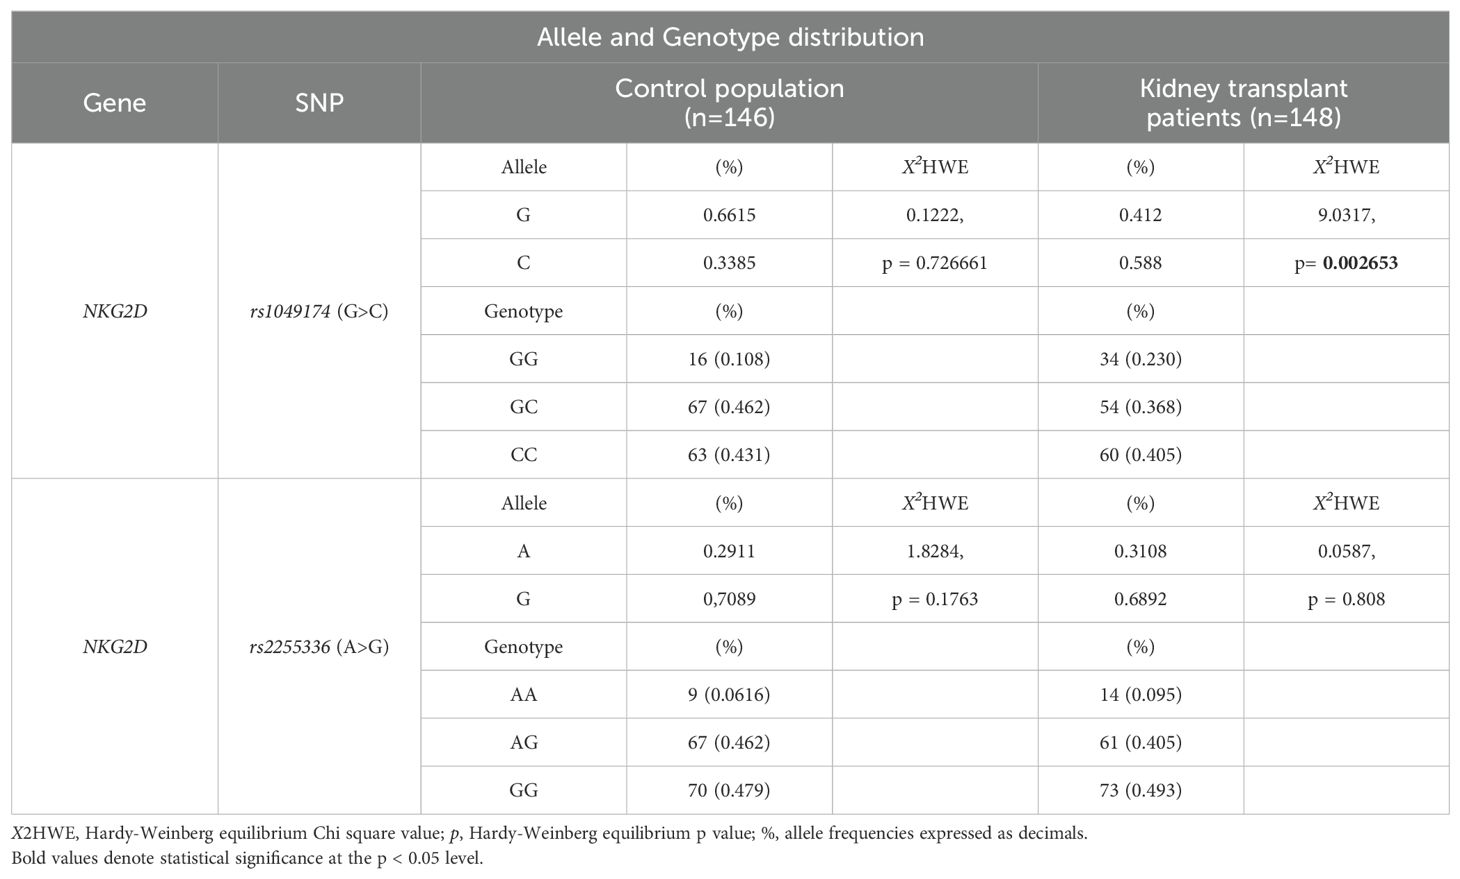
Table 5A. Allele and Genotype distribution of rs1049174 and rs2255336 in the control population and kidney-transplant patients.
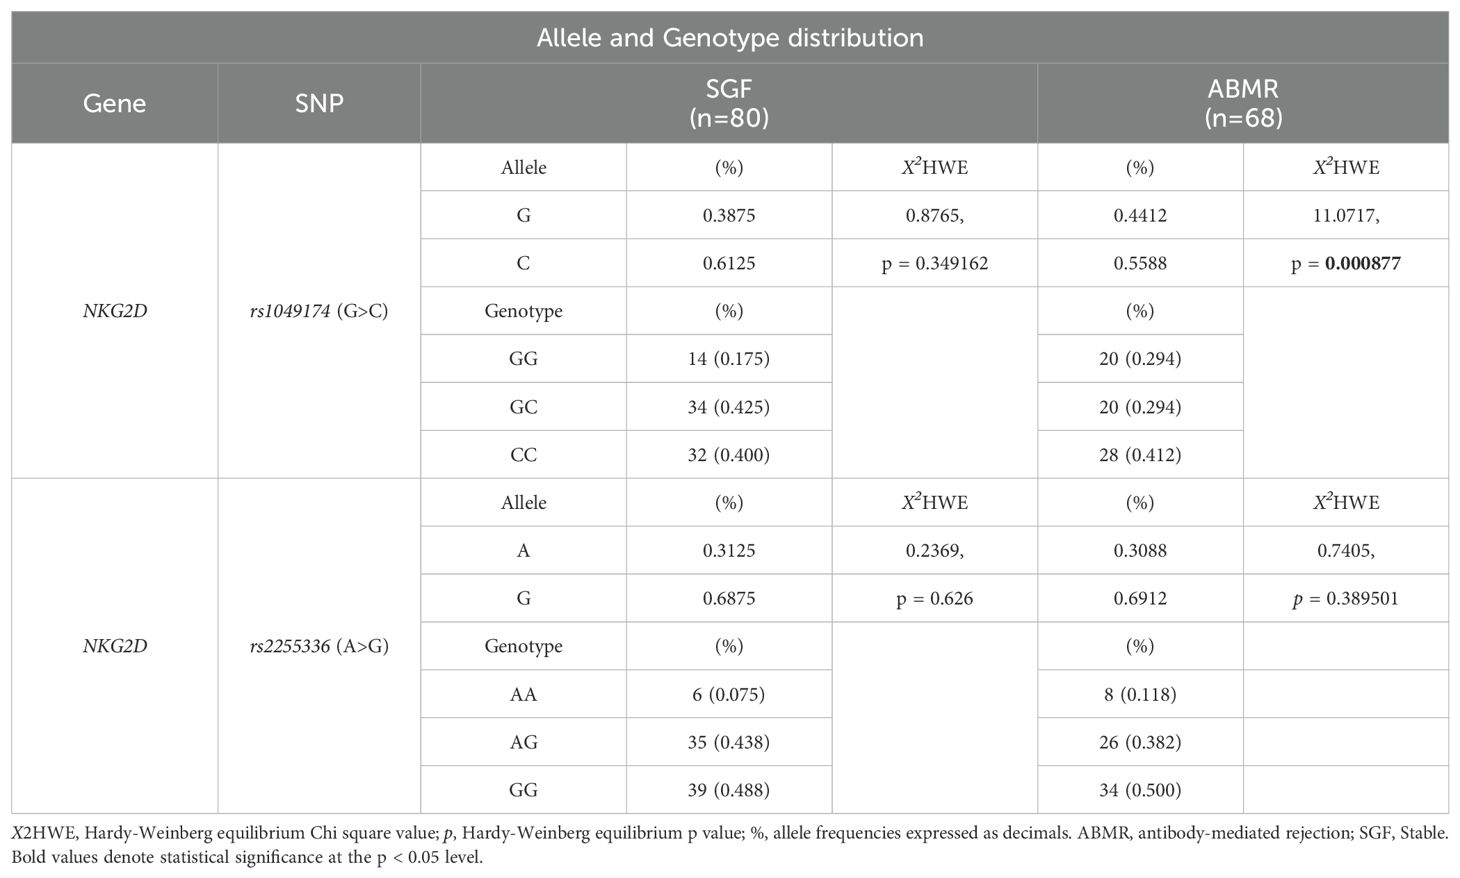
Table 5B. Allele and Genotype distribution of rs1049174 and rs2255336 in the kidney-transplant patients.
3.4.2 Association of RNKG2D rs1049174 (G>C) polymorphisms and antibody-mediated rejection riskFigure 3 depicts the cumulative incidence of ABMR over 120 months in patients categorized based on the three genotypes of rs1049174 (G>C) in the NKG2D gene (GG, CG, and CC). Thirty-four patients (23%) had the rs1049174 [GG] genotype, 54 (36.5%) were heterozygous [CG], and 60 (40.5%) were homozygous [CC]. At 5 years post-transplantation, graft survival was only 38.2% (13/34) for patients with the rs1049174 [GG] genotype, compared to 70.4% (38/54) and 91.7% (49/60) for patients with the rs1049174 [CG] and rs1049174 [CC] genotypes, respectively.
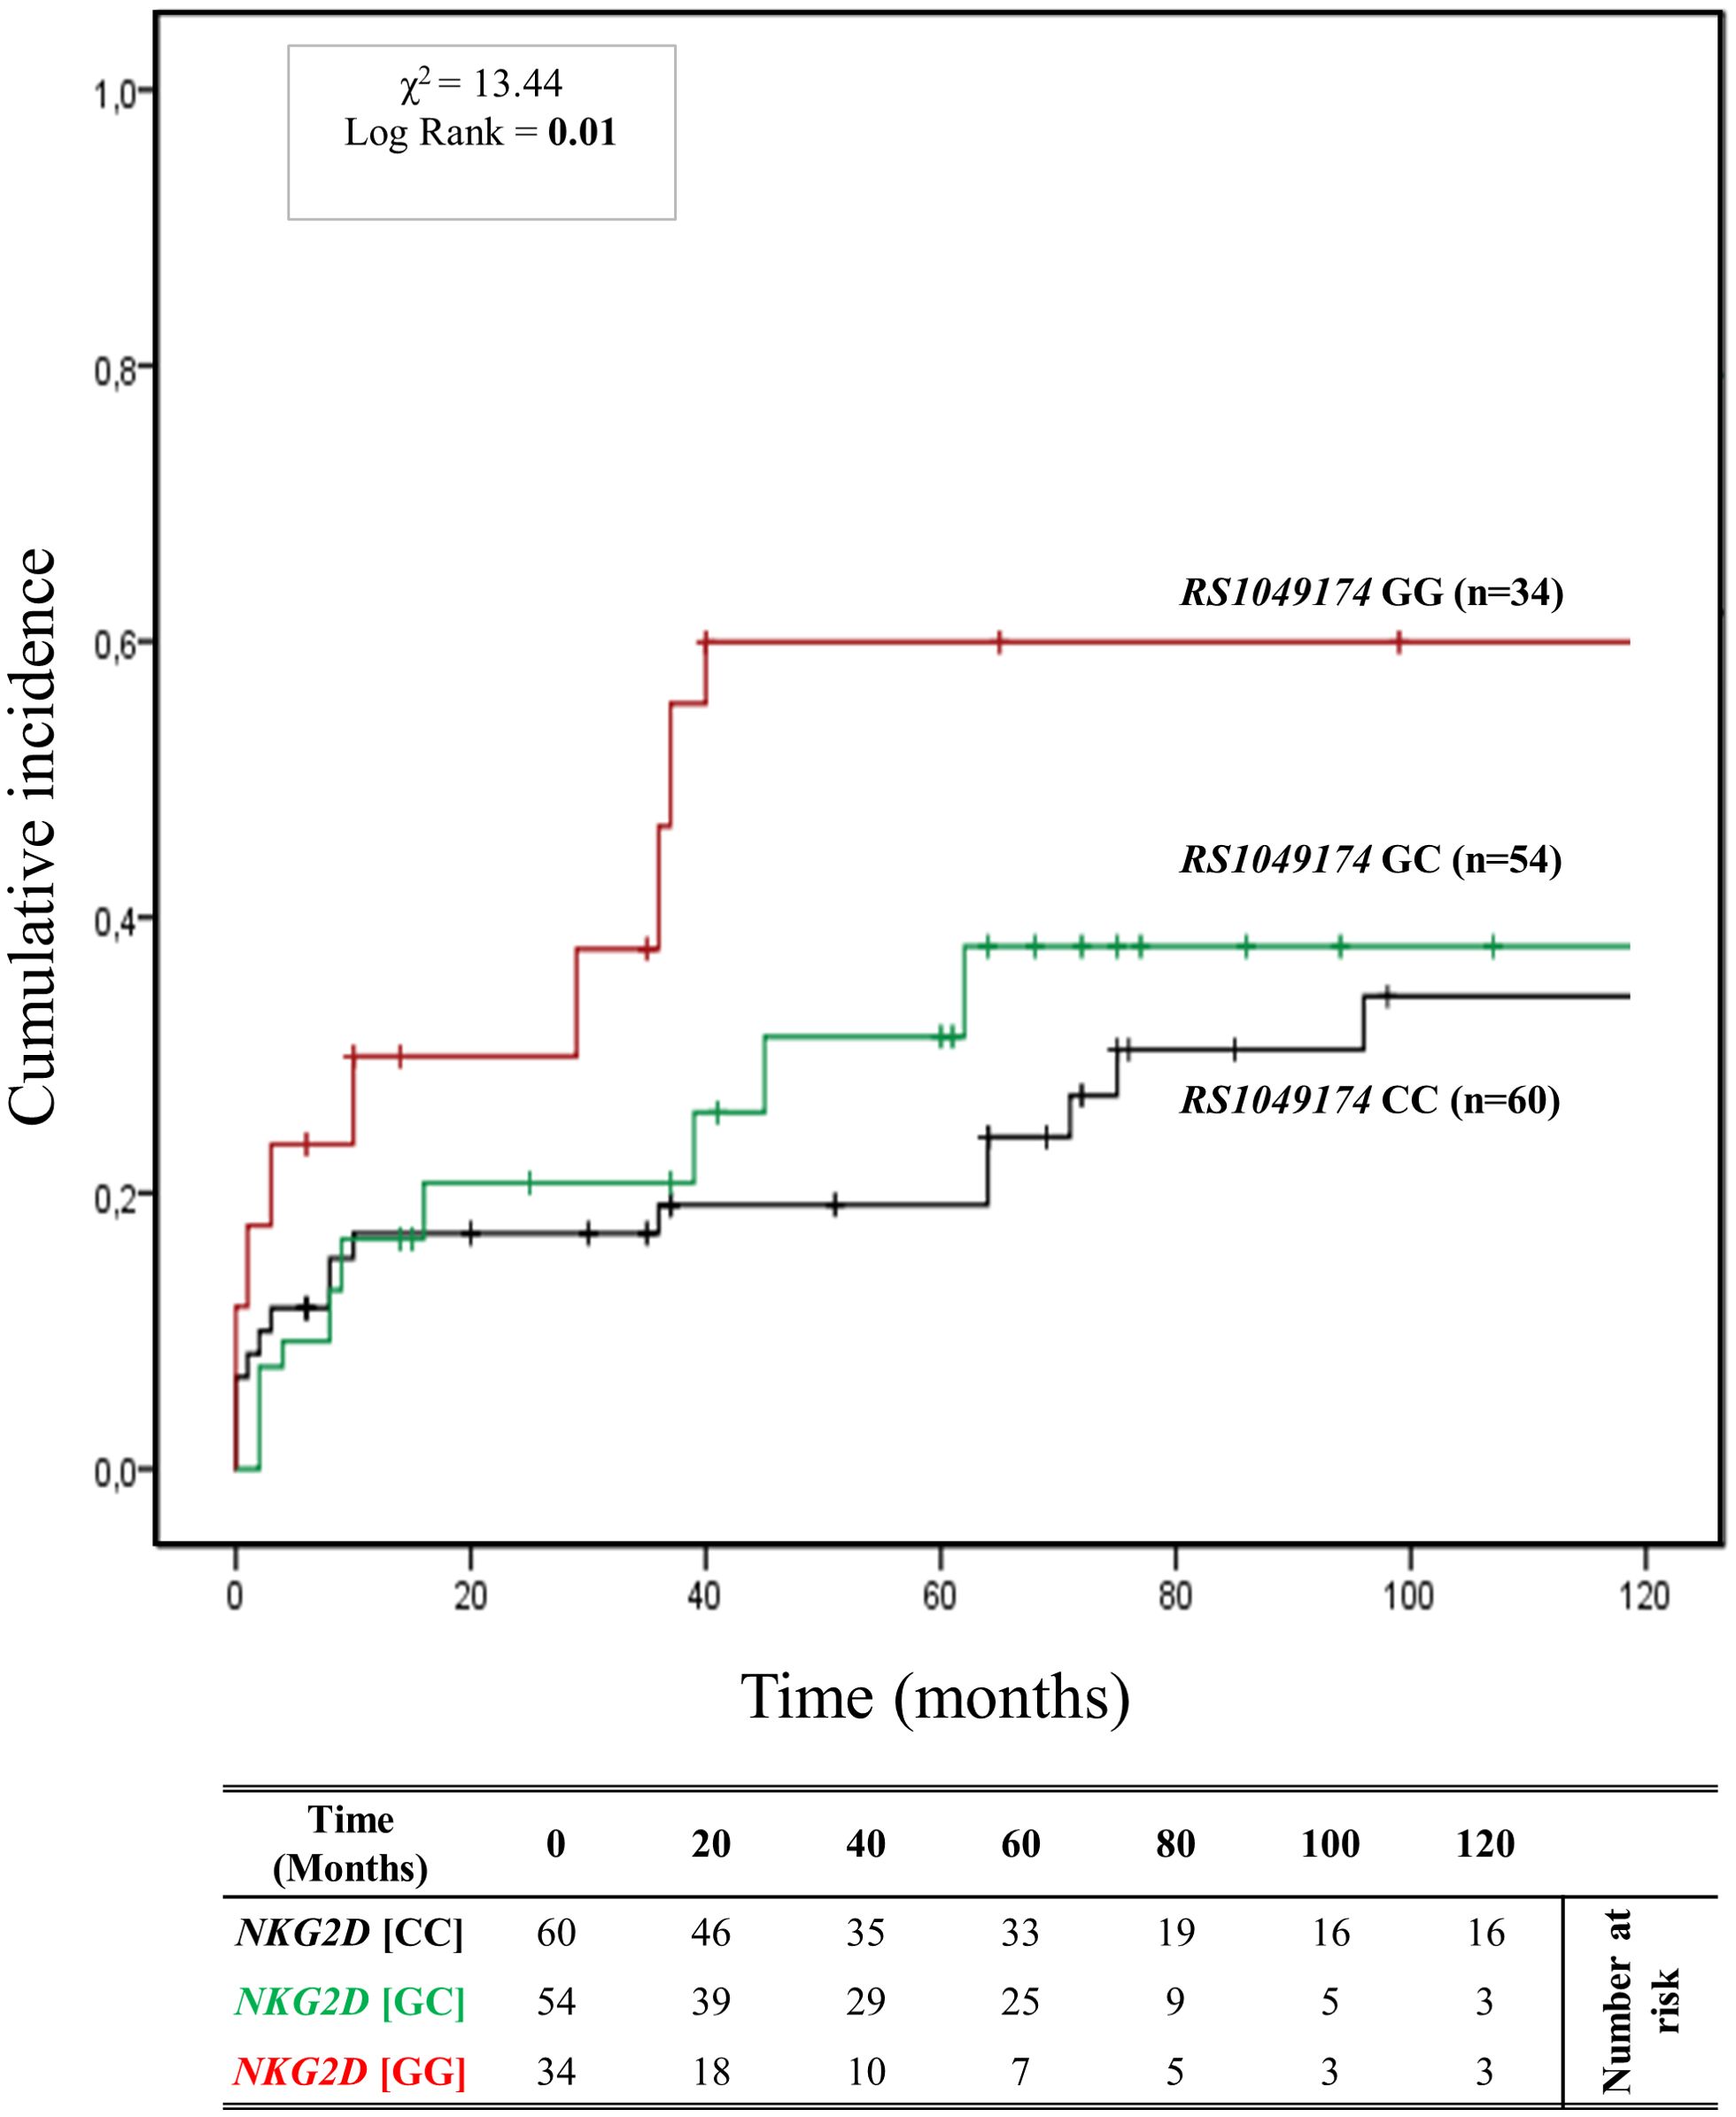
Figure 3. Cumulative incidence for antibody-mediated rejection according to NKG2D rs1049174 (G>C) genotype. The cumulative incidence of rejection events is graphically presented for a cohort of 148 patients observed over 120 months. Patients were categorized into three groups based on their NKG2D genotype for rs1049174 (G>C) [GG (red), GC (green), CC (black)]. This allele is linked to the haplotype blocks NKG2D hb-1, which produces NKG2DR with low (rs1049174 [CC]; LNK) or high (rs1049174 [GG]; HNK) natural cytotoxic activity phenotypes. P-values were calculated using the two-sided Log-rank test without correction. χ2, Chi-square.
Patients with the rs1049174 [GG] genotype exhibited a significantly increased risk of antibody-mediated rejection (X² = 13.44; Log-rank = 0.001). Indeed, at 120 months post-transplantation, the cumulative incidence of ABMR was higher (61.8% (21/34)) in the group of patients with the rs1049174 [GG] genotype compared to 42.6% (23/54) and 40.0% (24/60) in patients with the rs1049174 [CG] and rs1049174 [CC] genotypes, respectively.
This evidence was also confirmed by the trends in renal function, as assessed through serum creatinine levels (SCr) and glomerular filtration rate (eGFR). Difference in eGFR was already evident at 12 months [(57.90 ± 25.98 mL/min/1.73 m2 [GG] vs 63.34 ± 22.74 mL/min/1.73 m2 [CG] vs 71.22 ± 21.93 mL/min/1.73 m2 [CC]; P = 0.085], at 36 months [(52.42 ± 23.22 mL/min/1.73 m2 [GG] vs 58.23 ± 26.92 mL/min/1.73 m2 [CG] vs 77.60 ± 24.74 mL/min/1.73 m2 [CC]; P = 0.007], and continued to rise at 72 months [(42.60 ± 27.43 mL/min/1.73 m2 [GG] vs 63.18 ± 30.48 mL/min/1.73 m2[CG] vs 64.02 ± 31.50 mL/min/1.73 m2 [CC]; P = 0.037] after transplantation. The PAUC was also statistically significant (PAUC = 0.002), (Supplementary Figure S4).
Concurrently, in patients with the rs1049174 [GG] genotype, mean SCr levels were worse than those of patients with the other two genotypes, rs1049174 [CG] and rs1049174 [CC]. In fact, they were significantly higher at 12 months [(128.65 ± 64.52 μmol/L [GG] vs 121.20 ± 73.37 μmol/L [CG] vs 99.28 ± 28.67 μmol/L [CC]; P = 0.046], at 36 months [(140.14 ± 65.93 μmol/L [GG] vs 122.52 ± 57.24 μmol/L [CG] vs 92.55 ± 35.97 μmol/L [CC]; P = 0.009], and continued to increase at 72 months [(195.58 ± 121.70 μmol/L [GG] vs 137.80 ± 168.75 μmol/L [CC] vs 125.87 ± 89.65 μmol/L [CC]; P = 0.042]. Similarly to the eGFR curves, the PAUC for mean SCr levels was also statistically significant (PAUC = 0.023), (Supplementary Figure S5). Moreover, it is noteworthy that the influence exerted by the NKG2D rs1049174 GG polymorphism on the transplant outcome remains independent of other clinical and genetic variables, as elucidated by the multivariate logistic regression analysis (Supplementary Table S4).
3.4.3 Association of RNKG2D rs2255336 (A>G) polymorphisms and antibody-mediated rejection riskThe cumulative incidence over 120 months of antibody-mediated rejection (ABMR) in patients divided based on the three genotypes (AA, AG, and GG) of the other haploblock NKG2D identified by the rs2255336 (A>G) as highlighted in Figure 4. Twelve (8.2%) patients had the rs2255336 [AA] genotype, 68 (45.9%) were heterozygous [AG], and 68 (45.9%) were homozygous [GG]. At 5 years post-transplantation, graft survival was only 33.3% (4/12) for patients with the rs2255336 [AA] genotype, compared to 63.9% (43/68) and 69.1% (47/68) for patients with the rs2255336 [AG] and rs2255336 [GG] genotypes, respectively. Patients with the rs2255336 [AA] genotype exhibited a significantly increased risk of antibody-mediated rejection. At 120 months after transplantation, the incidence of antibody-mediated rejection was 66.7% (8/12) in these patients, while in patients with rs2255336 [AG] and rs2255336 [GG] genotypes, it was 41.2% (28/68) and 47.1% (32/68), respectively. However, the Mantel-Cox log-rank test did not reach statistical significance (X2 = 0.34; Log-rank = 0.84). Interestingly, this polymorphism appears to influence the eGFR of transplanted patients over time. Individuals with the rs2255336 [AA] genotype exhibited lower eGFR values compared to patients with the other two genotypes, rs2255336 [AG] and rs2255336 [GG], already at 12 months [(55.60 ± 32.13 mL/min/1.73 m2 [AA] vs 63.40 ± 23.58 mL/min/1.73 m2[AG] vs 69.41 ± 21.31 mL/min/1.73 m2 [GG]; P = 0.194]. This difference reached statistical significance at 36 months [(39.31 ± 20.38 ml/min [AA] vs 60.45 ± 28.05 mL/min/1.73 m2 (AG) vs 73.53 ± 24.29 mL/min/1.73 m2 [GG]; P = 0.047] and continued to rise at 72 months [(26.34 ± 20.32 mL/min/1.73 m2 [GG] vs 62.10 ± 31.89 mL/min/1.73 m2 [AG] vs 61.45 ± 29.28 mL/min/1.73 m2 [GG]; P = 0.015] after transplantation. In this case, the PAUC also reached statistical significance (PAUC = 0.028), (Supplementary Figure S6). SCr levels also appear to be significantly influenced by the three genotypes of RNKG2D rs2255336 (PAUC = 0.030), (Supplementary Figure S7). Higher values are observed in the presence of the rs2255336 [AA] genotype and tend to progressively increase over time: at 12 months [(154.13 ± 89.45 μmol/L [AA] vs 119.19 ± 67.38 μmol/L [AG] vs 100.31 ± 27.70 μmol/L [GG]; P = 0.073], at 36 months [(189.38 ± 68.47 μmol/L [AA] vs 148.80 ± 154.93 μmol/L [AG] vs 95.95 ± 35.32 μmol/L [GG]; P = 0.307] and continued to increase at 72 months [(286.55 ± 154.16 μmol/L [AA] vs 170.28 ± 216.80 μmol/L [AG] vs 152.21 ± 165.73 μmol/L [GG]; P = 0.160].
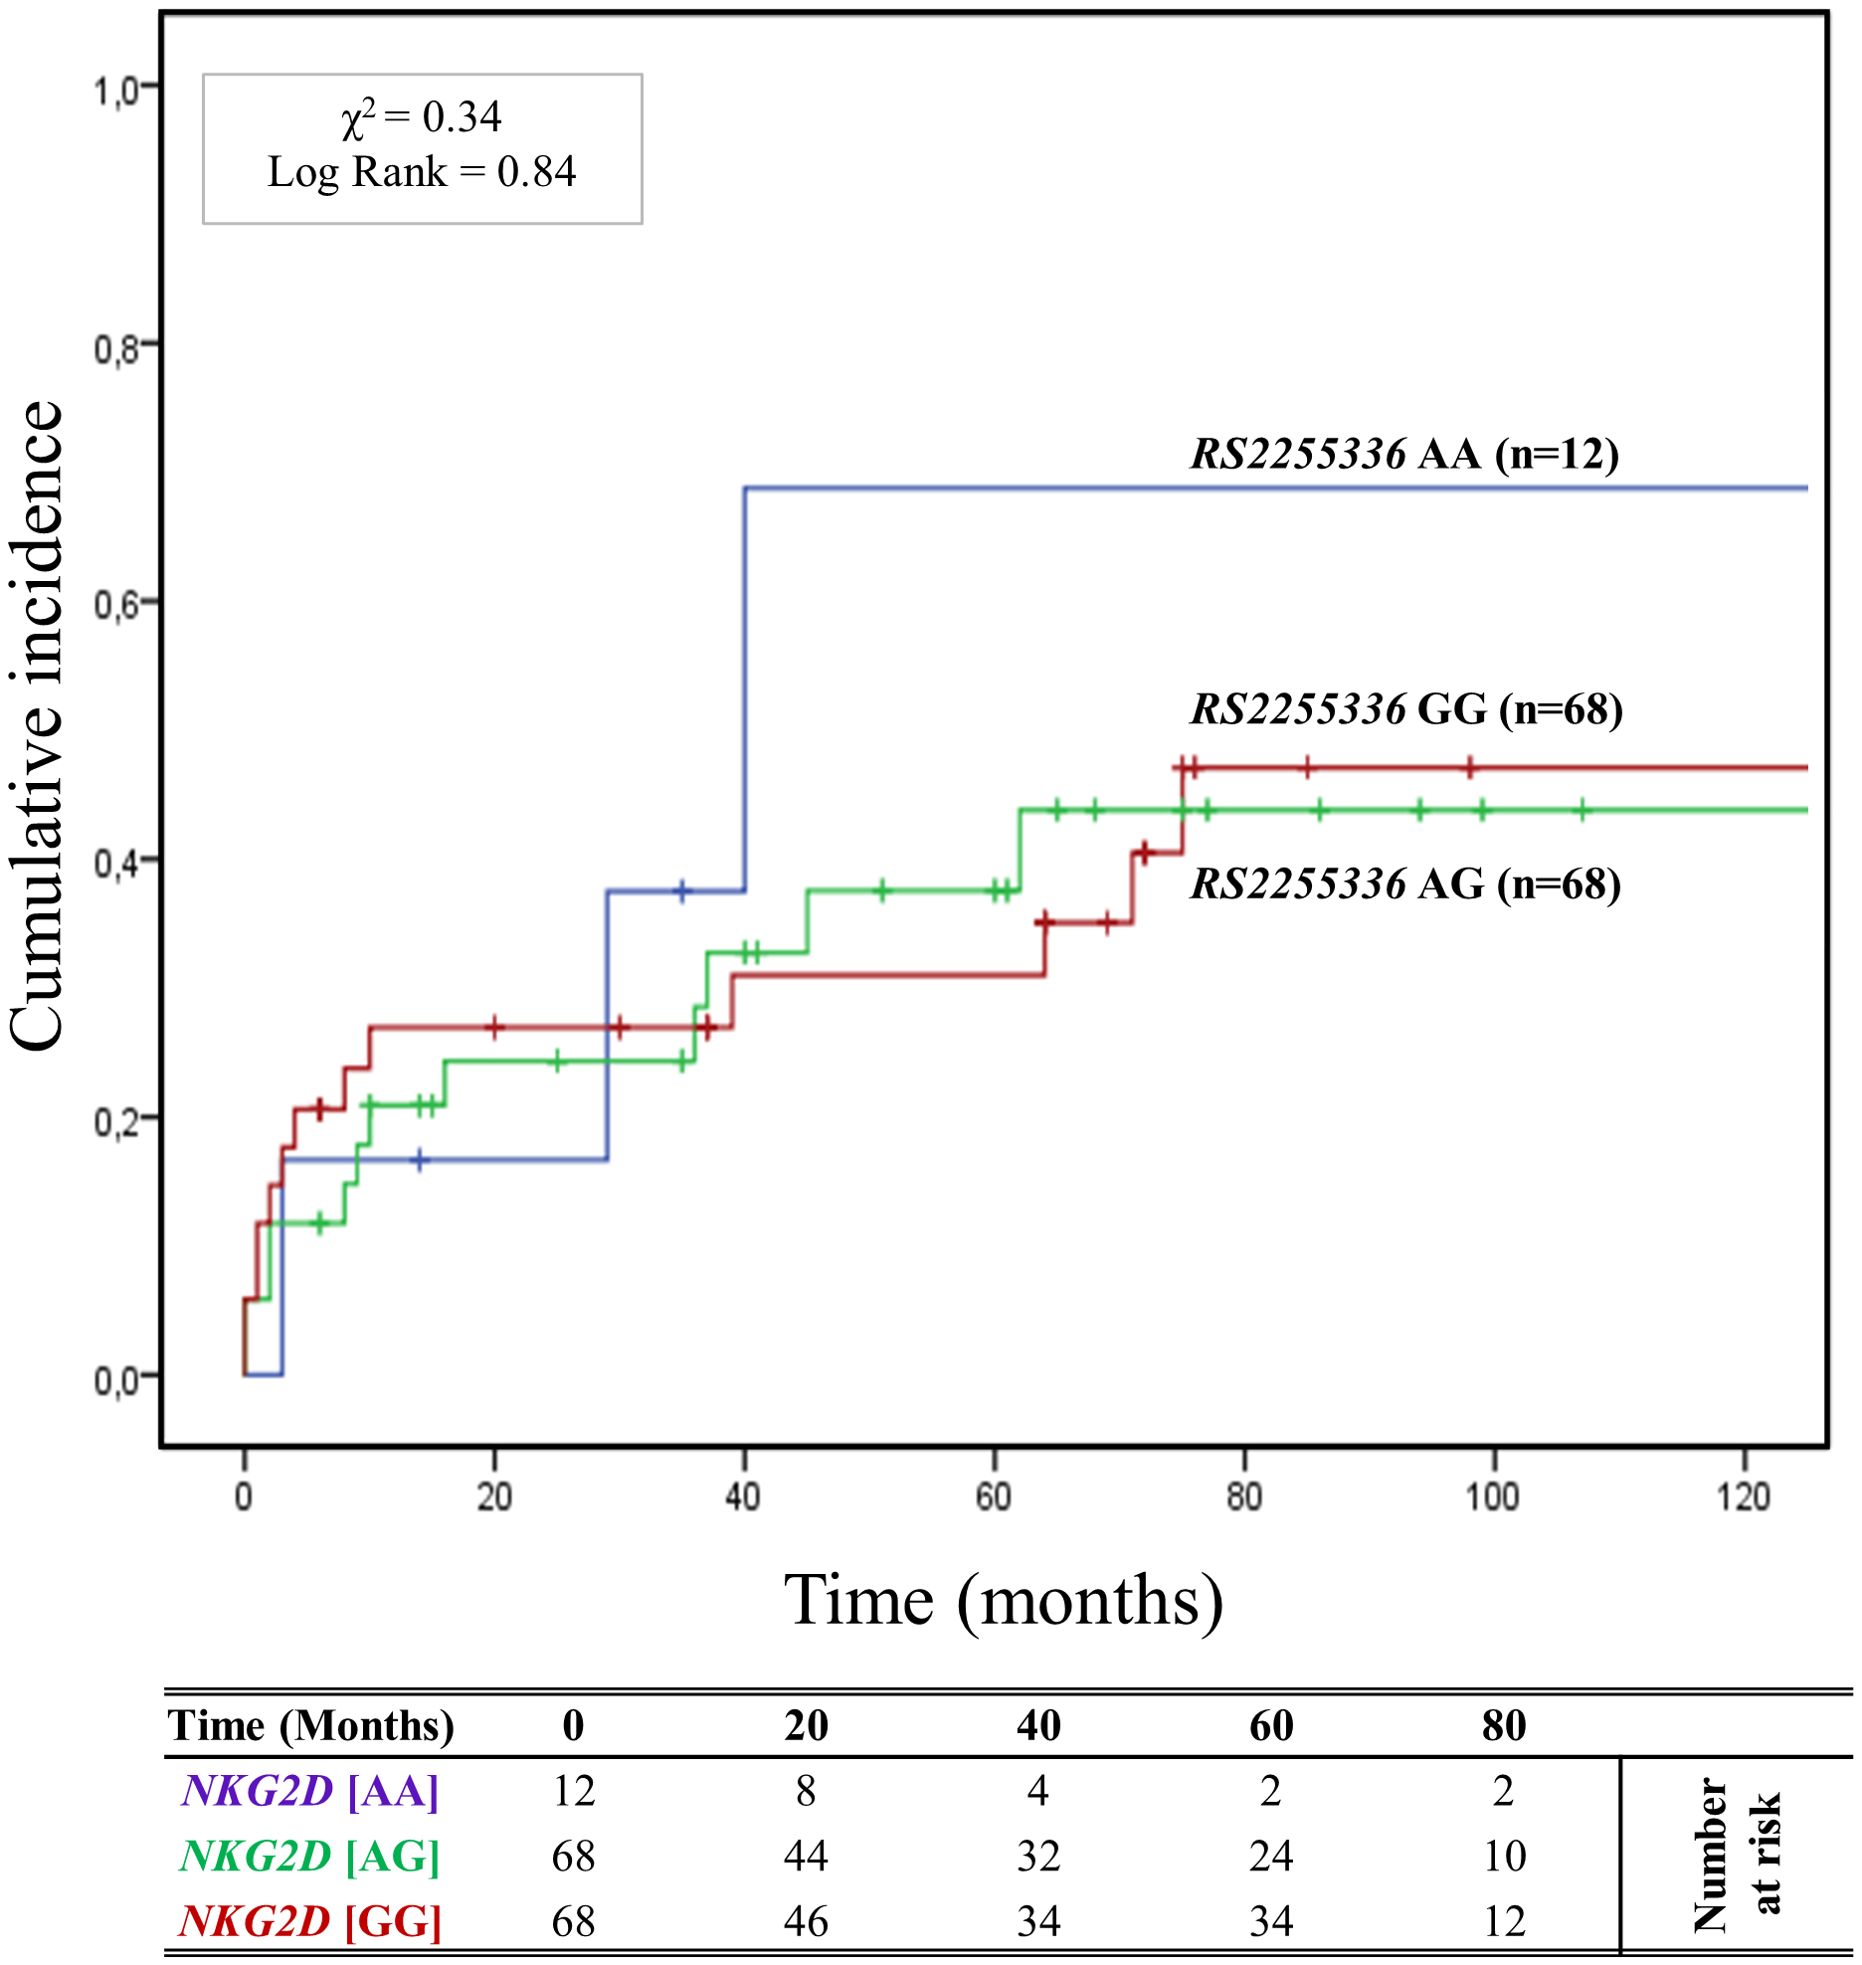
Figure 4. Cumulative incidence for antibody-mediated rejection according to NKG2D rs2255336 (A>G) genotype. The cumulative incidence of rejection events is graphically presented for a cohort of 148 patients observed over 120 months. Patients were categorized into three groups based on their NKG2D genotype for rs2255336 (A>G) [AA (light blue), AG (green), GG (red)]. This allele is linked to the haplotype blocks NKG2D hb-2, which produces RNKG2D with low (rs2255336 [GG]; LNK) or high (rs2255336 [AA]; HNK) natural cytotoxic activity phenotypes. P-values were calculated using the two-sided Log-rank test without correction. χ2, Chi-square.
3.5 Combined effect of R/D MICA allele mismatch and RNKG2D genotypes of rs1049174 (G>C) on kidney transplantationThe curve of cumulative incidence over 120 months of ABMR highlights the effect of different combinations of R/D MICA allele mismatch with the three genotypes of rs1049174 (G>C) in the NKG2D gene (GG, CG, and CC). The six curves (Figure 5) are well distinct and show a gradient of ABMR risk: 2MM/GG+ (91.6%, 11/12) > 1MM/GG+ (62.5%, 10/16) > lMM/GG- (55.5%, 20/36) > 2MM/GG- (38.3%, 23/60) > 0MM/GG+ (33.3%, 2/6) > 0MM/GG- (11.1%, 2/18). Therefore, the highest risk of rejection occurs in the patients with the rs1049174 GG+ genotype transplanted with a donor with complete MICA allele mismatch (2MM/GG+). Conversely, patients with rs1049174 GG- and MICA allele match with the donor (0MM/GG-) present a minimal incidence of ABMR (X2 = 23.21; Log-rank < 0.001).
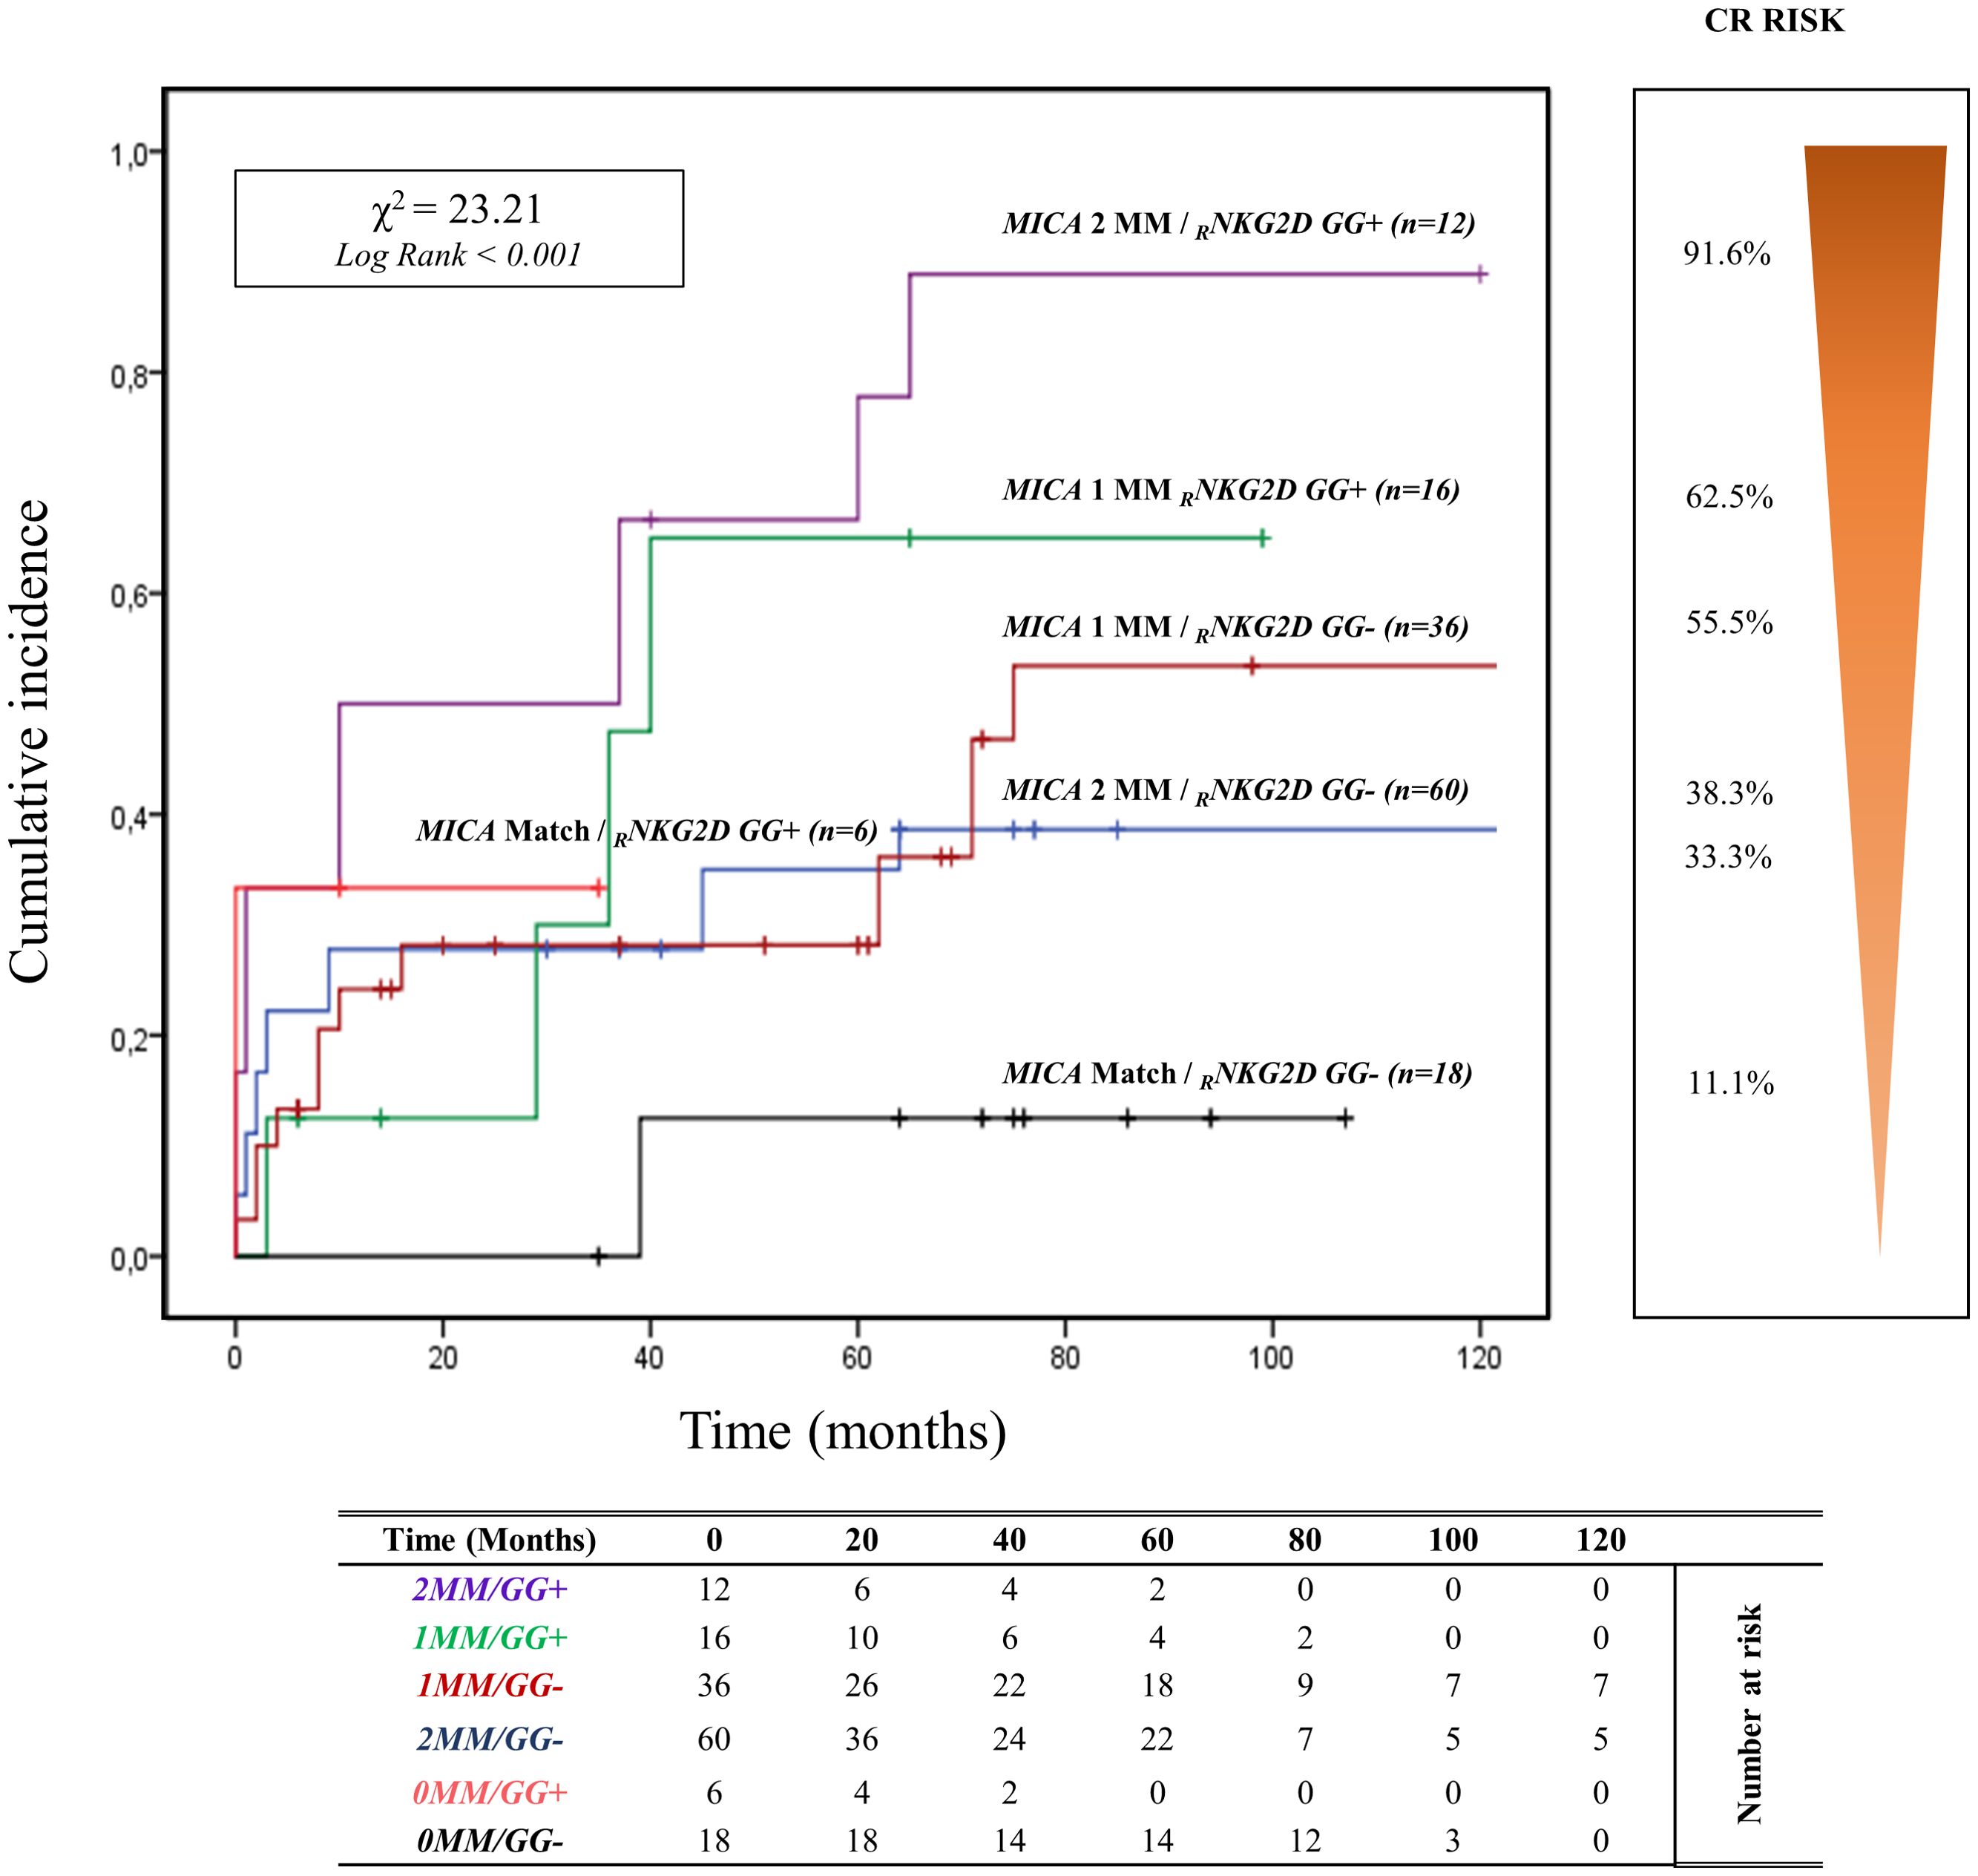
Figure 5. Cumulative incidence for antibody-mediated rejection according to NKG2D rs1049174 [GG] genotype and MICA allele mismatches. The cumulative incidence of rejection events is graphically presented for a cohort of 148 patients observed over 120 months. Patients were categorized based on their NKG2D genotype GG for and rs1049174 in combination with the donor-recipient MICA allele mismatches. The rs1049174 [GG], which produces RNKG2D with high natural cytotoxic activity phenotypes, has been correlated with donor-recipient MICA allele mismatches. Six groups were formed based on the number of MICA allele mismatches and the presence or absence of the GG (rs1049174) genotype: 1. Two MICA R/D allele mismatches and rs1049174 RNKG2D[GG] (purple) 2. One MICA R/D allele mismatches and rs1049174 RNKG2D[GG] (green) 3. One MICA R/D allele mismatches and rs1049174 RNKG2D[GG] (red) 4. Two MICA R/D allele mismatch and rs1049174 RNKG2D[CG] and [CC] (light blue) 5. MICA R/D alleles match and rs1049174 RNKG2D[GG] (orange) 6. MICA R/D alleles match and rs1049174 RNKG2D[CG] and [CC] (black). P-values were calculated using the two-sided Log-rank test without correction. χ2, Chi-square. MM, mismatches.
Renal function, monitored through SCr levels and eGFR, appears to be closely influenced by the combination of R/D MICA allele mismatch with the three genotypes of rs1049174 (G>C) in the NKG2D gene (Supplementary Figures S8, S9 respectively). Moreover, the adverse effect exerted by the 2MM/GG+ combination on the kidney transplant outcome is observed in the subgroup of patients with HLA-DRB1 and HLA-DQB1 match with the donor and those with HLA II class mismatch.
In patients with HLA-DRB1 and HLA-DQB1 full match, the cumulative incidence curve over 120 months illustrates that the highest risk of rejection occurs in individuals with the 2MM/GG+ and 1MM/GG+ combinations (83.3%, 10/12). Conversely, no patients with 0MM/GG+ and 0MM/GG- (0%, 0/8) show episodes of ABMR (X2 = 13.59; Log rank = 0.001; Figure 6). Similar results are observed when analyzing the remaining and more numerous subgroups of patients with 1 or 2 HLA-DRB1 and HLA-DQB1 allele mismatches with the donor (X2 = 14.81; Log-rank = 0.002; Supplementary Figure S10).
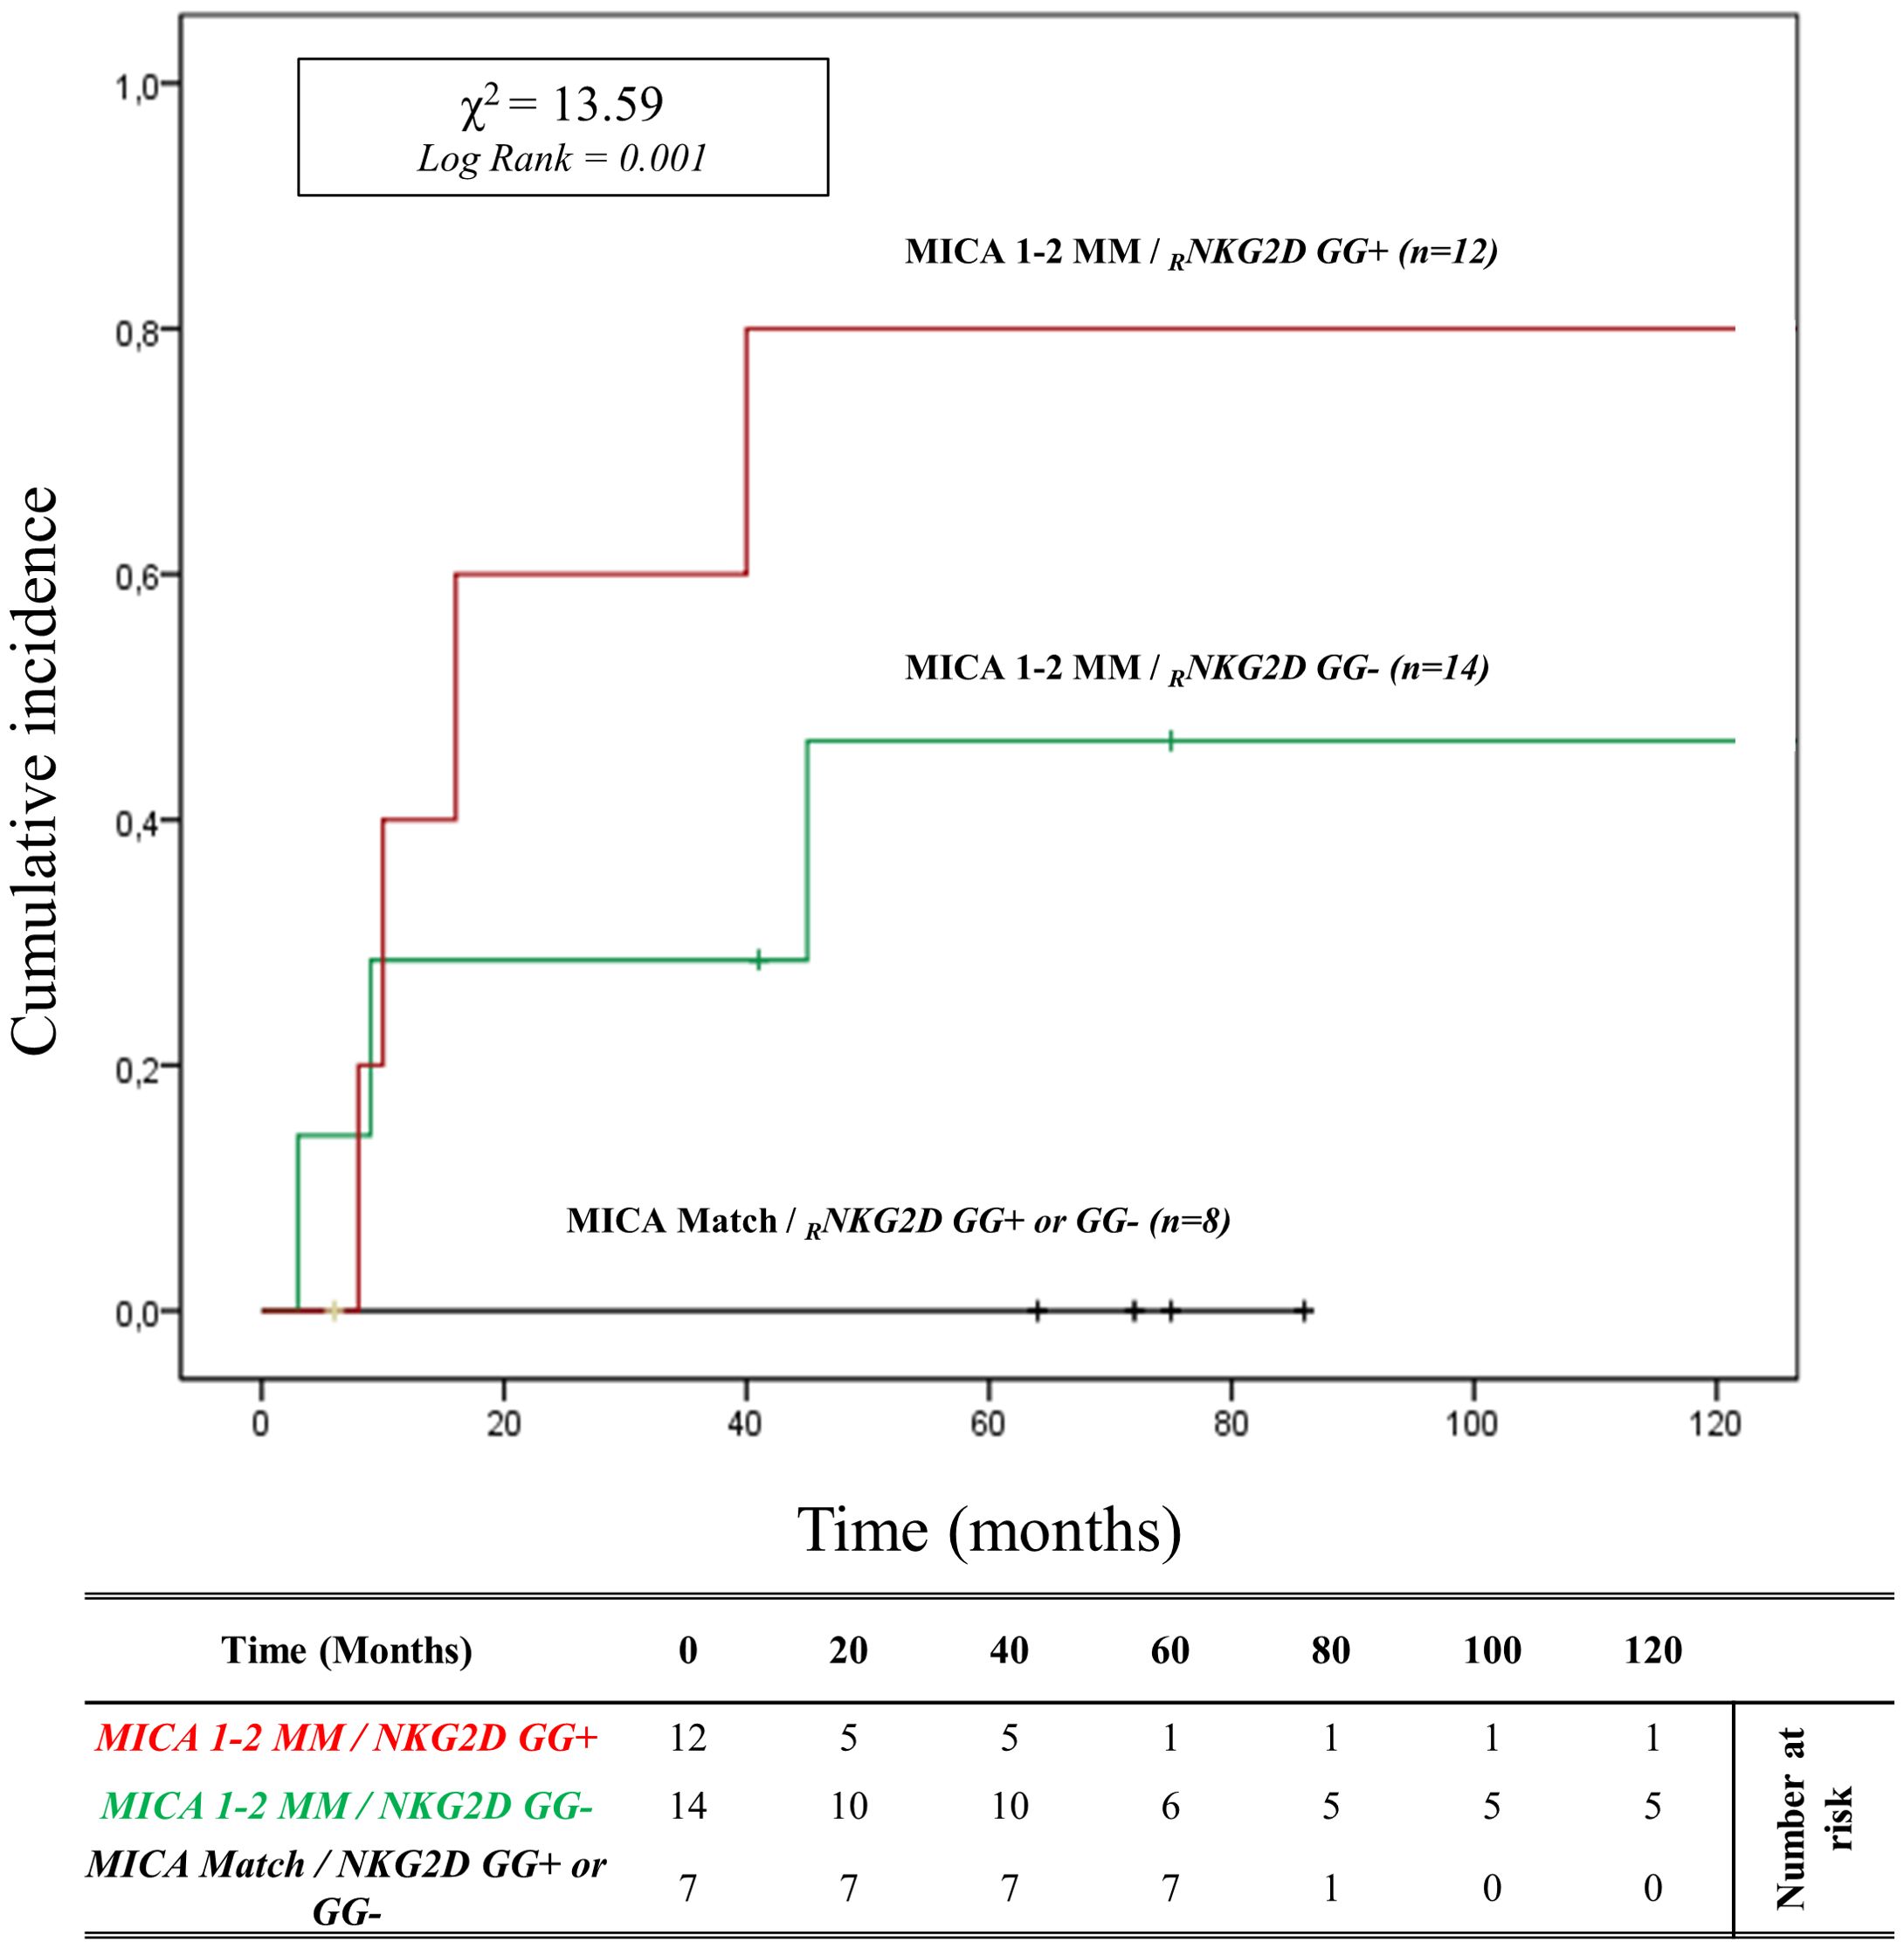
Figure 6. Cumulative incidence for antibody-mediated rejection in patient’s HLA-DRB1 and HLA-DQB1 match R/D according to NKG2D genotype and MICA allele mismatches. The cumulative incidence of rejection events is graphically presented for a cohort of 33 patients with HLA-DRB1 and HLA-DQB1 match R/D observed over 120 months. Patients were categorized into three groups based on the following criteria: 1. R/D MICA alleles match independently of the NKG2D rs1049174 genotype (black). 2. R/D MICA alleles 1-2 mismatches with NKG2D rs1049174 CG or CC genotype (marked as GG-) (green). 3. R/D MICA alleles 1-2 mismatch with NKG2D rs1049174 GG genotype (red). P-values were calculated using the two-sided Log-rank test without correction. χ2, Chi-square. MM, mismatches; R/D, recipient-donor.
It’s well known that there is linkage disequilibrium between MICA and HLA-B due to the proximity of these genes. To better determine the contribution of MICA allele mismatches in the development of ABMR, we analyzed the HLA-B full-match D/R pairs separately. In this small cohort of patients (n=12), the cumulative incidence curve over 120 months illustrates that the highest risk of rejection occurs in individuals with the 1-2MM/GG+ and 1-2MM/GG- combinations (80.0%, 4/5). Conversely, no patients with 0MM/GG+ and 0MM/GG- (0%, 0/7) show episodes of ABMR (X2 = 19.00; Log rank < 0.001; Figure 7).
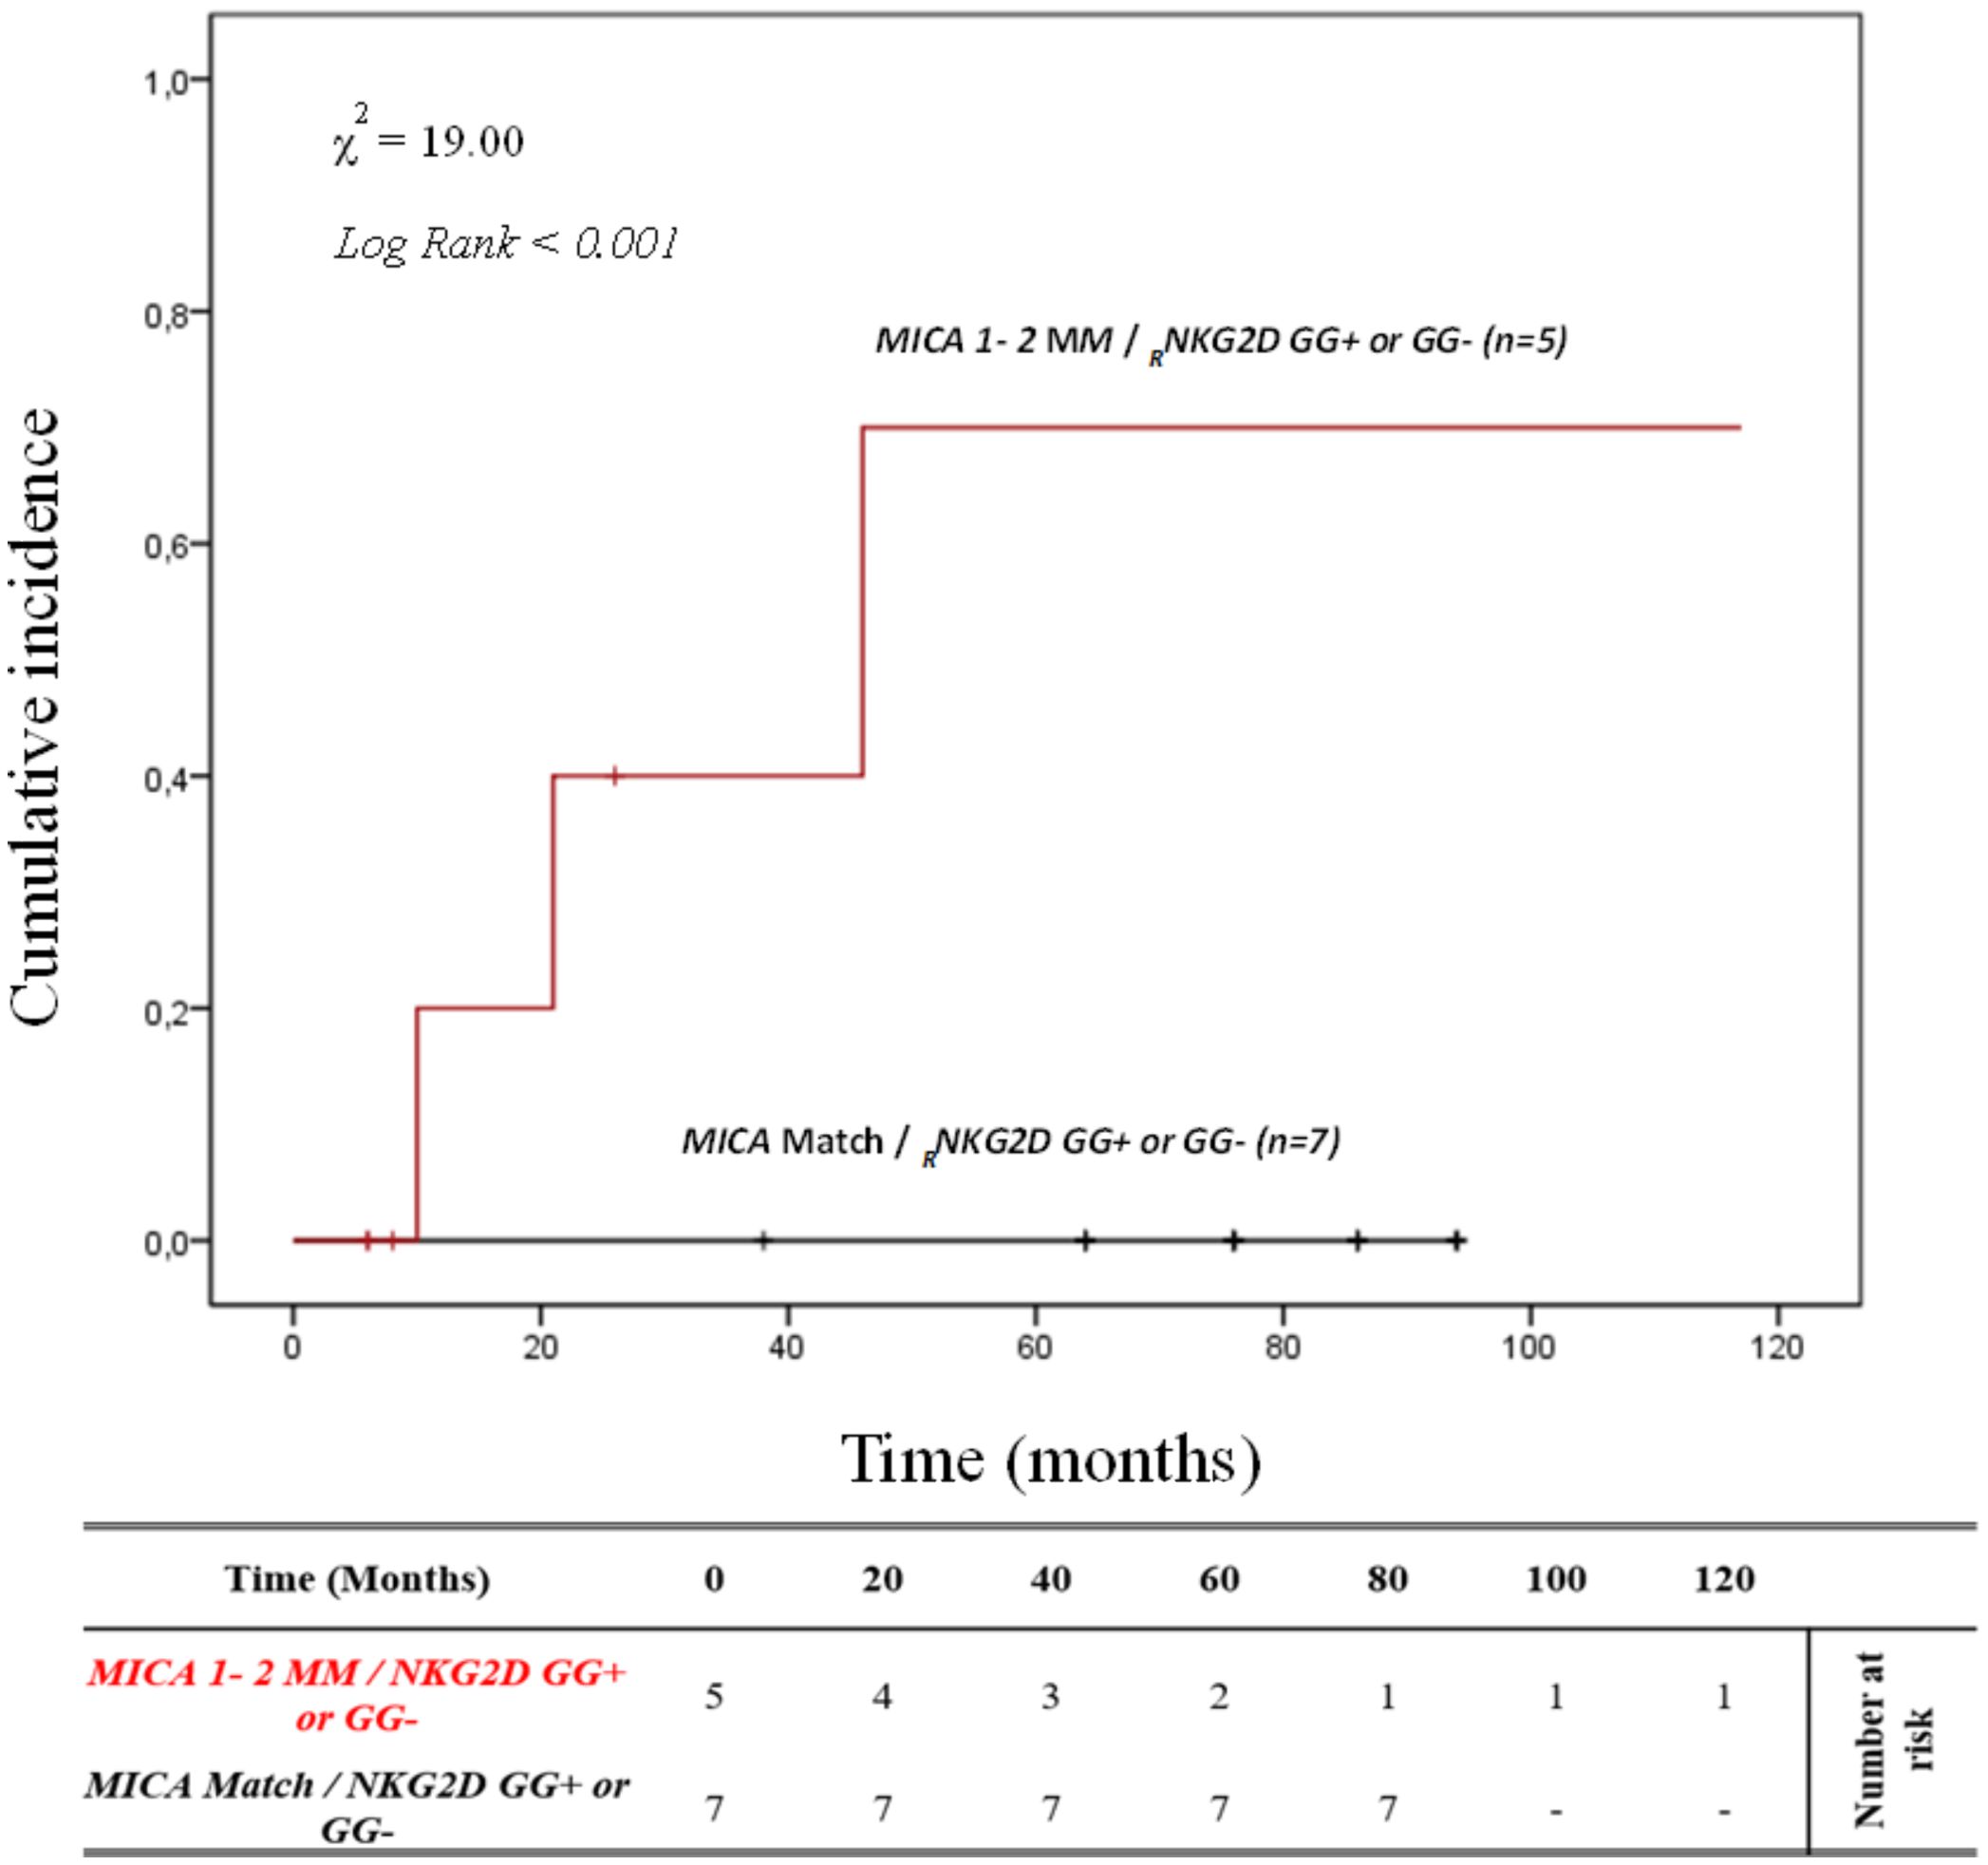
Figure 7. Cumulative incidence for antibody-mediated rejection in patient’s HLA-B match R/D according to NKG2D genotype and MICA allele mismatches. The cumulative incidence of rejection events is graphically presented for a cohort of 12 patients with HLA-B match R/D observed over 120 months. Patients were categorized into two groups based on the following criteria: 1. R/D MICA alleles match independently of the NKG2D rs1049174 genotype (black). 2. R/D MICA alleles 1-2 mismatch independently of the NKG2D rs1049174 genotype (red). P-values were calculated using the two-sided Log-rank test without correction. χ2, Chi-square. MM, mismatches; R/D, recipient-donor.
This data suggests that the effect of the different combinations of these polymorphisms is independent of HLA class I and class II matching.
Furthermore, the effect exerted by the 2MM/GG+ combination on the kidney transplant outcome is also independent of other clinical and genetic variables, as highlighted by the multivariate logistic regression analysis (Supplementary Table S3).
Finally, since the R/D MICA-129 mismatches were significant in the previous analysis, we examined it in combination with the rs1049174 [GG] polymorphism of the NKG2D receptor (Supplementary Figure S1A). The cumulative incidence curves over 120 months for ABMR based on R/D MICA-129 1 or 2 mismatches (1 MM and 2 MM) and the NKG2D rs1049174 [GG] polymorphism, were categorized as R/D: MM/MV, VV/MV, MM/VV, and VV/MM (Supplementary Figure S1A). Two MICA-129 mismatches were identified in 8 R/D pairs with the VV/MM/GG+ genotype (15.3%) and 4 R/D pairs with the MM/VV/GG+ genotype (7.7%), while 10 patients with 2 mismatches did not carry the NKG2D rs1049174 [GG] polymorphism (4 R/D pairs VV/MM/GG- (7.7%) and 6 MM/VV/GG- (11.5%). Among patients with one mismatch, there were 16 R/D pairs MM/MV/GG- (30.8%) and 14 R/D pairs VV/MV/GG- (26.9%). The median follow-up was only 15.3 months for patients with 2 MICA-129 mismatches and the presence of NKG2D rs1049174 [GG] (VV/MM/GG+ and MM/VV/GG+), while it was 35.1 months for those with 2 MICA-129 mismatches and absence of NKG2D rs1049174 [GG] (VV/MM/GG- and MM/VV/GG-). In contrast, in patients with one MICA-129 mismatch the median follow-up was 79.3 months for MM/MV/GG- and 60.6 months for VV/MV/GG-.
At 5 years post-transplantation, for patients with 1 MICA-129 mismatch and rs1049174 [GG-], graft survival was 100% (16/16) for R/D pairs MM/MV/GG- and 85.7% (12/14) for R/D pairs VV/MV/GG-. In the presence of 2 MICA-129 mismatches and rs1049174 [GG+], graft survival was 87.5% (7/8) for R/D pairs VV/MM/GG+ and 0% (0/4) for R/D pairs MM/VV/GG+. When 2 MICA-129 mismatches were associated with rs1049174 [GG-], 5-year graft survival was 50% (2/4) in R/D pairs VV/MM/GG- and 66.7% (4/6) for R/D pairs MM/VV/GG-.
Patients with 2 MICA-129 mismatches and the presence of NKG2D rs1049174 [GG] showed a significantly higher risk of antibody-mediated rejection (X² = 27.33; Log-rank < 0.001).
Notably, at 120 months post-transplantation, the cumulative incidence of ABMR was 100% in patients with 2 MICA-129 mismatches combined with the rs1049174 [GG] genotype (MM/VV/GG+ and VV/MM/GG+). In contrast, in the absence of the rs1049174 [GG] genotype (VV/MM/GG- and MM/VV/GG-), the cumulative incidence of rejection decreased to 50% (2/4) and 33.3% (2/6), respectively (Supplementary Figure S1A).
Lastly, we also analyzed cumulative incidence curves over 120 months for ABMR based on combination R/D MICA-129 1 or 2 mismatches (1 MM and 2 MM) and the other NKG2D polymorphism (rs2255336 [AA]), categorized as R/D: MM/MV, VV/MV, MM/VV, and VV/MM (Supplementary Figure S1B). Two MICA-129 mismatches were identified in 2 R/D pairs with the MM/VV/AA+ genotype (3.8%), while 20 patients with 2 mismatches did not carry the NKG2D rs2255336 [AA] polymorphism (12 R/D pairs VV/MM/AA- (23.1%) and 8 MM/VV/AA- (15.4%)). Among patients with one mismatch, there were 16 R/D pairs MM/MV/AA- (30.8%) and 14 R/D pairs VV/MV/AA- (26.9%). The median follow-up was 29.1 months for patients with 2 MICA-129 mismatches and the presence of rs2255336 [AA] (MM/VV/AA+), while it was 27.8 months for those with 2 MICA-129 mismatches and absence of rs2255336 [AA] (VV/MM/AA- and MM/VV/AA-). Instead, patients with only 1 MICA-129 mismatch and absenc
留言 (0)