
記住我
Social interaction is important to normal development. Social isolation in children and adolescents through circumstances like pandemic lockdowns or serious childhood illness are associated with physiological traits like increased cortisol levels (Taylor et al., 2022; de Laia Almeida et al., 2021) and mental health issues such as anxiety, depression, and reduced cognitive development (Manning et al., 2014; de Laia Almeida et al., 2021; Shah et al., 2020; Meherali et al., 2021; Pahl et al., 2021). These effects may endure past the time of the isolation itself (Loades et al., 2020). In animal models, social isolation in early life also has profound effects on adult social competence, in that previously isolated animals may be less responsive to the cues of social partners or show behaviors that are not adjusted to the varying dynamics of social interactions (Tóth et al., 2008; Oliveira, 2009; Taborsky and Oliveira, 2012; Keesom et al., 2017a; Maruska et al., 2019). Social isolation may increase aggressive behaviors, decrease or increase sociability, or alter the range of behaviors displayed in a given social context (Shimozuru et al., 2008; Bicks et al., 2020; Yamamuro et al., 2020; Araki et al., 2021). Sensitivity to isolation is also seen in communication behaviors. For example, social isolation may increase or decrease the numbers of vocal signals in social settings, change the relative production of different types or structural characteristics of vocalizations, or cause the production of vocalizations in abnormal contexts (Tomazini et al., 2006; Yu et al., 2011; Chabout et al., 2012; Hamed and Kursa, 2020; Caruso et al., 2022). Isolation changes not only the production of communication signals, but also responses to social signals by previously isolated individuals. Isolation may alter the attractiveness of vocal signals (Seffer et al., 2015), cause more rapid adaptation to aversive vocal signals (Hood et al., 2023), or lengthen the time needed to learn to distinguish among call types with different structure (Screven and Dent, 2019).
Isolation-induced changes in communication behavior may be brought about in part through effects of isolation on modulatory neurochemical systems (e.g., Hamed and Kursa, 2020; Broadfoot et al., 2023; Menon and Neumann, 2023). One of these is the serotonergic system, including the dorsal raphe nucleus (DRN). The DRN is a major source of serotonergic input to forebrain and midbrain regions, including sensory systems and regions related to social behavior (Waterhouse et al., 1986; Vertes, 1991; Hale and Lowry, 2011; Muzerelle et al., 2016; Niederkofler et al., 2016; Ren et al., 2018; Walsh et al., 2018; Steinbusch et al., 2021). Some DRN neurons are responsive to social context, and DRN neurons in turn influence social behaviors including aggression, sociability, and sexual behavior (Lowry et al., 2005; Liu et al., 2014; Niederkofler et al., 2016; Walsh et al., 2018; Petersen et al., 2020; Troconis et al., 2023). Manipulation of serotonin levels also alters the production of communication signals, and may selectively enhance behavioral responses to communication signals (Marquez and Chacron, 2020; Hood and Hurley, 2024). Social isolation affects many aspects of the serotonergic system, including the activity of DRN neurons during social interaction, the density of axons in target brain regions, the dynamics of serotonin release, and even the expression of serotonin receptors by postsynaptic neurons (Segal et al., 1973; Fulford and Marsden, 1998; Muchimapura et al., 2002; Schiller et al., 2003; Schiller et al., 2006; Bibancos et al., 2007; Ago et al., 2013; Dankoski et al., 2014). Although it is clear that social isolation alters both the serotonergic system and social behavior, whether and how isolation changes the relationship between serotonergic activity and social/communicative behaviors has been less well-explored.
To address these questions, we compared the effects of postweaning isolation on social behaviors, including vocal behaviors, and the activation of DRN neurons in male and female mice (Mus musculus) paired with a member of the opposite sex. In this context, males calibrate their vocal and non-vocal behaviors in response to female signals. When placed with female social partners, male mice produce the majority of ultrasonic vocalizations (USVs), which are attractive to females (Whitney et al., 1973; Hammerschmidt et al., 2009; Asaba et al., 2014; Neunuebel et al., 2015; Sterling et al., 2023). Females are the main producers of squeaks, also called broadband vocalizations (BBVs: White et al., 1998; Wang et al., 2008; Finton et al., 2017). Females produce BBVs in conjunction with kicking at males in the early stages of interactions (Finton et al., 2017). High numbers of early BBVs predict lowered male mounting later on, and the playback of BBVs to males temporarily suppresses USV production (Finton et al., 2017; Hood et al., 2023). Activity of the serotonergic system covaries with these behavioral events in both males and females. In the auditory midbrain of male mice, serotonin levels rise in the presence of a female partner, and inversely correlate with the number of female BBVs (Keesom and Hurley, 2016). Conversely, in subregions of the DRN that project to the auditory midbrain, numbers of neurons that are active during a social interaction in female mice correlate with the behavior of male social partners (Petersen et al., 2020). This system therefore provides an excellent platform for assessing the effects of social isolation on the correspondence between the activity of serotonergic neurons and social behavior.
Following several weeks of individual or same-sex group housing that began after weaning, male and female mice were placed with opposite-sex group-housed social partners, and the vocal and non-vocal behaviors displayed during this interaction were compared to the activation of serotonergic neurons in the DRN as measured through co-expression of the immediate early gene product c-Fos and tryptophan hydroxylase (TPH). We found that social isolation decreased the densities of serotonergic neurons expressing c-Fos in both sexes. Isolation also affected vocal and non-vocal behaviors by increasing both USVs and BBVs in parallel with greater male investigation of females. Isolation further reversed the correlation between c-Fos expression by serotonergic neurons and a principal component of behavior corresponding to female kicking, decreased anogenital investigation, and decreased mounting. These findings suggest an altered responsiveness of serotonergic neurons to social interaction following social isolation in males, in parallel with an altered male response to female cues.
Methods Animals and housingAll experiments were conducted in accordance with the Guidelines for the Use of Laboratory Animals, and were approved by the Bloomington Animal Care and Use Committee (protocol 21-020). All mice were housed in standard mouse laboratory cages in the same room. Food and water were provided ad libitum with a light cycle of 14:10 h light:dark. Twenty male and twenty female CBA/J mice (the Jackson Laboratory, Bar Harbor, ME) were used as subjects, and an additional 6 males and 6 females were pair- housed and used only as non-subject social partners in behavioral trials. Mice were shipped from Jackson labs at 3 weeks as non-littermates. No fighting was observed when mice were co-housed.
Experimental overviewThe 20 male and 20 female mice arrived at 3 weeks of age and were placed in either individual or same-sex paired housing (n = 10 each for each sex). Pair-housed mice were placed with cagemates of approximately similar weight. Mice stayed in their social treatment group for 21–25 days prior to behavioral trials. This resulted in four subject groups of individually housed (isolated) and socially housed (social) males and females. Following the housing treatment, mice were placed with a social partner of the opposite sex for a 60-min behavioral trial in which mice interacted freely. All social partners of the opposite sex were pair-housed with same-sex cage mates. This resulted in three social treatment groups with isolated male subjects (paired with group housed female non-subjects), isolated female subjects (paired with group housed male non-subjects), and socially housed male and female subjects paired with each other. These groups are depicted in Figure 1 (top). Following social interaction, subjects were perfused, and brains were sectioned and labeled with antibodies for tryptophan hydroxylase (TPH) and c-Fos. The numbers of double-labeled neurons in different subregions of the dorsal raphe nucleus (DRN) were compared to vocal and nonvocal behaviors across groups and individuals.
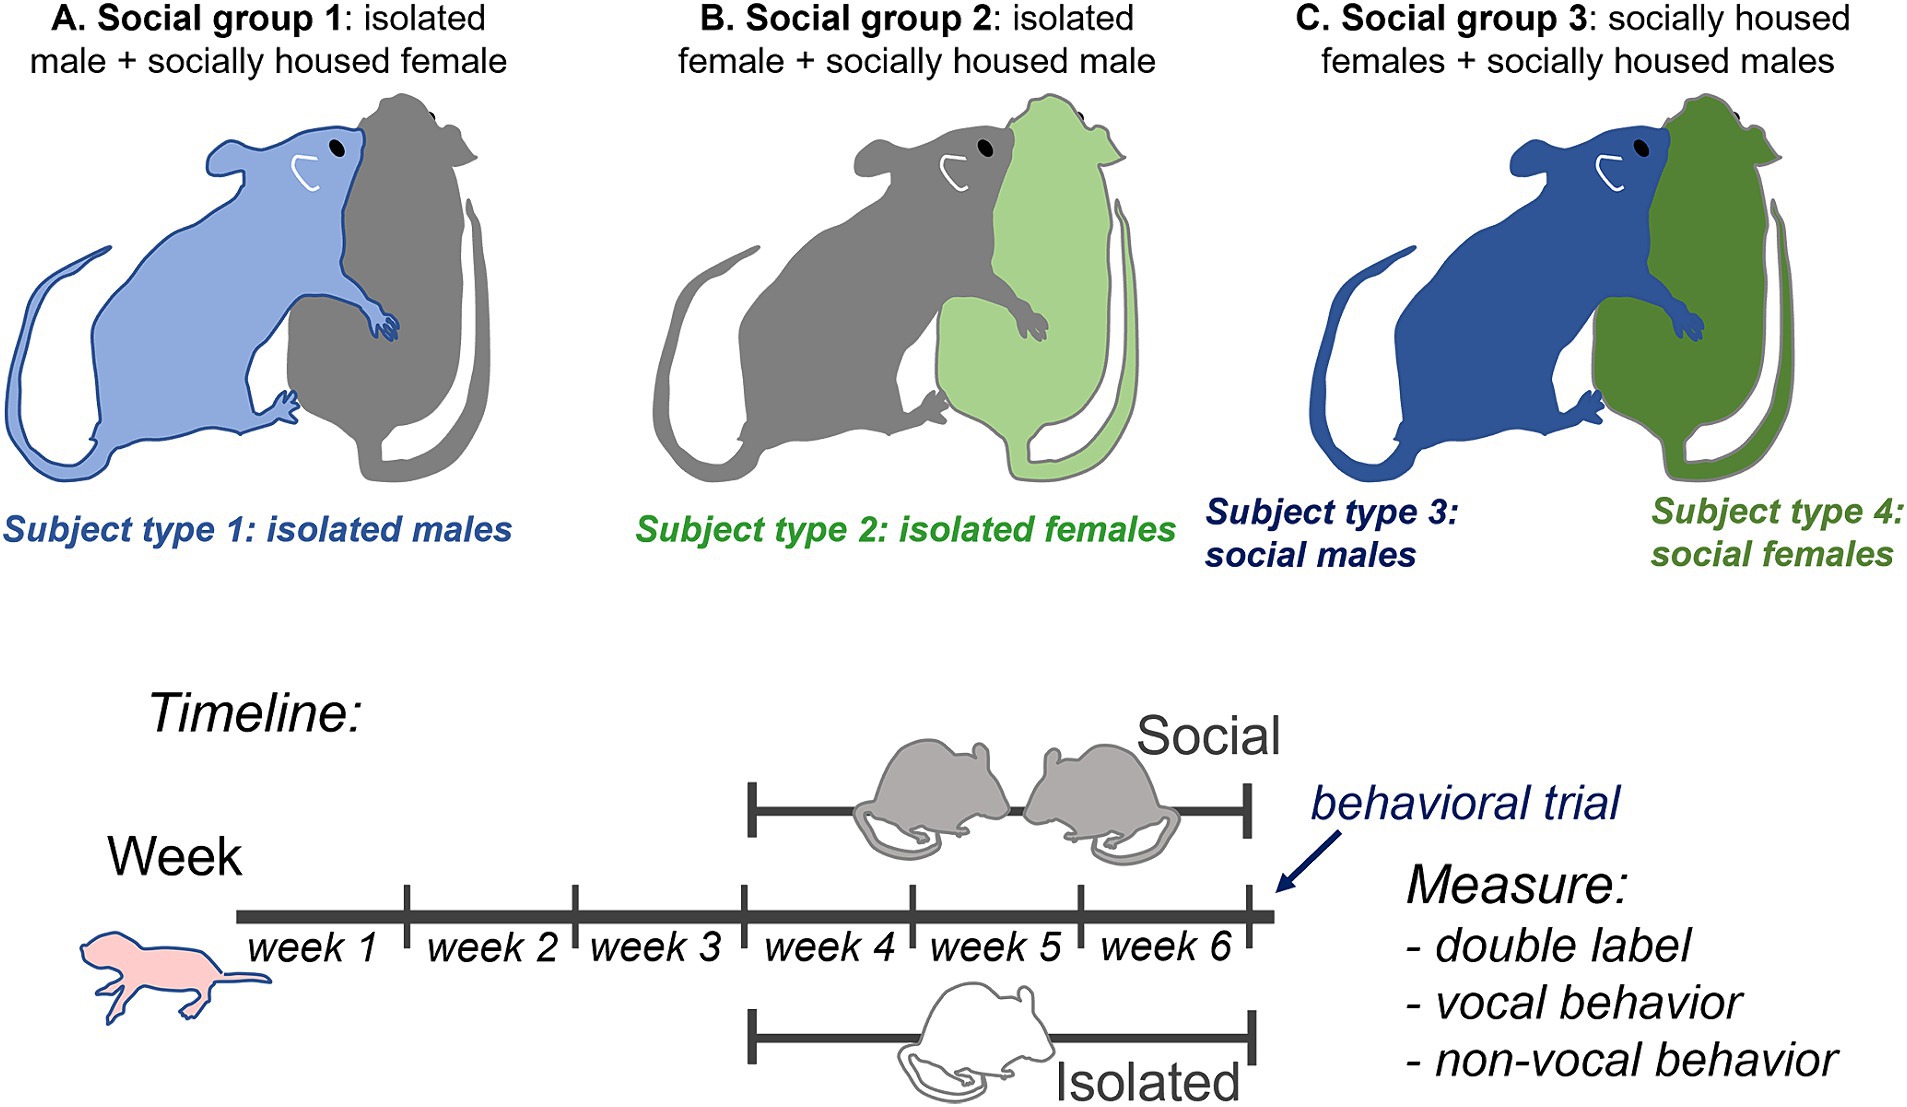
Figure 1. Top: Diagram of experimental design showing the three social treatment groups (A–C) that result in four subject groups: 1. isolated males (light blue), 2. isolated females (light green), 3. socially housed males (dark blue), and 4. socially housed females (dark green), each interacting with a socially housed partner. Some behavioral measurements that could not be ascribed to a single individual, such as call number and nose-to-nose investigation, are the same for social males and females in the same specific interaction. Bottom: timeline of experimental manipulations.
Behavioral trialsTwo to four days prior to behavioral trials, mice were habituated by twice being placed in their home cages for a period of 30 min in the sound attenuation chamber (IAC Acoustics, Naperville, IL) in which behavioral trials occurred. Behavioral trials took place between the hours of 9:30 a.m. and 3:00 p.m. On the day of behavioral trials, individual mice were habituated in a sound-attenuation chamber for a minimum of 40 min before trials. They were then transferred to another sound-attenuated behavioral recording chamber into a clean cage with pine bedding to allow for behaviors like digging. An opposite-sex social partner that had been housed in a same-sex pair was introduced into the cage. For all subject mice, this was the first postweaning encounter with a member of the opposite sex. Males in all groups directed behaviors toward females within seconds. Subjects were allowed to freely interact with social partners for a period of 1 h. Video recordings of non-vocal behaviors were made with a Canon VIXIA video camera above the cage (Q-See, Digital Peripheral Solutions Inc., Anaheim, CA) with a Q-See four-channel DVR PCI video capture card. The camera was attached to a Scepter Model E22 Monitor for viewing on the outside of the isolation chamber. Vocal behaviors were recorded using a condenser microphone (CM16/CMPA, Avisoft Bioacoustics, Glienicke/Nordbahn, Germany) placed above the cage. Audio recording was controlled through an Avisoft-UltrasoundGate 116H Recorded (#41163; Avisoft Bioacoustics, Berlin, Germany) with a sampling rate of 250 kHz. This was attached to a Dell Optiplex 960 Computer running Avisoft Recorder Software and a 16-bit condenser microphone (CM16, CMPA; Avisoft Bioacoustics, Berlin, Germany; 200 kHz maximum range). Following the one-hour interaction, mice were transferred to the holding chamber for 30 min to allow for optimal expression of c-Fos (Petersen et al., 2020), followed by perfusion with 4% paraformaldehyde in physiological saline. Brains were sectioned and immunohistochemically processed to label c-Fos, an immediate early gene product, and tryptophan hydroxylase (TPH), a synthetic enzyme for serotonin (see Figure 1, bottom, for experimental timeline).
Dominance testingDominance testing in pair-housed subjects and sham dominance testing were performed 1–2 days before behavioral trials and on the morning of behavioral trials to ensure consistency. To ascertain dominant versus subordinate status, cage mates were placed in an arena containing a tube wide enough for only one mouse to travel through it. Bedding from the cage of opposite-sex mice was placed in the bottom of the tube. Mice were simultaneously released at either side of the tube. The trial ended when one mouse (the subordinate) left the tube, or after 5 min had elapsed. Sham dominance testing was accomplished by placing single housed mice in the same apparatus, with their own bedding in the tube. This allowed for similar handling to the socially housed mice.
Measuring estrous phaseThe estrous stages of female subjects and social stimulus females were assigned by characterizing cells collected by vaginal lavage on the day of the behavioral trial (Hanson and Hurley, 2012). Following lavage, collected cells were smeared onto a glass slide and labeled with Giemsa stain. Presence of cornified epithelial cells or of both cornified and nucleated epithelial cells indicated proestrus or estrus, while the presence of leukocytes indicated diestrus (Goldman et al., 2007). Females in proestrus or estrus were combined into one group since receptive sexual behavior occurs in both of these stages, and females in metestrus and diestrus were similarly combined (Rodgers, 1970; Fitzroy Hardy, 1972). Estrous staging was additionally performed in the 3 days prior to behavioral trials to promote accurate staging.
ImmunohistochemistryFollowing the one-hour interaction, mice were transferred to the holding chamber for 30 min to allow for optimal expression of c-Fos (Petersen et al., 2020), followed by perfusion with 4% paraformaldehyde in physiological saline. Following perfusion in 4% paraformaldehyde solution, brains were postfixed overnight, then placed in 30% sucrose in phosphate-buffered saline (PBS) until equilibrated. Brains were embedded in Tissue Tek (Sakura Finetek USA, Torrance, CA) and cut at 50 μm thickness on a sliding freezing microtome (American Optical Company, Buffalo, NY). Sections were collected throughout the rostral-caudal extent of the DRN from ~ Bregma = 5.02 mm to ~ Bregma = 4.24 mm (Paxinos and Franklin, 2004). Sections were collected into cryoprotectant solution and stored in a freezer at −80°C until immunohistochemically labeled. Sections were thawed and rinsed in PBS for 5 × 5 min, then incubated for an hour in blocking solution of 10% donkey serum in PBS with 0.3% Triton X (PBSTx). After blocking, sections were incubated in antibodies to TPH (1:500 mouse monoclonal T0678, lot 069M4768V: Millipore-Sigma, Burlington, MA) and c-Fos (1,1,000 rabbit polyclonal 226,003, lot 9-89: Synaptic Systems, Goettingen, Germany) diluted in PBS with 5% donkey serum and 0.3% Triton X overnight on an orbital shaker at ~4°C. Sections were then rinsed in PBS with 5% donkey serum for 4 × 5 min and incubated with fluorescently labeled secondary antibodies (1,333 Alexa Fluor 488 donkey anti-rabbit, A21206, lot 2,229,195 and 1,200 Alexa Fluor 680 donkey anti-mouse, A10043, lot 2,165,747, Thermo-Fisher Scientific, Waltham, MA) in PBS with 5% donkey serum and 0.3% Triton X for 2 h, after which they were rinsed 3 × 10 min in PBS. Following the final rinse, sections were mounted in glass slides, coverslipped with ProLong Gold anti-fade mounting medium (Thermo-Fisher Scientific, Waltham, MA), and imaged. This process resulted in nuclei labeled for c-Fos and cell bodies labeled for TPH (Figure 2A). Controls for the c-Fos label consisted of omitting primary and pre-adsorbing the primary antibody by incubating it with antigenic peptide. c-Fos-labeled nuclei were not observable in control treatments.
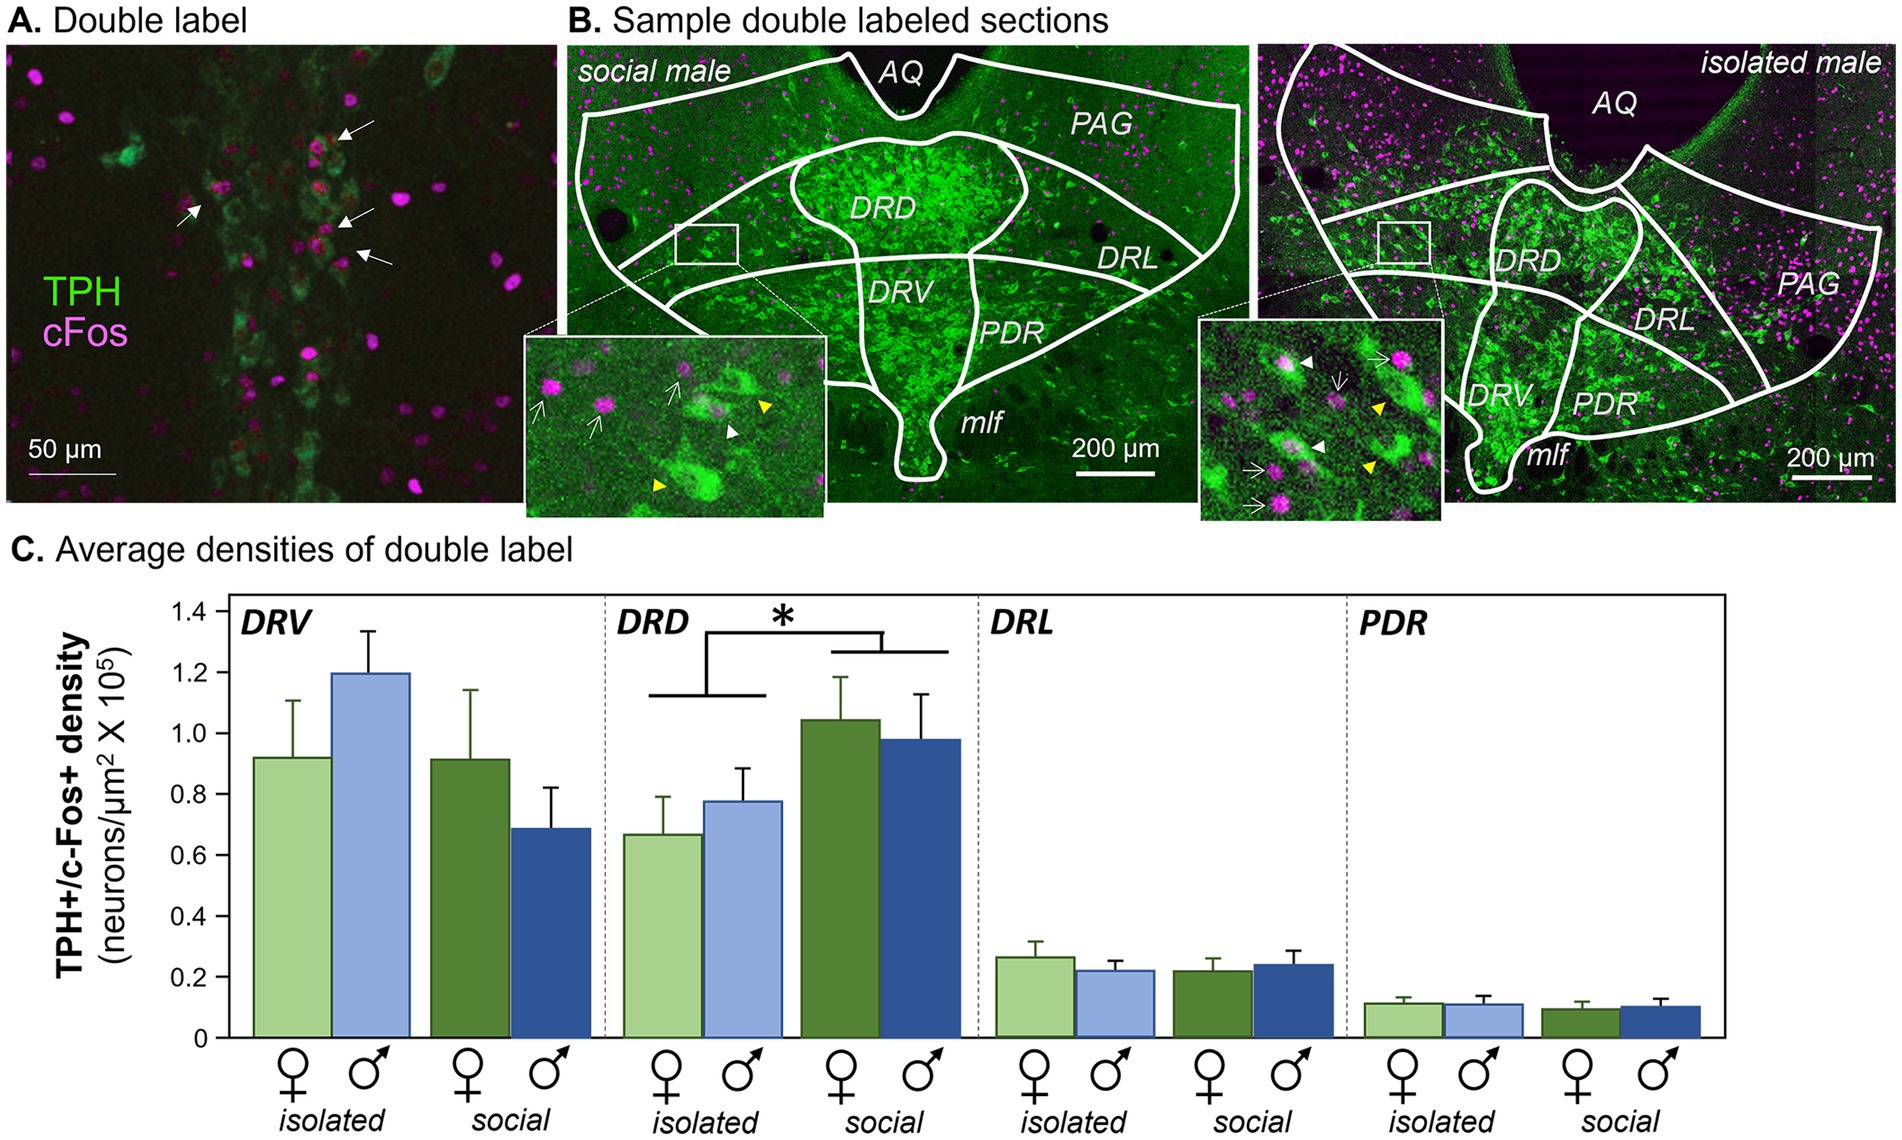
Figure 2. Antibody labeling. (A) Double label of antibodies to tryptophan hydroxylase (TPH) and cFos in the DRN. Arrows indicate neurons with both labels. (B) Sample images showing TPH label from each of the four subject groups. White arrowheads indicate double-labeled neurons. AQ, aqueduct; PAG, periaqueductal gray; DRD, dorsomedial dorsal raphe; DRV, dorsoventral dorsal raphe; DRL, dorsolateral dorsal raphe; PDR, posterodorsal raphe; MLF, median longitudinal fasciculus. Images have been enhanced in brightness and contrast for the figure. Insets: white arrowheads indicate double-labeled neurons, yellow arrowheads indicate neurons labeling for TPH but not c-Fos, and white arrows indicate c-Fos-labeled nuclei. (C) Densities of neurons labeled for antibodies to c-Fos and TPH in four subregions of the dorsal raphe nucleus. The four subject groups of individually versus socially housed females and males are represented for each subregion. *p < 0.05.
Image collectionSections were imaged at 10X on a Leica SP8 scanning confocal microscope in the Light Microscopy Imaging Center (LMIC) at Indiana University. Alexa Fluor 488 and 680 fluorophores were simultaneously excited using 488 and 680 nm laser lines. Twelve z planes separated by 2.41 um were collected through each section.
Image analysisImage stacks were pre-processed in FIJI to split the imaging channels and create merged projection images of the 12 z-planes. Cell nuclei positive for c-Fos (c-Fos+) were marked in ImageJ using a macro-based neurohistological analysis suite developed by Timothy and Forlano (2019) that identified c-Fos + nuclei in regions of interest based on a thresholding function. Regions of interest consisted of subregions of the DRN as described in Petersen et al. (2020). Briefly, boundaries for DRN subregions at specific rostrocaudal levels were derived from plates 73, 71, 68, and 66 the mouse brain atlas (Paxinos and Franklin, 2004). Boundary guides were fitted to match the chemoarchitecture of TPH-positive (TPH+) neurons relative to landmarks including the cerebral aqueduct and the median longitudinal fasciculi. Boundary diagrams were fitted to each section in Photoshop and superimposed on images in ImageJ to define regions of interest. DRN subregions for which ROIs were defined consisted of two densely clustered midline regions and two more dispersed lateral regions. The midline subregions were the dorsally located DRD (dorsal subnucleus of the dorsal raphe) and the ventrally located DRV (ventral subnucleus of the dorsal raphe). The lateral subregions were the DRL (dorsolateral subregion of the dorsal raphe), and the PDR (posterior-dorsal raphe subnucleus, located adjacent to the DRV).
After c-Fos + nuclei were identified and marked, images containing the locations of marked c-Fos + nuclei were imported to Photoshop for comparison with TPH+ cell bodies. Neurons were considered to be double-labeled if c-Fos + nuclei and darker regions within TPH+ neurons indicative of nuclei coincided. This estimation of double label was conducted manually because the high density and overlap of TPH+ neurons in midline subnuclei of the DRN make automation of this function difficult. Counts of double-labeled neurons across all sections within a specific subregion for a given subject were then normalized to the combined areas of the corresponding regions of interest to achieve an estimate of density. The numbers of TPH+ neurons were estimated by counting nuclei without label surrounded by cell bodies immunopositive for TPH. An average of 3.2 ± 0.12 sections per individual were analyzed. These ranged from 1 to 4 (1 section: n = 1; 2 sections: n = 5; 3 sections: n = 19; 4 sections: n = 15). Cell counts and areas from different sections were summed for specific DRN sections to obtain a single measure of density per individual per DRN subregion.
Behavioral measurementVocal and nonvocal behaviors were scored by researchers blind to the experimental groups of the subjects. Nonvocal behaviors were scored from video recordings of each interaction using Behavioral Observation Research Interactive Software (BORIS v. 7.13.6; Friard and Gamba, 2016). Behaviors were sampled in every other five-minute period, so that a total of 30 min of the one-hour interaction were scored. Technical issues prevented one video recording from saving in the isolated female group. Tails of mice were marked using nontoxic ink to clearly distinguish males from females during analysis. Five behaviors were scored in both sexes. Investigation was divided into nose-to-nose investigation, consisting of mutual facial exploration rostral to the eyes, and anogenital investigation, in which one mouse investigated the hindquarters of the other near the tail or under a rear leg. Grooming was defined as any time there was a back-and-forth motion of the mouse’s head on its fur, clear paw movement over its ears, pulling of tail or leg up, reaching around, and/or scratching. Rearing included any time the mouse was on its hind legs touching the wall with at least a 45-degree angle with one or two paws on the side of the cage. Digging was defined as any instance when the alternation of paws of the mouse caused the movement of bedding while there was no locomotion. Two behaviors were sex-specific. Mounting was defined as one individual grasping the other with its forelegs, often accompanied by pelvic thrusting. Only males showed this behavior. In contrast, only females kicked at males, usually following anogenital investigation by males. Kicks were often paired with BBVs, sudden darts and lunging after or before kicking, and were often performed from a curled posture. Durations and numbers of events were scored for digging, grooming, both types of investigation, and rearing, while the highly transient events of kicking and mounting were only scored as the number of events.
Vocal behavior was analyzed using Raven sound analysis software (Raven Pro 1.6). Spectrograms of the audio recordings were created and the male ultrasonic vocalizations (USVs) and female BBVs were counted. USVs were further separated into two categories. Nonharmonic USVs had single observable harmonics around 70 kHz, while harmonic USVs had prominent harmonics at higher and lower frequencies. Harmonic vocalizations are enriched around mounting and are sensitive to past social isolation (Hanson and Hurley, 2012; Keesom et al., 2017a).
Statistical analysisStatistics were performed with SPSS 29.0 (IBM, Armonk, NY). Densities of neurons double labeled for c-Fos and TPH were assessed across subregions of the DRN using a repeated measures General Linear Model with subregion as a within-subjects variable and social treatment and sex as between-subjects factors. There were no effects of dominance status on either densities of double labeled neurons (one-way ANOVAs, p > 0.5) or vocal behaviors (independent samples Kruskal-Wallis tests, p > 0.2 for all for either males or females). There were no effects of estrous phase of females or of the female partners of males on either densities of double labeled neurons (one-way ANOVAs, p > 0.2) or vocal behaviors (independent samples Kruskal-Wallis tests, p > 0.3 for all calls). Because of the lack of effect of dominance status and estrous phase on these measurements, these factors were not included in the final models.
Numbers of vocalizations were log transformed after adding one to each value. Even after this transformation, numbers of both types of USVs and BBVs were not normally distributed in all social treatment groups (Shapiro–Wilk tests, p < 0.05). Kruskal-Wallis tests were therefore performed to assess differences in the calls across treatment groups. To compare vocal behavior to the densities of double-labeled neurons, an analysis of covariance (ANCOVA) was performed on the ratios of harmonic to nonharmonic call number versus double-labeled neuron densities for the DRD, across the four subject groups. Using the ratios compensated for different baseline calling rates among males, and normalized the distribution of values. For the two social subject groups (male and female), vocalization values were the same, since these values came from the same interactions for male and female social pairs. Spearman’s correlations were used to assess correlations between harmonic and non-harmonic vocalization categories, and between vocalizations and non-vocal behaviors.
Because of non-normality in some nonvocal behaviors even when log transformed, independent Kruskal- Wallis tests were used to compare the total durations of nonvocal behaviors across the three social groups, and the Benjamini-Hochberg correction was used to adjust for multiple comparisons. Behaviors tested in this way were female and male digging, grooming, anogenital investigation, rearing, nose-to-nose investigation (the same values for both sexes), and male mounting and female kicking.
In order to compare nonvocal behaviors to the densities of double-labeled neurons in the DRN, we first reduced the dimensionality of the multiple nonvocal behaviors. Because of non-normal distributions of kicking and mounting, we used a categorical principal components analysis (CATPCA). Both male and female behaviors across all social treatment groups were incorporated into the CATPCA, since male and female behaviors may influence each other. This analysis was based on the numbers rather than durations of behaviors, to make measurements of kicking and mounting more comparable to other behaviors. Log transformed (log +1) counts for all behaviors except kicking and mounting were normally distributed (Shapiro-Wilks tests, p > 0.05), and these were coded as numerical variables. Numbers of kicks and mounts were not normally distributed (Shapiro-Wilks tests, p < 0.05), and were coded as categorical variables after adding one to each value. The object scores from dimension 1 and dimension 2 of the CATPCA were then compared to the densities of double labeled neurons within each of the four social treatment groups using Pearson’s correlations.
Results Social treatment, but not sex, affects c-Fos expression by serotonergic neuronsThe densities of serotonergic neurons expressing the immediate early gene product c-Fos following an opposite-sex interaction were assessed across four subject groups that differed in sex and social history. These groups were socially housed females (social females), females that were individually housed after weaning (isolated females), socially housed males (social males), and individually housed males (isolated males). During behavioral interactions, each of these types of subjects was placed with a socially housed partner of the opposite sex. Socially housed male and female subjects were paired with each other during the opposite-sex interaction. This created a total of three types of social treatment groups: isolated male subjects (with socially housed female partners that were not used for immunohistochemical studies), isolated female subjects (with socially housed male partners that were not used for immunohistochemical studies), and socially housed male and female subjects that were both used for immunohistochemical studies (Figure 1, top).
Densities of serotonergic neurons that expressed c-Fos following the social interaction, as seen in Figure 2A, were measured in four subregions of the dorsal raphe nucleus (Figure 2B): the midline dorsal subdivision (DRD), the midline ventral subdivision (DRV), the dorsolateral subdivision (DRL), and the posterodorsal subdivision (PDR). Across the four dorsal raphe subregions, there were significant differences in the densities of double-labeled neurons among the subregions themselves (repeated measures General Linear Model with subregion as a within-subjects variable and social treatment and sex as between-subjects factors: F(3, 32) = 49.881, p < 0.001). The two medial dorsal raphe regions had higher densities than the two more lateral subregions (Figure 2C). There was also an interaction between the subregion and social treatment (F(3, 33) = 5.970, p = 0.002), but no interactions between subregion and sex or among subregion, social treatment, and sex (p > 0.05). Within individual subregions, only the DRD showed a significant effect of social treatment on density (Least Significant Difference post hoc tests, p = 0.042 for the DRD, p > 0.05 for the DRV, DRL, and PDR). This analysis shows that social isolation affected the densities of serotonergic neurons expressing c-Fos, and this effect was only observed in the DRD subdivision, regardless of sex.
A similar trend was observed when the percentages of double-labeled neurons relative to the total numbers of TPH-labeled neurons were used rather than neuron density. There was a significant effect of subregion, with the midline divisions having a higher percentage of double-labeled neurons (repeated measures General Linear Model with subregion as a within-subjects variable and social treatment and sex as between-subjects factors: F(3, 33) = 30.161, p < 0.001). There was also an interaction between the subregion and social treatment (F(3, 33) = 5.411, p = 0.004), but no interactions between subregion and sex or among subregion, social treatment, and sex (p > 0.1). Although no individual DRN subregion showed a significant effect of social treatment, there was a strong trend in the DRD (Least Significant Difference post hoc test, p = 0.055), but not for other regions (p > 0.2 for the DRL, DRV, and PDR). Counts of all c-Fos + neurons regardless of serotonergic status differed among subregions (repeated measures General Linear Model with subregion as a within-subjects variable and social treatment and sex as between-subjects factors: F(3, 33) = 28.707, p < 0.001), but there were no effects of social treatment, sex, or the interaction of these factors (p > 0.1 for these comparisons). Overall, the general patterns of differences between socially housed and isolated individuals were similar for measurements of both the density and relative percentage of serotonergic neurons expressing c-Fos.
These differences due to social treatment were not attributable to differences in the numbers of TPH+ neurons. Numbers of TPH+ neurons did show an effect of DRN subregion (repeated measures General Linear Model with subregion as a within-subjects variable and social treatment and sex as between-subjects factors: F(3, 33) = 99.952, p < 0.001), and also an interaction between subregion and social treatment (F(3, 33) = 2.963, p = 0.046). However, the only subregion showing an effect of social treatment on the number of TPH+ neurons was the DRV (Least Significant Difference post hoc test, p = 0.003), not the DRD or other subregions (p > 0.1). The number of TPH+ neurons also showed an interaction between subregion, sex, and social treatment (F(3, 33) = 4.09, p = 0.014). This arose from significantly lower numbers of TPH+ neurons for females relative to males in the DRD and DRV subregions, but only in the isolated social treatment groups (Supplementary Figure S1A, Least Significant Difference post hoc test, p = 0.017 for isolated females versus males in the DRD and p = 0.042 for isolated females versus males in the DRV). There were no sex differences in any other subregions or social treatment groups (p > 0.2 for all other comparisons). This sex difference was likely due to an increased number of TPH+ neurons seen in isolated males but not females, only in the DRD and DRV subregions (Supplementary Figure S1B, Least Significant Difference post hoc test, p = 0.039 for isolated versus social males in the DRD and p < 0.001 for isolated versus social males in the DRV). Thus, although numbers of TPH+ neurons were affected by social treatment and sex, these differences had no direct parallels in the effects of social treatment on the densities or percentages of double labeled neurons across social groups and subregions.
Because serotonergic and non-serotonergic neurons are interconnected in the DRN (e.g., Rood and Beck, 2014), we also compared the ratios of double-labeled neurons in different subregions to the total numbers of c-Fos-positive nuclei. In this analysis, there were also differences among DRN subregions (repeated measures General Linear Model with subregion as a within-subjects variable and social treatment and sex as between-subjects factors: F(3, 33) = 135.047, p < 0.001), and an interaction between the subregion and social treatment (F(3, 33) = 5.662, p = 0.003). However, in post hoc analysis, the only significant difference between socially housed and isolated groups was for the DRV subregion (Least Significant Difference post hoc test, p = 0.006), but not for other regions (p > 0.1 for the DRD, DRL, and PDR). In contrast to other measures of c-Fos activity, the values for socially housed mice were lower than for isolated mice (Supplementary Figure S2). This suggests that relatively fewer serotonergic neurons than non-serotonergic neurons in the DRV express c-Fos following social interaction in socially housed mice compared to isolated mice.
There were no effects of male dominance status (one-way ANOVA, n = 5 dominant and 5 subordinate individuals, F(1, 9) = 10.41, p = 0.532) or female dominance status (one-way ANOVA, n = 5 dominant and 5 subordinate individuals, F(1, 9) = 4.34, p = 0.665) on double-labeled neuron density in the DRD. There were also no effects of the estrous phase of females (one-way ANOVA, n = 10 in diestrus/metestrus and 9 in estrus/proestrus, F(1, 18) = 0.02, p = 0.89) or of the estrous phase of female partners of males (one-way ANOVA, n = 11 in diestrus/metestrus and 8 in estrus/proestrus, F(1, 18) = 1.76, p = 0.203).
Social treatment affects vocal behaviorTwo classes of vocal behaviors were recorded during opposite-sex social interactions. Ultrasonic vocalizations (USVs) are produced predominantly by males during opposite-sex interaction, although females produce a minority of these calls (Neunuebel et al., 2015; Sterling et al., 2023). We divided USVs into two additional categories: “harmonic” USVs, and “non-harmonic” USVs. As the name suggests, harmonic USVs show prominent harmonics at around 40 and 60–80 kHz, while non-harmonic USVs show a single harmonic at around 70 kHz (Figure 3A, right). Harmonic USVs are enriched in the times around male mounting behavior (Hanson and Hurley, 2012). We also measured broadband vocalizations (BBVs), which are human-audible calls with pronounced harmonic structure, also called low frequency harmonic calls (LFHs: Grimsley et al., 2013) or squeaks (Figure 3A, left). BBVs are produced by females in several contexts, including when females direct kicks and lunges at males, and when females are being mounted by males (White et al., 1998; Wang et al., 2008; Sugimoto et al., 2011; Finton et al., 2017). The production of calls was measured across the three social treatment groups.
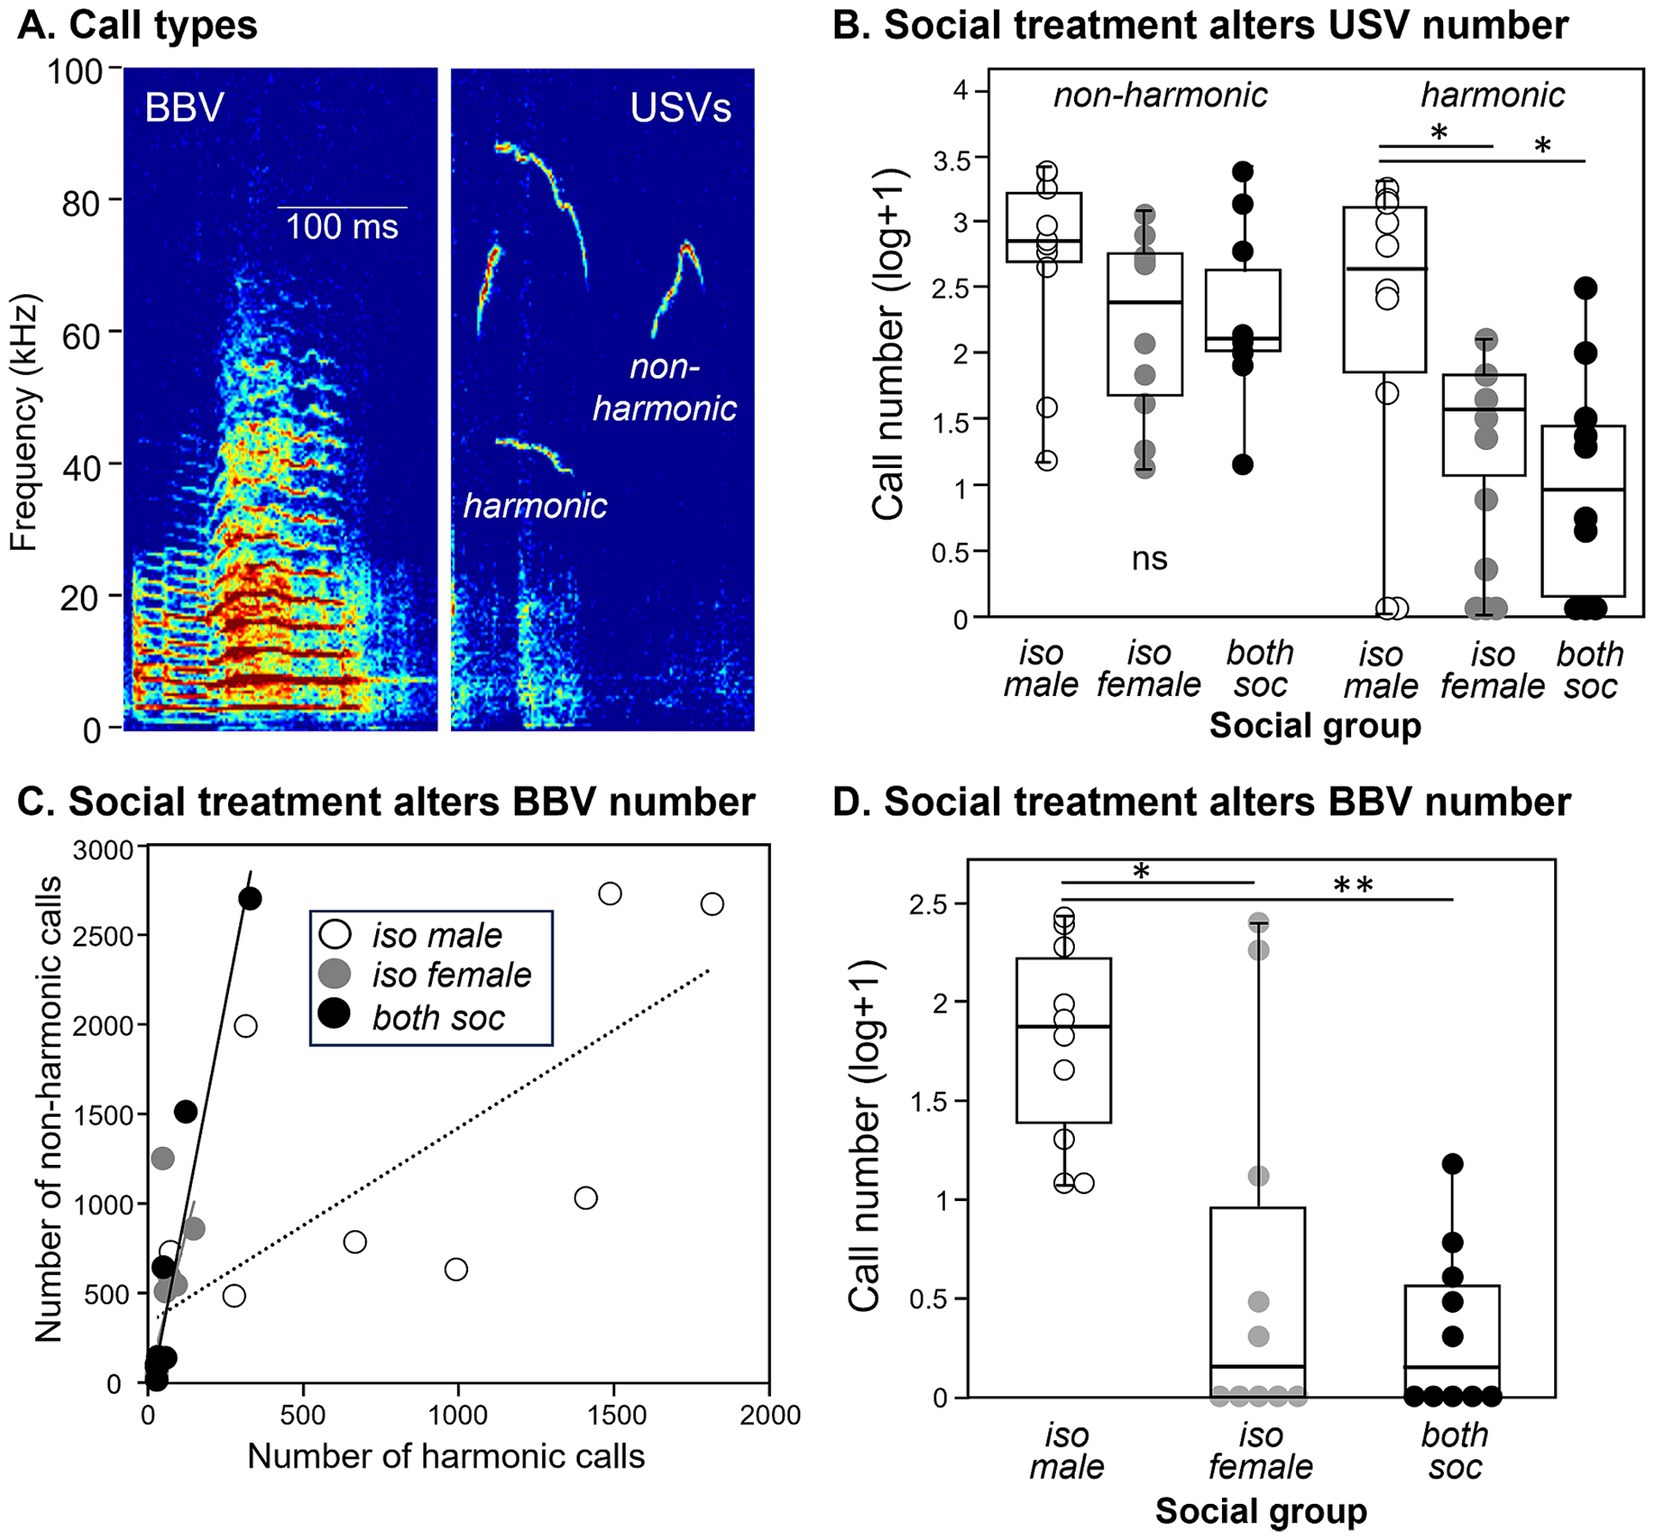
Figure 3. Differences in calls across the three different social groups. (A) Spectrograms showing examples of a BBV (left) and harmonic and non- harmonic USVs (right). (B) The numbers of harmonic USVs, but not non-harmonic USVs, are higher in groups with individually housed males. Values are shown as log transformations to better compare call types. (C) Numbers of harmonic versus nonharmonic USVs are correlated in the three social groups. Harmonic and nonharmonic calls are significantly correlated in all groups. (D) The numbers of BBVs are higher in groups with individually housed males. Identical values are slightly displaced from each other to distinguish all measurements. *p < 0.05; **p < 0.001.
Call production depended on social treatment and call type. The number of non-harmonic USVs did not vary among treatment groups (Figure 3B, left; independent samples Kruskal-Wallis test, H (2) = 3.089, p = 0.213). In contrast, harmonic USVs varied significantly across the three social treatment groups (Figure 3B, right; independent samples Kruskal-Wallis test, H (2) = 7.102, p = 0.029), with the isolated male social group producing higher numbers of harmonic calls than the isolated female group (p = 0.021) or the social group (p = 0.021). This demonstrates that the social housing treatment specifically influenced the production of harmonic but not non-harmonic USVs, with the isolated male social group highest in the number of harmonic USVs. Numbers of harmonic and nonharmonic USVs correlated with each other within each group (Spearman correlations, isolated male group: rs = 0.839, p = 0.002, isolated female group: rs = 0.853, p = 0.002, social group: rs = 0.926, p < 0.001), although the proportion of harmonics was higher in the male isolated group than the other groups (Figure 3C). The number of female-produced BBVs were also different across the three social treatment groups (Kruskal-Wallis test, H (2) = 13.223, p = 0.001), with a larger number of BBVs in the isolated male social group than in the isolated female group (p = 0.015) or the social group (p = 0.002; Figure 3D).
The numbers of total USVs were not affected by male dominance status (independent samples Kruskal-Wallis test, n = 10 dominant and 10 subordinate individuals, H (2) = 1.46, p = 0.23) or by female dominance status (independent samples Kruskal-Wallis test, n = 10 dominant and 10 subordinate individuals, H (2) = 0.21, p = 0.65). Total USV numbers were also not affected by the estrous phases of females (independent samples Kruskal-Wallis test, n = 10 in diestrus/metestrus and 9 in estrus/proestrus, H (2) = 0.027, p = 0.87) or by the estrous phases of female partners of males (independent samples Kruskal-Wallis test, n = 11 in diestrus/metestrus and 8 in estrus/proestrus, H (2) = 0.825, p = 0.364).
Vocal production correlates with DRD density for isolated but not socially housed malesWe have previously observed correlations between communication behavior and serotonergic activity (Keesom and Hurley, 2016), so we compared densities of double-labeled neurons in the DRN with the production of USVs. We used the ratio of harmonic to non-harmonic calls as a metric to account for variation in overall calling rate among males in order to normalize for different overall calling rates among individuals. A significant correlation only occurred for the DRD subregion. There was a main effect of subject type on harmonic ratio (ANCOVA, F(3, 32) = 18.82, p < 0.001), with the highest harmonic ratio seen for isolated males. There was also a significant correlation of the harmonic ratio with the density of double-labeled neurons (F(1, 32) = 10.88, p = 0.002). Finally, there was an interaction between DRD density and subject type (F(3, 32) = 9.72, p < 0.001), suggesting different relationships between DRD density and call ratio among groups. To follow up on this, Pearson’s correlations were performed for each subject group, showing that the isolated male group showed an inverse correlation between DRD density and call ratio (Figure 4A: r = −0.734, p = 0.016), but the other types of subjects did not (Figures 4B–D: isolated females: r = 0.014, p = 0.969; social males: r = 0.374, p = 0.287; isolated females: r = −0.203, p = 0.574). The three subregions of the DRN other than the DRD did not show significant covariation between harmonic ratio and neuron density, or interactions between neuron density and subject groups, although the PDR and DRV showed differences in harmonic ratio among subject groups due to isolated males producing proportionally more harmonic calls (Table 1).
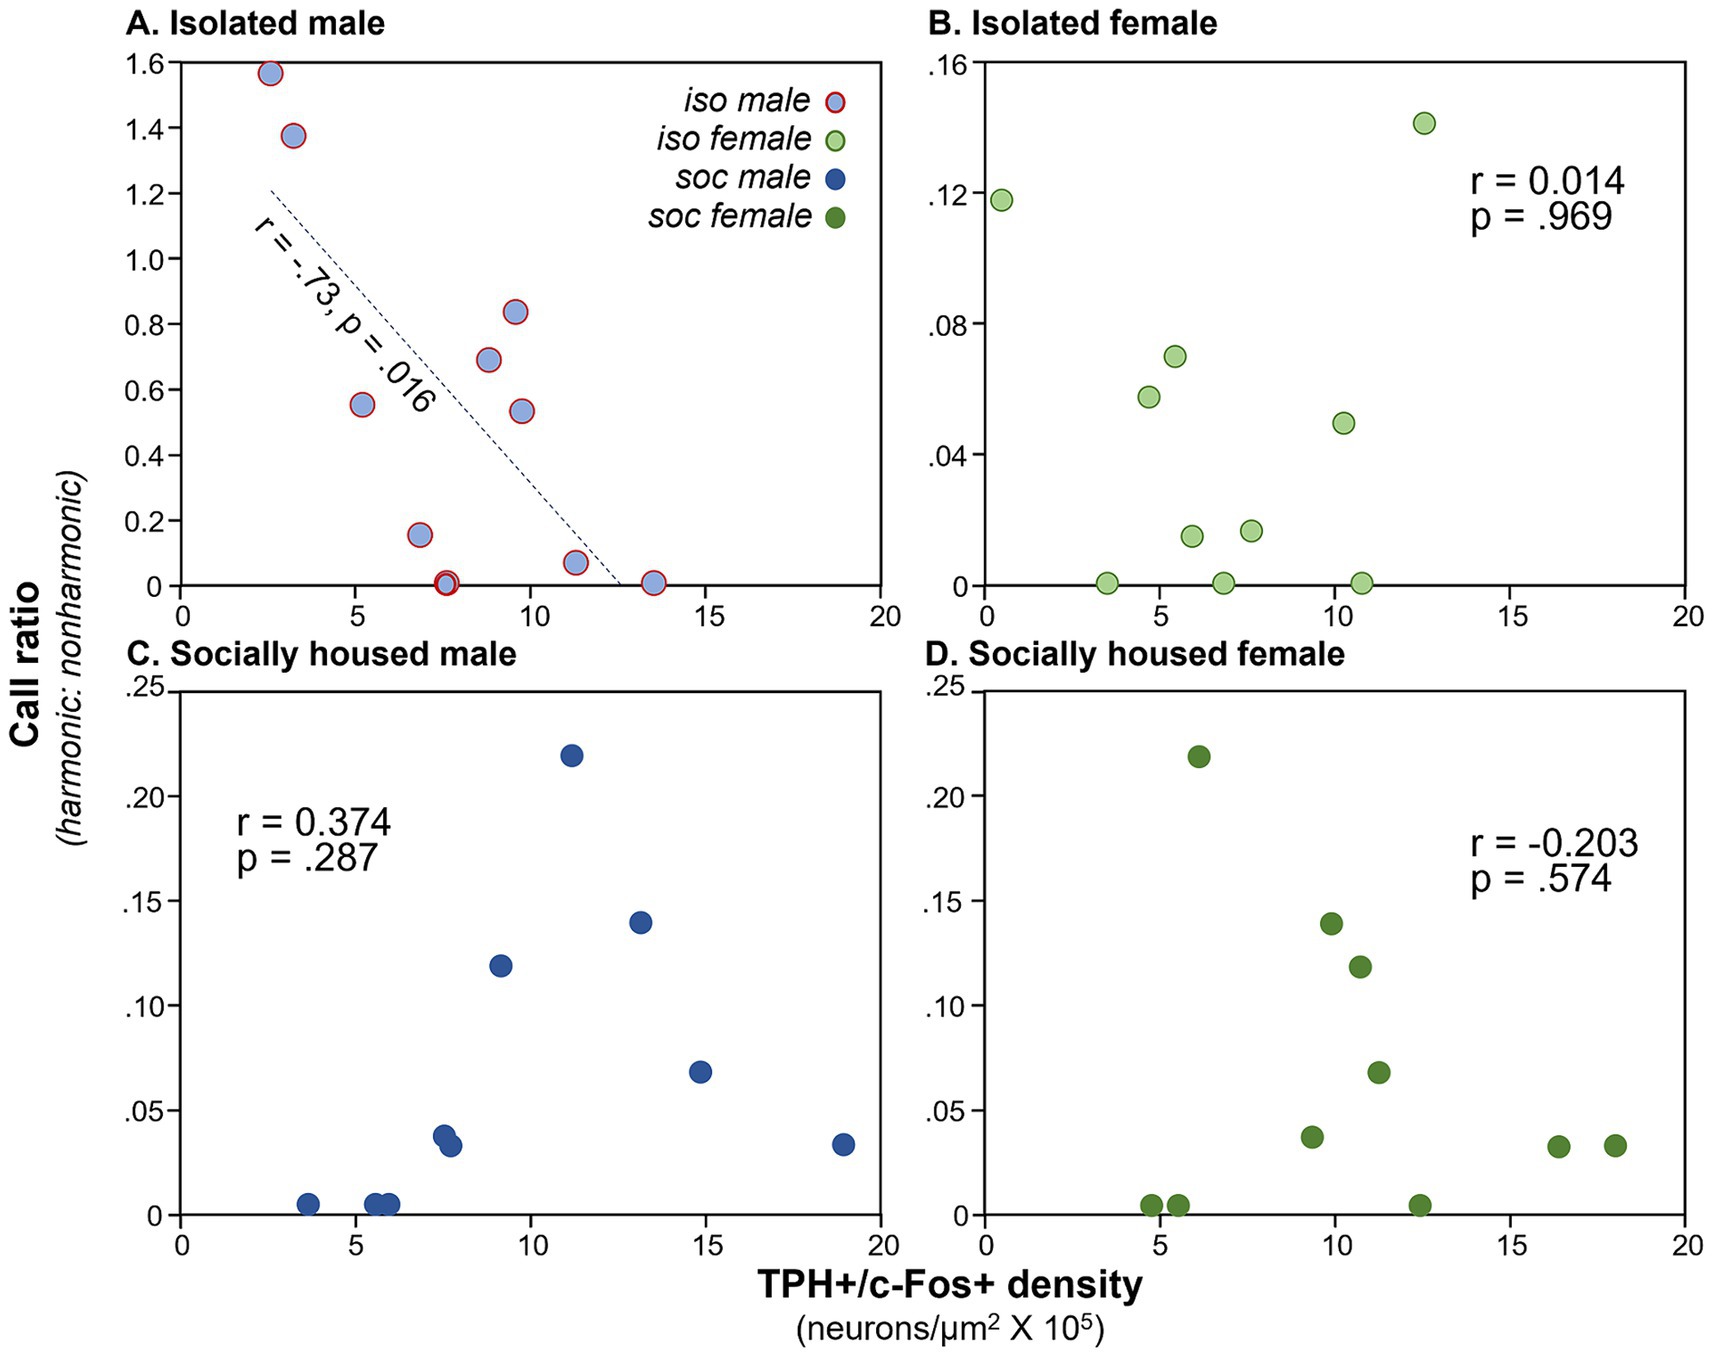
Figure 4. Plots of call ratio (numbers of harmonic/non-harmonic calls) for the four subject groups versus numbers of neurons expressing the double label, across individual mice. (A) Isolated males, (B) isolated females, (C) social males, and (D) social females (dark green). Note the difference in Y-axis values across groups. Y-axis values for groups (C,D) are the same for individual males and females that were in the same social interaction.
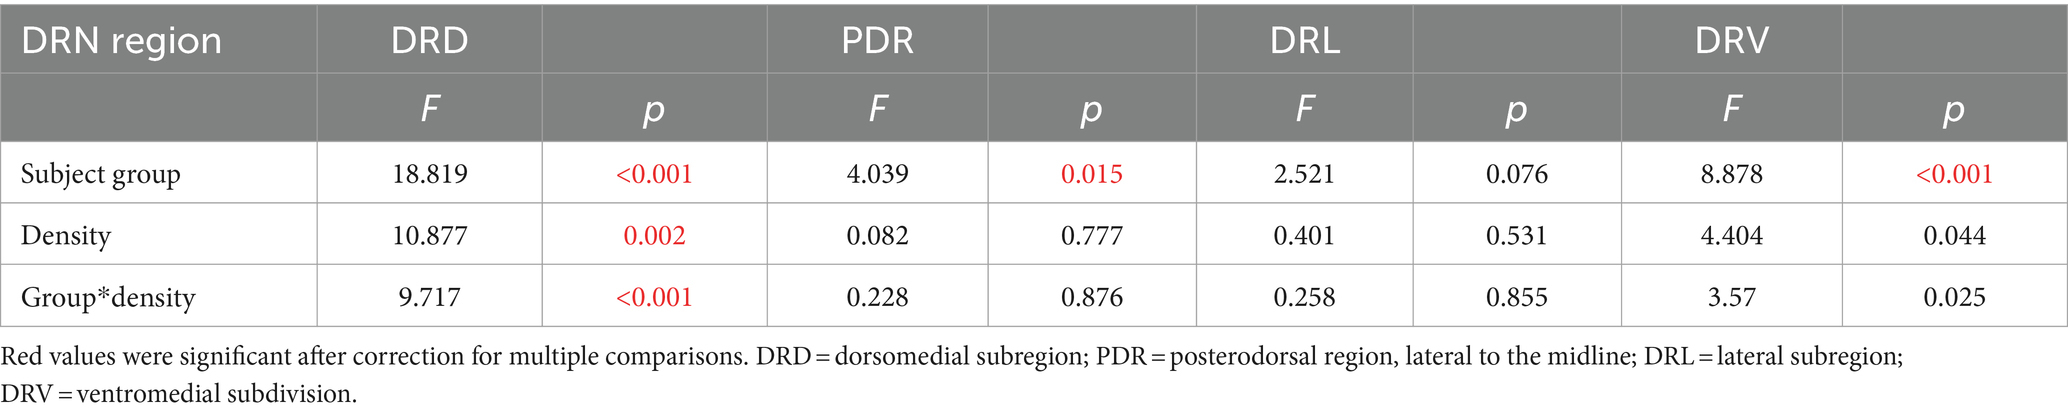
Table 1. Results of ANCOVAs comparing harmonic ratios across subject groups with the densities of double-labeled neurons as a covariate for different DRN (dorsal raphe nucleus) subregions.
Non-vocal behaviors change with social treatmentIn addition to vocal behaviors, we measured non-vocal behaviors: the duration of digging, grooming and rearing, and the social behaviors of nose-to-nose investigation and anogenital investigation. We also measured the numbers of two sex-biased behaviors: mounting by males and kicking by females. Suites of male and female behaviors varied across the three social treatment groups. Qualitatively, the isolated male/social female group was characterized by relatively high levels of anogenital investigation by males, mounting by males, and kicking by females (Figure 5, left column). Even higher levels of female kicking occurred in the isolated female/social male group, although no mounting and relatively little male anogenital investigation were observed (Figure 5, middle column). In the all-social group, little kicking or mounting occurred (Figure 5, right column). Non-vocal behaviors correlated with vocal behaviors (Spearman’s correlations, Supplementary Table S1). Both classes of USV correlated with mounting and anogenital investigation by males, and BBVs correlated positively with mounting and kicks by females, and negatively with digging by males. These correlations support previous findings of vocal signals during opposite-interaction being related to sexual behavior, or responses to sexual behavior.
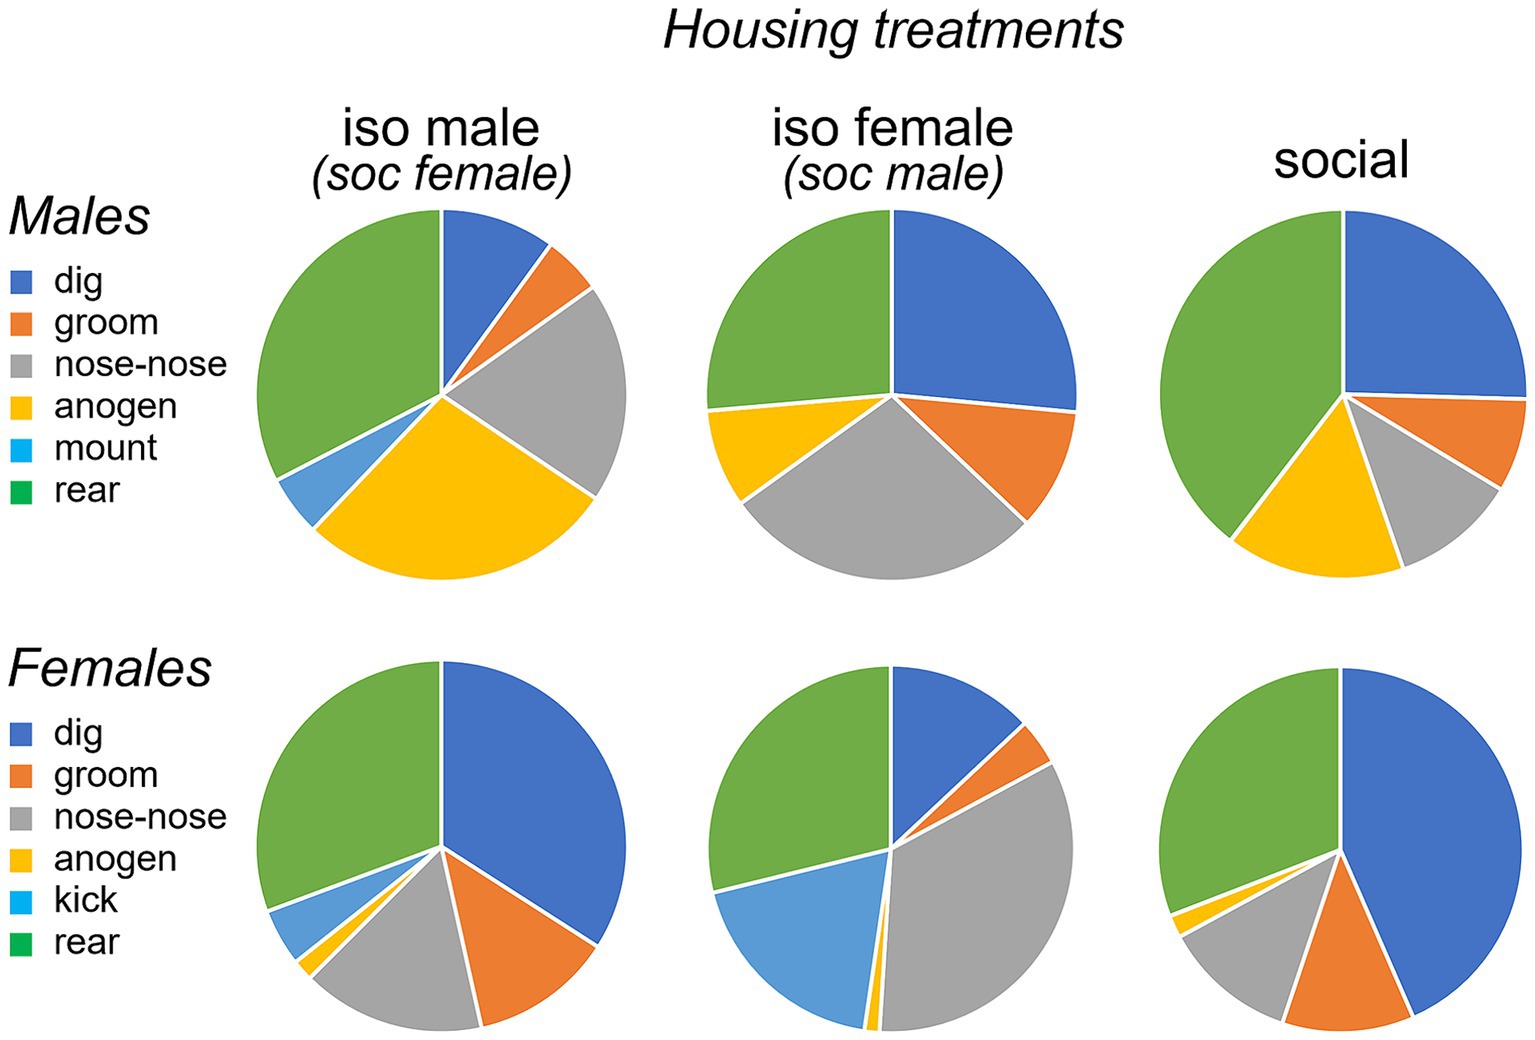
Figure 5. Pie charts showing proportions of time spent performing different behaviors by males (top row) and females (bottom row) during an opposite-sex social interaction. The three social treatment conditions of isolated males (left), isolated females (middle) and socially housed males and females (right) are shown. Females in the isolated male treatment and males in the isolated female treatment were socially housed. “nose-nose” = nose-to-nose investigation; “anogen” = anogenital investigation.
Quantitatively, there was significant variation among social treatment groups for some behaviors in males (Table 2). Among the measured behaviors, digging and mounting were different among social treatment groups (independent samples Kruskal-Wallis test; digging: H (2) = 17.871, p < 0.001; mounting: H (2) = 14.256, p < 0.001). Isolated males dug less than socially housed males in the other two groups (Figure 6A, left; p < 0.001 versus isolated female group, p = 0.005 for social group). In contrast, isolated males mounted more than the other two groups (Figure 6A, right; p < 0.001 versus isolated female group, p = 0.002 versus social group). Male anogenital investigation was not significantly different among groups after correction for multiple comparisons.
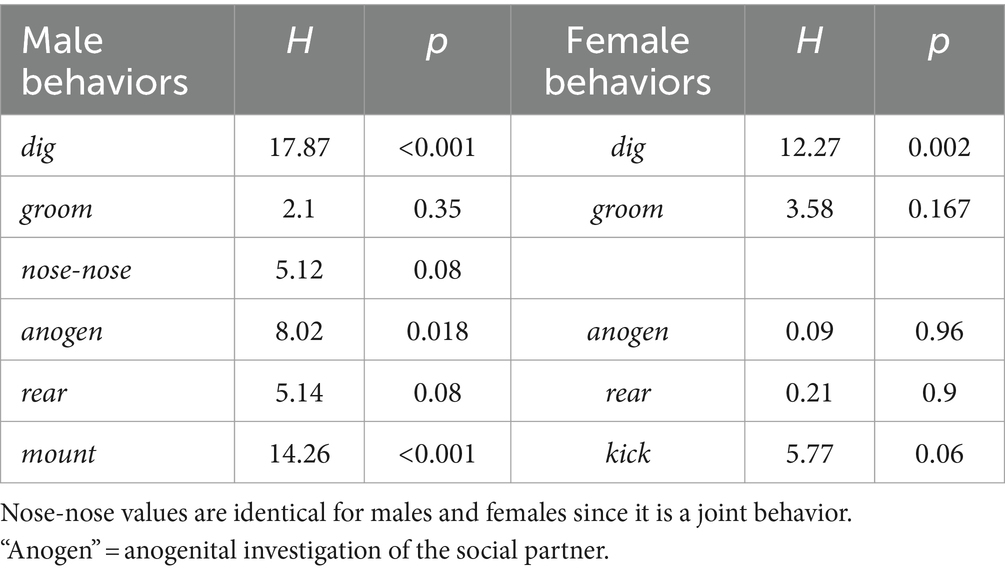
Table 2. Results of Kruskal-Wallis tests for behavioral differences among social interaction groups.
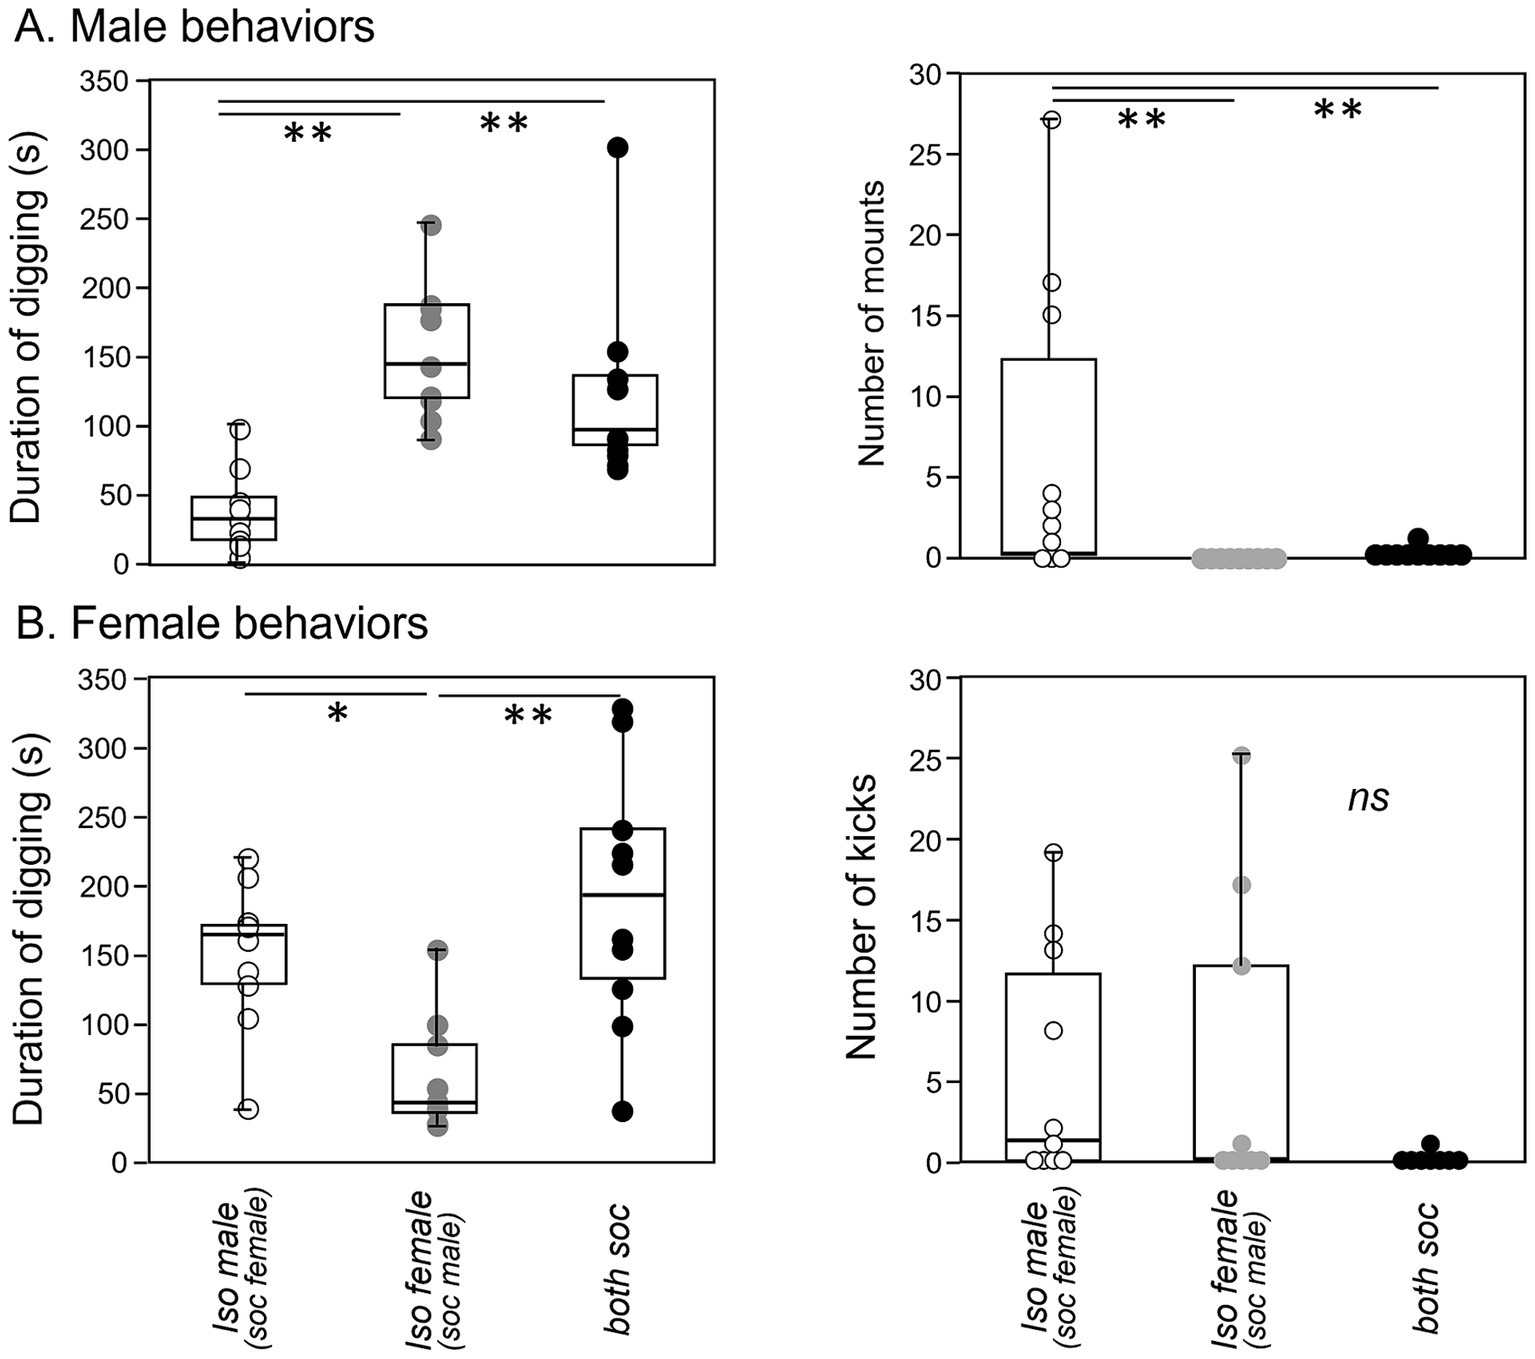
Figure 6. Box-and-whiskers plots of behaviors shown by males and females during an opposite-sex social interaction. (A) Isolated males show a lower total duration of digging (left panel) and a higher number of mounts (right panel) than the socially housed males in the other two treatment groups. (B) Isolated females also show a lower total duration of digging (left panel) than the socially housed females in the other treatment groups. Although numbers of kicks by females are higher in both of the isolated groups than the social group (right panel), this difference is not significant. *p value of less than 0.05, **p value of less than 0.01.
For females, the only behavior that differed significantly among groups was digging (Figure 6B, left, Table 2, independent samples Kruskal-Wallis test; digging: H (2) = 12.273, p = 0.002). Similar to males, the group with an isolated female showed reduced digging relative to the other two groups (p = 0.007 versus isolated male group, p < 0.001 versus social group). Although kicking occurred in a higher number of females in the isolated male-social female and isolated female- social male groups, this difference was not significant, although it showed a strong trend (Figure 6B, right; Kruskal-Wallis test, H (2) = 5.765, p = 0.056).
Non-vocal behaviors correlate with DRD activityTo assess whether non-social behaviors correspond to c-Fos activity of serotonergic neurons, we reduced the dimensionality of all non-vocal behaviors measured for both males and females with a principal components analysis. To more closely compare all behaviors including kicking and mounting, the numbers of all behaviors were used as variables. Because kicking and mounting were not normally distributed even when transformed, we performed a categorical principal components analysis, in which some variables were continuous and some were categorical. To do this, the behaviors of digging, grooming, rearing, and anogenital investigation were log transformed, creating normal distributions, and were coded as continuous variables. Numbers of kicks and mounts were coded as categorical/ordinal variables. The first two dimensions of the extraction accounted for 47.83% of the variation in behaviors. A scatterplot of these first two dimensions of the analysis shows the isolated male group (open circles blue outline) and the isolated female group (open circles gray outline) as the most distinct, with the social treatment group (gray circles) in the middle (Figure 7A). Table 3 shows how different behaviors loaded onto Dimension 1 and Dimension 2. Factors that loaded strongly onto Dimension 1 were male digging (“mdig” negatively loading), nose-to-nose investigation (“inn”), anogenital investigation of females by males (“miag”), mounting (“mount”), and female digging (“fdig”). Dimension 1 thus corresponded to male sexual interest. Factors that loaded strongly onto dimension 2 were male rearing (“mrear”), female anogenital investigation (“fiag”, negatively loading), and female kicking (“kick”).
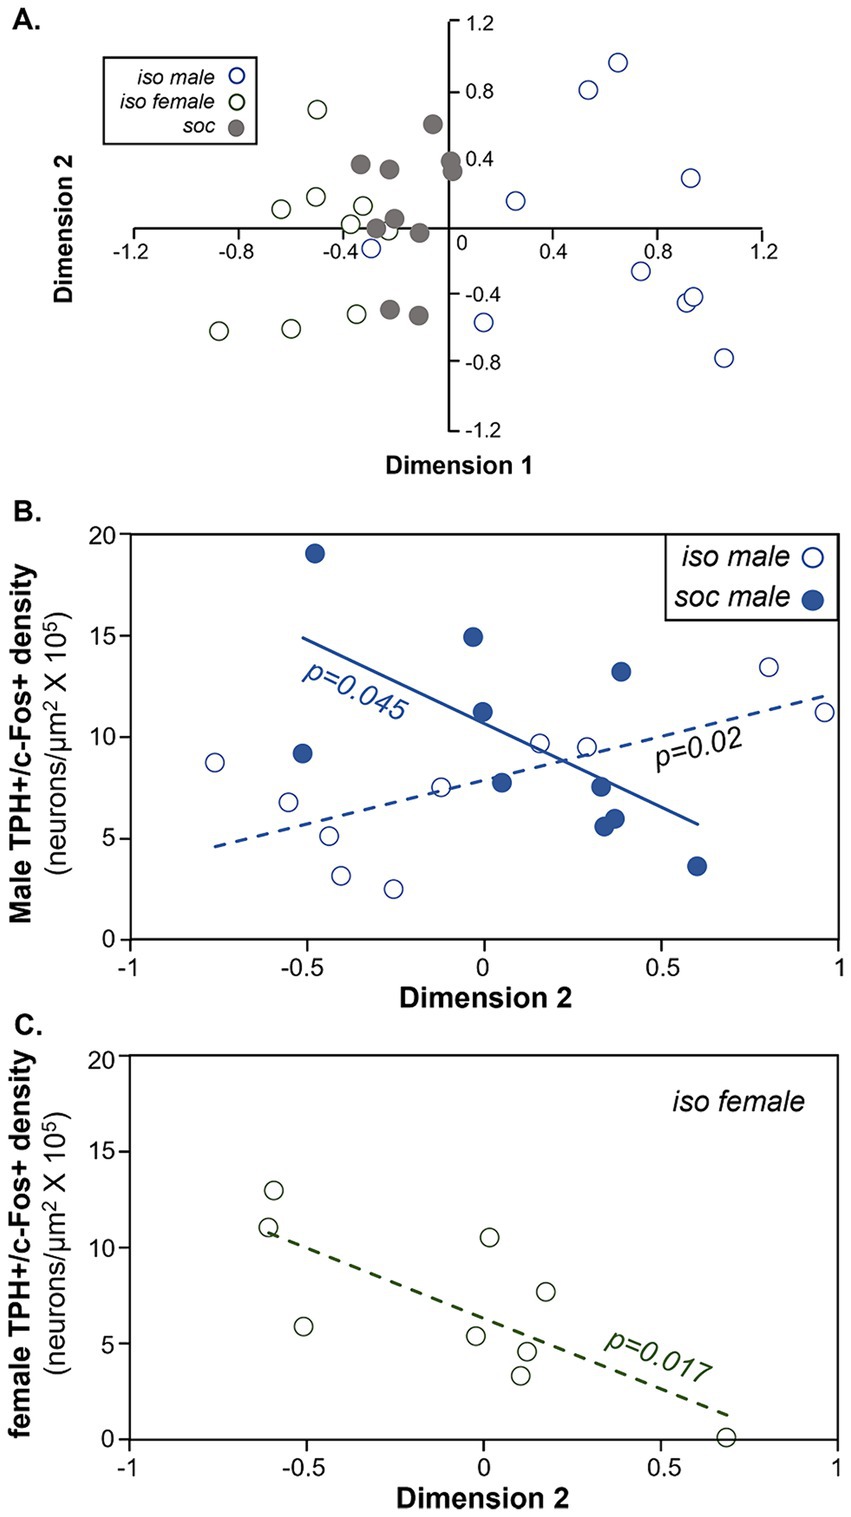
Figure 7. Comparison of the density of double labeled neurons in the DRD and behavior during the social interaction. (A) Plot of the first versus second dimensions of a categorical PCA of males and female behaviors. Open blue circles = the isolated male group. Open gray circles = the isolated female group. Filled gray circles = the social group. (B) Comparison of the densities of double-labeled neurons in the DRD versus dimension 2 scores of the categorical PCA in males. Values correlate positively across isolated males (open circles) but negatively across socially housed males (closed circles). (C) Comparison of the densities of double-labeled neurons in the DRD versus dimension 2 scores of the categorical PCA in females. Values are negatively correlated in isolated females.
留言 (0)