
記住我

The most important breakthrough in cancer immunotherapy to date has been the development of immune checkpoint inhibitors (ICI), also referred as immune checkpoint blockers (ICB), initially with the pharmacological blockade of the interaction between cytotoxic T lymphocyte-associated antigen 4 (CTLA-4) and CD28, and soon followed by the blockade of programmed cell death 1 receptor (PD-1) with its ligand PD-L1 and PD-L2; progress with other ICIs has recently been reviewed by Sharma (1).
Immune checkpoint therapy (ICT) with ICI has successfully been extended to almost 20 cancer types, with PD-1 blockade showing the highest level of anti-tumor activity. Metastatic melanoma is the most responsive tumor type for ICT, with about 17% responding to anti-PD-1 antibody, about 27% responding to anti-CTLA-4 antibody, and about 55% responding to their combined therapy (2). Overall, about 10% of treated cancer patients respond to PD-1 blockade.
CXCR3 is a chemokine receptor with 3 ligands, CXCL9, CXCL10 and CXCL11. CXCL9 and CXCL10 bind a similar site on CXCR3, differing from that of CXCL11 (3). CXCR3 is primarily expressed on CD4+ and CD8+ T cells, and to some extent by certain dendritic cells (DC) (4), macrophages (5), NK cells (6–8), and epithelial cells (9). Within the CD4+ subset, CXCR3 is mostly highly expressed on effector T cells, and a small portion of FOXp3+ regulatory T cells (Tregs). Thus, it is also associated with Tregs migration, including into tumors (10–12).
In numerous cancers, among them melanoma, non-small cell lung cancer (NSCLC), ovarian cancer, gastric cancer, and colorectal cancer, high CXCL9/CXCL10 levels indicate favorable prognosis, and low levels indicate poor prognosis (13–19). Moreover, melanoma patients who express low levels of CXCL9 or CXCL10 (either blood or tumor site) are poor responders to ICT, and those with high levels of CXCL9 or CXCL10 respond more favorably (18, 19). Likewise, NSCLC patients with high plasma levels of CXCL9 and CXCL10 displayed better responses to anti-PD-1 or anti-PD-L1 therapies (13). Specifically for CXCL9, Seitz et al. reported that CXCL9 inhibits tumor growth and drives anti-PD-L1 therapy in ovarian cancer (20) and that CXCL9 could be a potential biomarker of immune infiltration associated with favorable prognosis in estrogen receptor-negative breast cancer (21).
What may explain the association between CXCL9 and CXCL10 expression and cancer prognosis, as well as the response to ICT? Based on studies from different laboratories including ours, it was suggested that CXCL10, and possibly CXCL9, are not only associated with the migration of T cells, but also with directing their biological functions (22–27). We suggest that a combined function of targeted migration and directional polarization of CD4+ and CD8+ T cells account for the driver role of CXCR3 and its ligands in the immune rejection of tumors and responsiveness to ICT (28–30). Of these ligands, CXCL11 may differ from the other two by its ability to skew effector T cells into FOXp3-negative T regulatory-1-like cells (27).
The working hypothesis of the current manuscript is that the CXCR3-CXCL9/10 axis is a key driver of effector and cytotoxic CD4+ and CD8+ T cell function and that this axis maintains a self-feeding amplification loop in which the interaction of CXCL9 and CXCL10 with CXCR3 induces different subtypes of effector and cytotoxic CD4+ and CD8+ T cells with an IFNγ signature; since CXCL10 is IFNγ inducible (31, 32), high levels of IFNγ then further induces CXCL10 production, not only by T cells but also by cancer cells, thus reinforcing the loop. This positive feedback loop is likely to be regulated by CTLA-4 and PD-1 as key checkpoints. Here, using 3-D spheroids and CD8+ T cells we show that blockade of PD-1 or CTLA-4 further activates this loop. This effect may explain why melanoma and NSCLC patients that are CXCL9/10low are poor responders to ICT, and perhaps that they could be potential candidates to combined therapies with ICT + CXCL9-Fc or CXCL10-Fc.
ResultsImmune checkpoint inhibition is CXCR3 dependentThe response to anti-PD-1 and anti-CTLA-4 ICT in wild-type (WT) and CXCR3KO mice has been evaluated using the Ret transgenic mouse model, a skin malignant melanoma model that is characterized by the overexpression of the human Ret transgene in melanin-expressing cells (33). These transgenic mice spontaneously develop skin tumors with metastases to lymph nodes, lungs, liver, brain, and bone marrow (33). A low passage pre-line that was isolated from these mice (34) and then subjected to overexpression of mCherry (35), was used in the study. This serves as a reliable model for autotropic melanoma, with clear metastatic spread (34, 35).
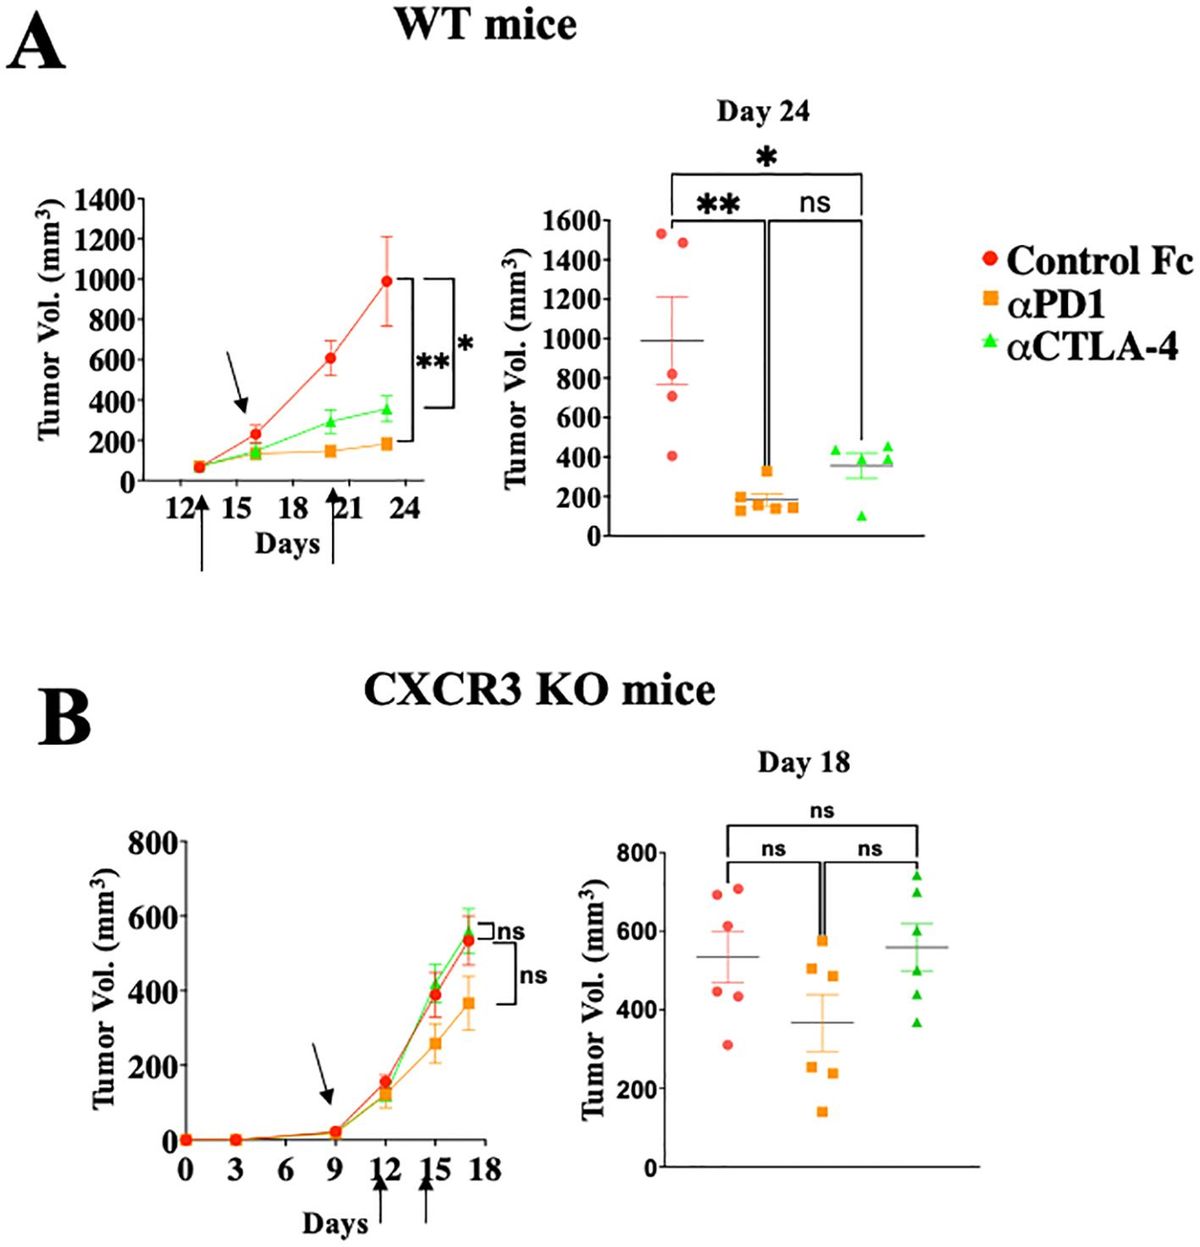
Figures 1A, B shows that WT mice engrafted with Ret melanoma display strong antitumor responses to blockade of either PD-1 or CTLA-4 (Figure 1A; P<0.05 for CTLA-4 and P<0.01 for PD-1 blockade), whereas these effects were much reduced in CXCR3 KO mice (Figure 1B). From the translational perspective, the findings that CXCL10lhigh/CXCL9high patients display less severe forms of several types of cancer (13–19), and that melanoma patients who are CXCL10Lhigh and/or CXCL9high tend to respond well to anti-PD-1 therapy (18, 19), suggests that the major role of the PD-1 and CTLA-4 axes is to regulate the CXCR3-CXCL9/CXCL10 interplay. This subject is further discussed below.
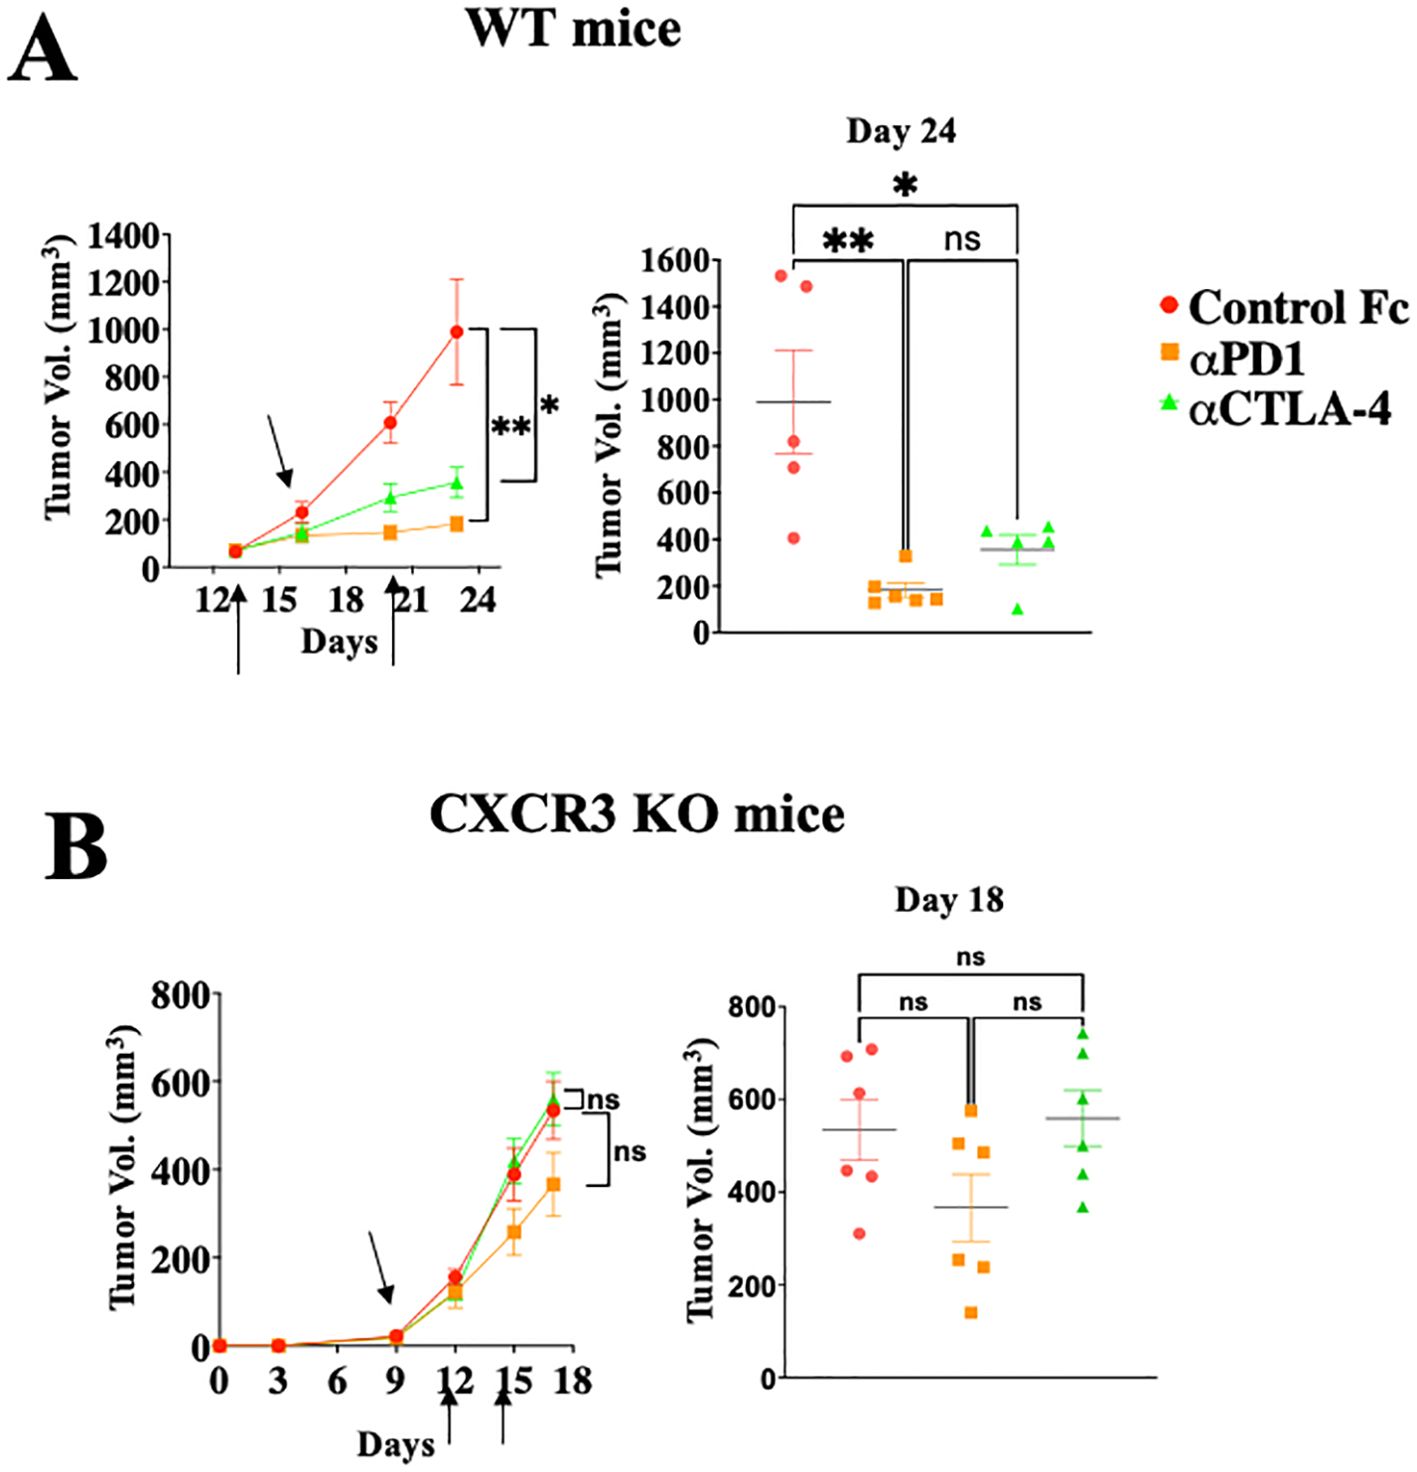
Figure 1. Immune checkpoint inhibition is CXCR3 dependent. WT (A) or CXCR3KO (B) mice were orthotopically injected with 0.4x10⁶ret melanoma cells. When tumor size reached about 50 mm3, they were separated into three identical groups of six mice each. Each group was treated three times, in 3–4-day intervals with 100µg/mouse αPD-1 or αCTLA-4 or isotype-matched control IgG. Tumor volumes were recorded by an observer blinded to the experimental protocol. Results represent data of one of three independent experiments with similar observations. Significance was determined using a one-way analysis of variance (ANOVA) test using Tukey’s multiple comparisons test; *P≤ 0.05, **P≤ 0.01, ***P≤ 0.001 were considered significant. ns, not significant.
CXCL9 and CXCL10 directly induce different subtypes of effector and cytotoxic CD4+ T cells and CD8+ T cells in a self-feeding loop and are likely to be regulated by anti-PD-1Studies from various laboratories, including ours, previously suggested that CXCL10, and probably CXCL9, not only affect the migration of T cells, but also modulate their biological functions (22–27). A major limitation with all in vitro mechanistic studies thus far reported on the effects of CXCL9/10 on T cells relates to the fact that CXCL10 is produced to a varying degree by the cultured T cells undergoing activation, and CXCL9 may be produced by myeloid cells, when included. To avoid this complication, we generated an in vitro system in which the T cell response to exogenously added CXCR3 ligands could be measured in the absence of any endogenous CXCR3 ligand-production. We observed that under our working conditions, upon anti-CD3 & anti-CD28 mAb induced activation of purified T cells (see schematic diagram in Figure 2A), CD4+ and CD8+ T cells from WT C57BL/6 mice produced CXCL10, but not CXCL9, whereas CD4+ and CD8+ T cells from CXCL10KO mice did not produce CXCL10 and there was no compensation by CXCL9 (Figure 2B). C57BL/6 mice do not produce CXCL11 due to a natural mutation in the open reading frame of CXCL11 (36, 37). We therefore exploited this system, in which purified CD8+ T cells, or CD8+ T cells from CXCRL10LO mice were subjected to anti CD3&CD28 activation to analyze the differential contribution of CXCL9 and CXCL10 to the biological modulation of CXCR3+ T cells undergoing activation. Figure 2C summarizes the differential effect of CXCL10 and CXCL9 on cultured CD4+ T cells, whereas Figure 3 shows the analysis of CD8+ T cells. The effect of either CXCL9 or CXCL10 on T cell polarization of CD4+ and CD8+ T cells was similar, with minor differences. For both, it included upregulation of Ki-67, IFN-γ and IL-2 (Figures 2C, 3B–D), indicating a Th1-like CD4+ T cell and IFN-γhigh effector/cytotoxic CD8+ T cell polarization, activation and induction of proliferation. We also observed a significant increase in Th17-like CD4+ T cells, and IL-17-producing CD8+ T cells, also known as Tc17 cells (Figures 2C, 3F), which are known to exhibit significant anti-tumor properties (38). Collectively, these data imply that both CXCL9 and CXCL10 induce the proliferation and increased effector function in both CD4+ T and CD8+ T cells, which is highly relevant for cancer therapy (39, 40). Notably, CXCL9 and CXCL10 induced IFN-γ in both CD4+ and CD8+ T cells. (panel c in Figures 2, 3). Because CXCL10 is IFN-γ inducible (31, 32), it suggests a self-feeding loop that amplifies effector/cytotoxic T-cell functions. Further analysis showed that this interaction also upregulated the expression of PD-1 (panel h in Figures 2, 3). The upregulation of PD-1 is likely to negatively control the positive feedback loop between CXCR3-CXCL9/CXCL10 and IFNγ; this may explain, in part, why anti-PD-1 ICT is more effective in CXCL9/CXCL10high individuals. Moreover, a comparative analysis of IFN-γ upregulation and PD-1 expression showed their elevated expression in CXCR3+ T cells, as well as PD-1 expression on IFN-γhigh producing cells (Figures 2, 3I–K).
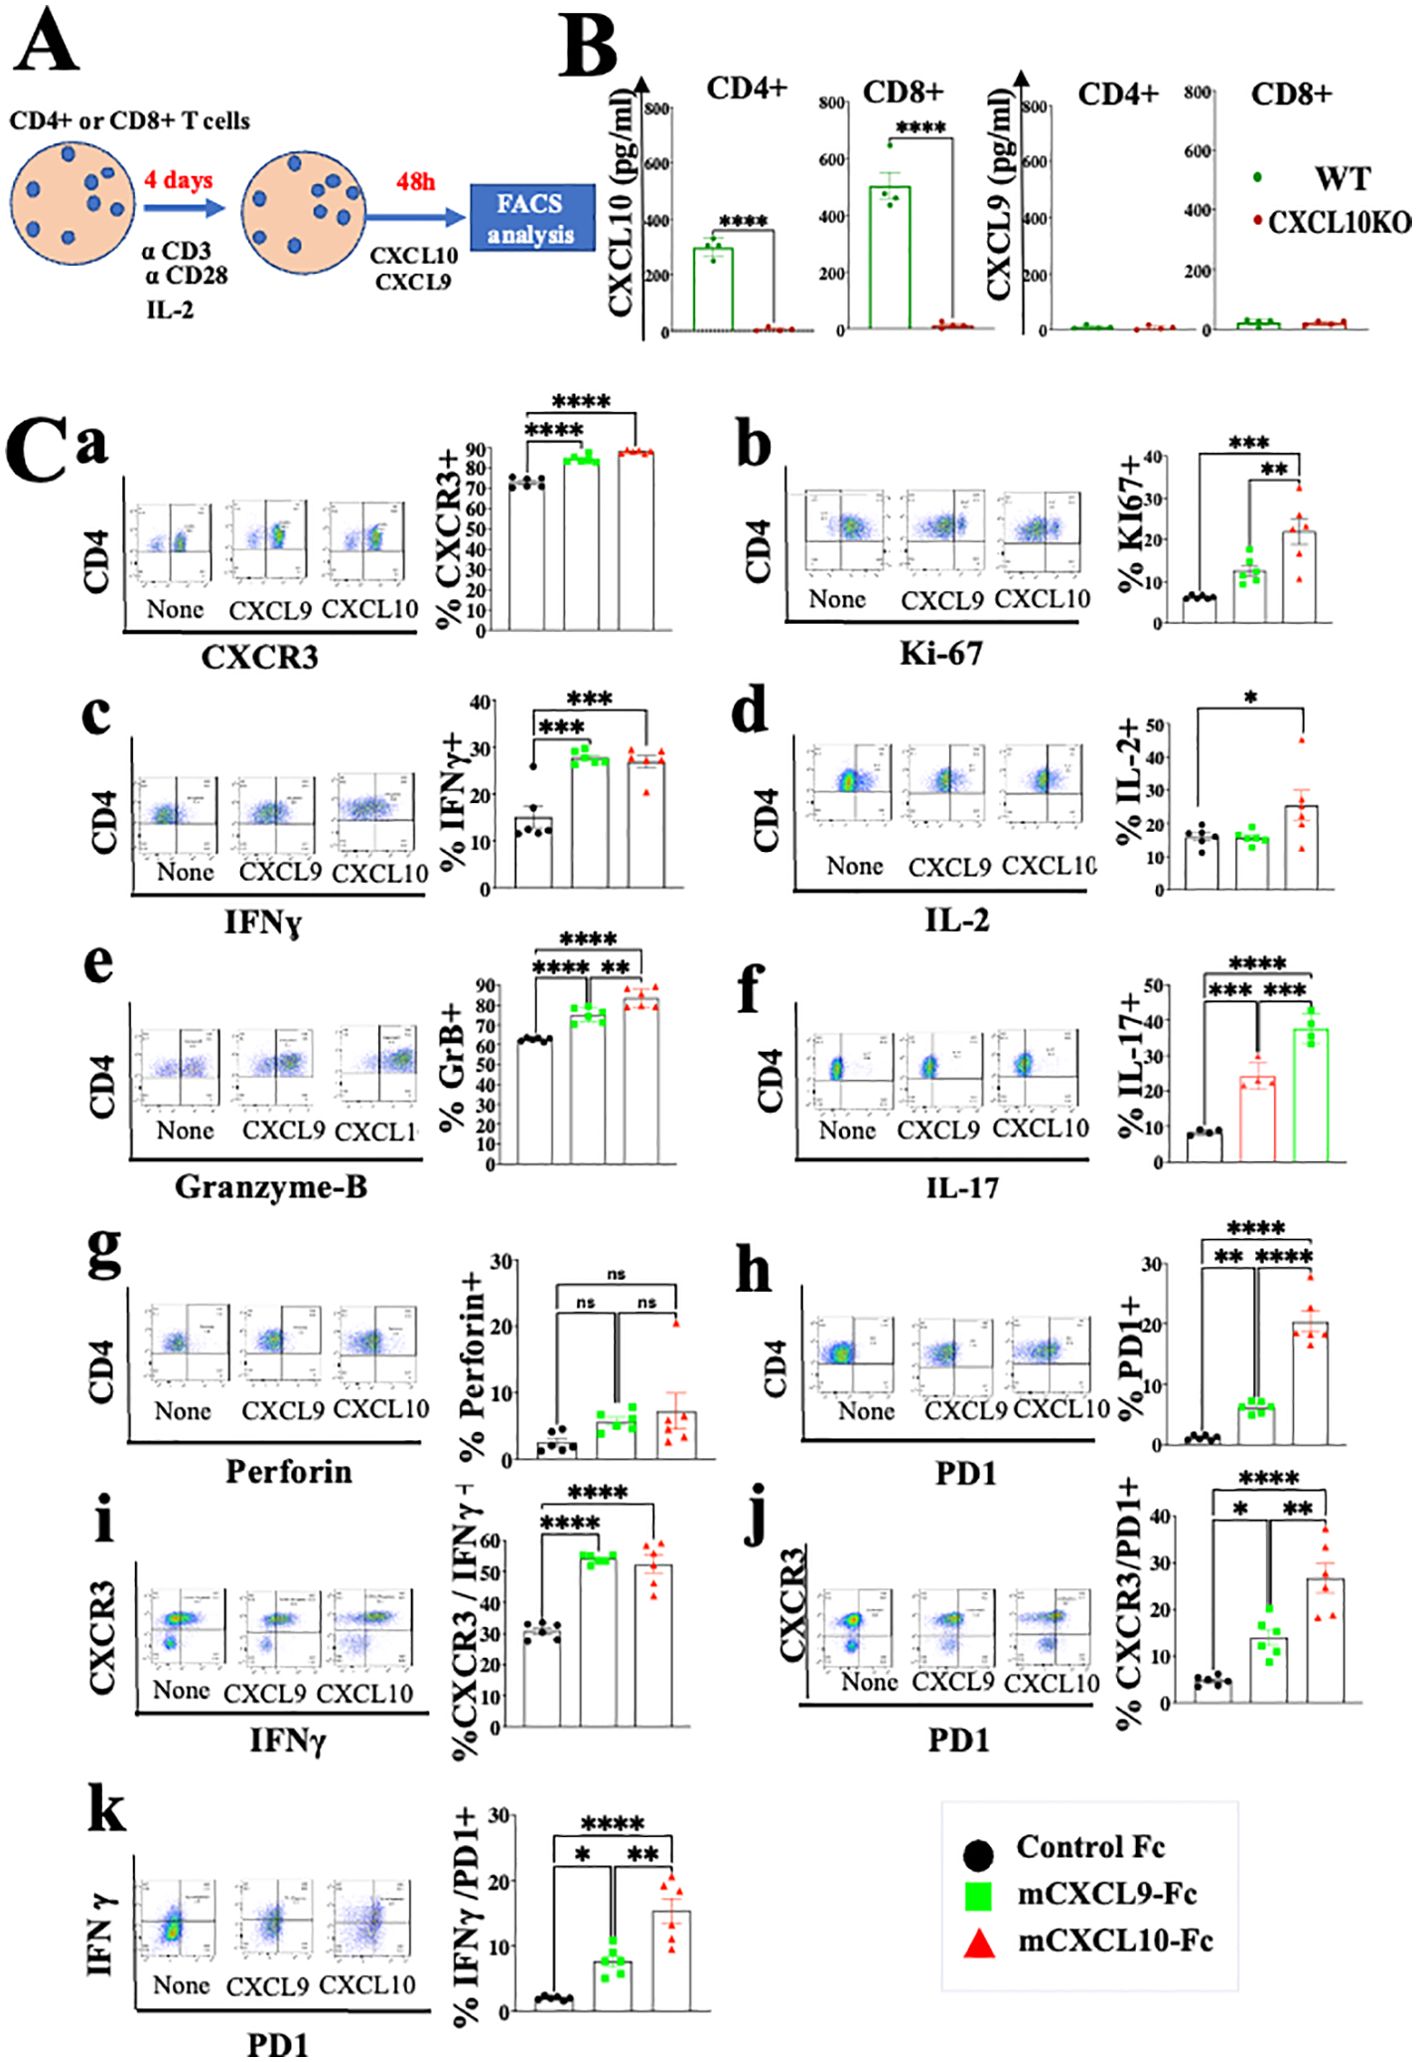
Figure 2. CXCL10 and CXCL9 drive the polarization of CD4+ T cells into IFNγhigh cytotoxic T cells and Th17high CD4+ T cells while increasing their Ki-67 and IL-2 expression. (A) Spleenocytes were obtained from naïve mice (WT) or CXCL10 knockout (KO) mice (6 per group) and sorted into CD4+ cells using a MACS Easy-Sep magnetic separation kit. CD4+ cells were then cultured at a density of 106 cells per well, in the presence of anti-CD3 monoclonal antibody (mAb) at 5µg/ml, anti-CD28 mAb at 3µg/ml, and IL-2 at 10ng/ml. Following four days in culture, the cells were supplemented with either 100 ng per well of CXCL9 or CXCL10 for 48 hours and subsequently analyzed via flow cytometry to assess the expression of CXCR3, PD-1, IFN-γ, Ki-67, IL-2, IL-17, granzyme B, and perforin. (B) CD4+ and CD8+ T cells activated with anti-CD3 from wild-type (WT) and CXCR3 knockout (KO) mice were assessed for the production of CXCL9 and CXCL10 by ELISA. (C) CXCL10 and CXCL9 drove the polarization of CD4+ T cells towards IFNγhigh Th1-like cells, Th17 effector cells, and granzyme-B high cytotoxic T cells, while also enhancing expression of Ki-67 and IL-2. Results present data of one of two independent experiments with similar observations. Significance was determined using a one-way analysis of variance (ANOVA) test using Tukey’s multiple comparisons test; *P≤ 0.05, **P≤ 0.01, ***P≤ 0.001, ****P<0.0001 were considered significant. ns, not significant.
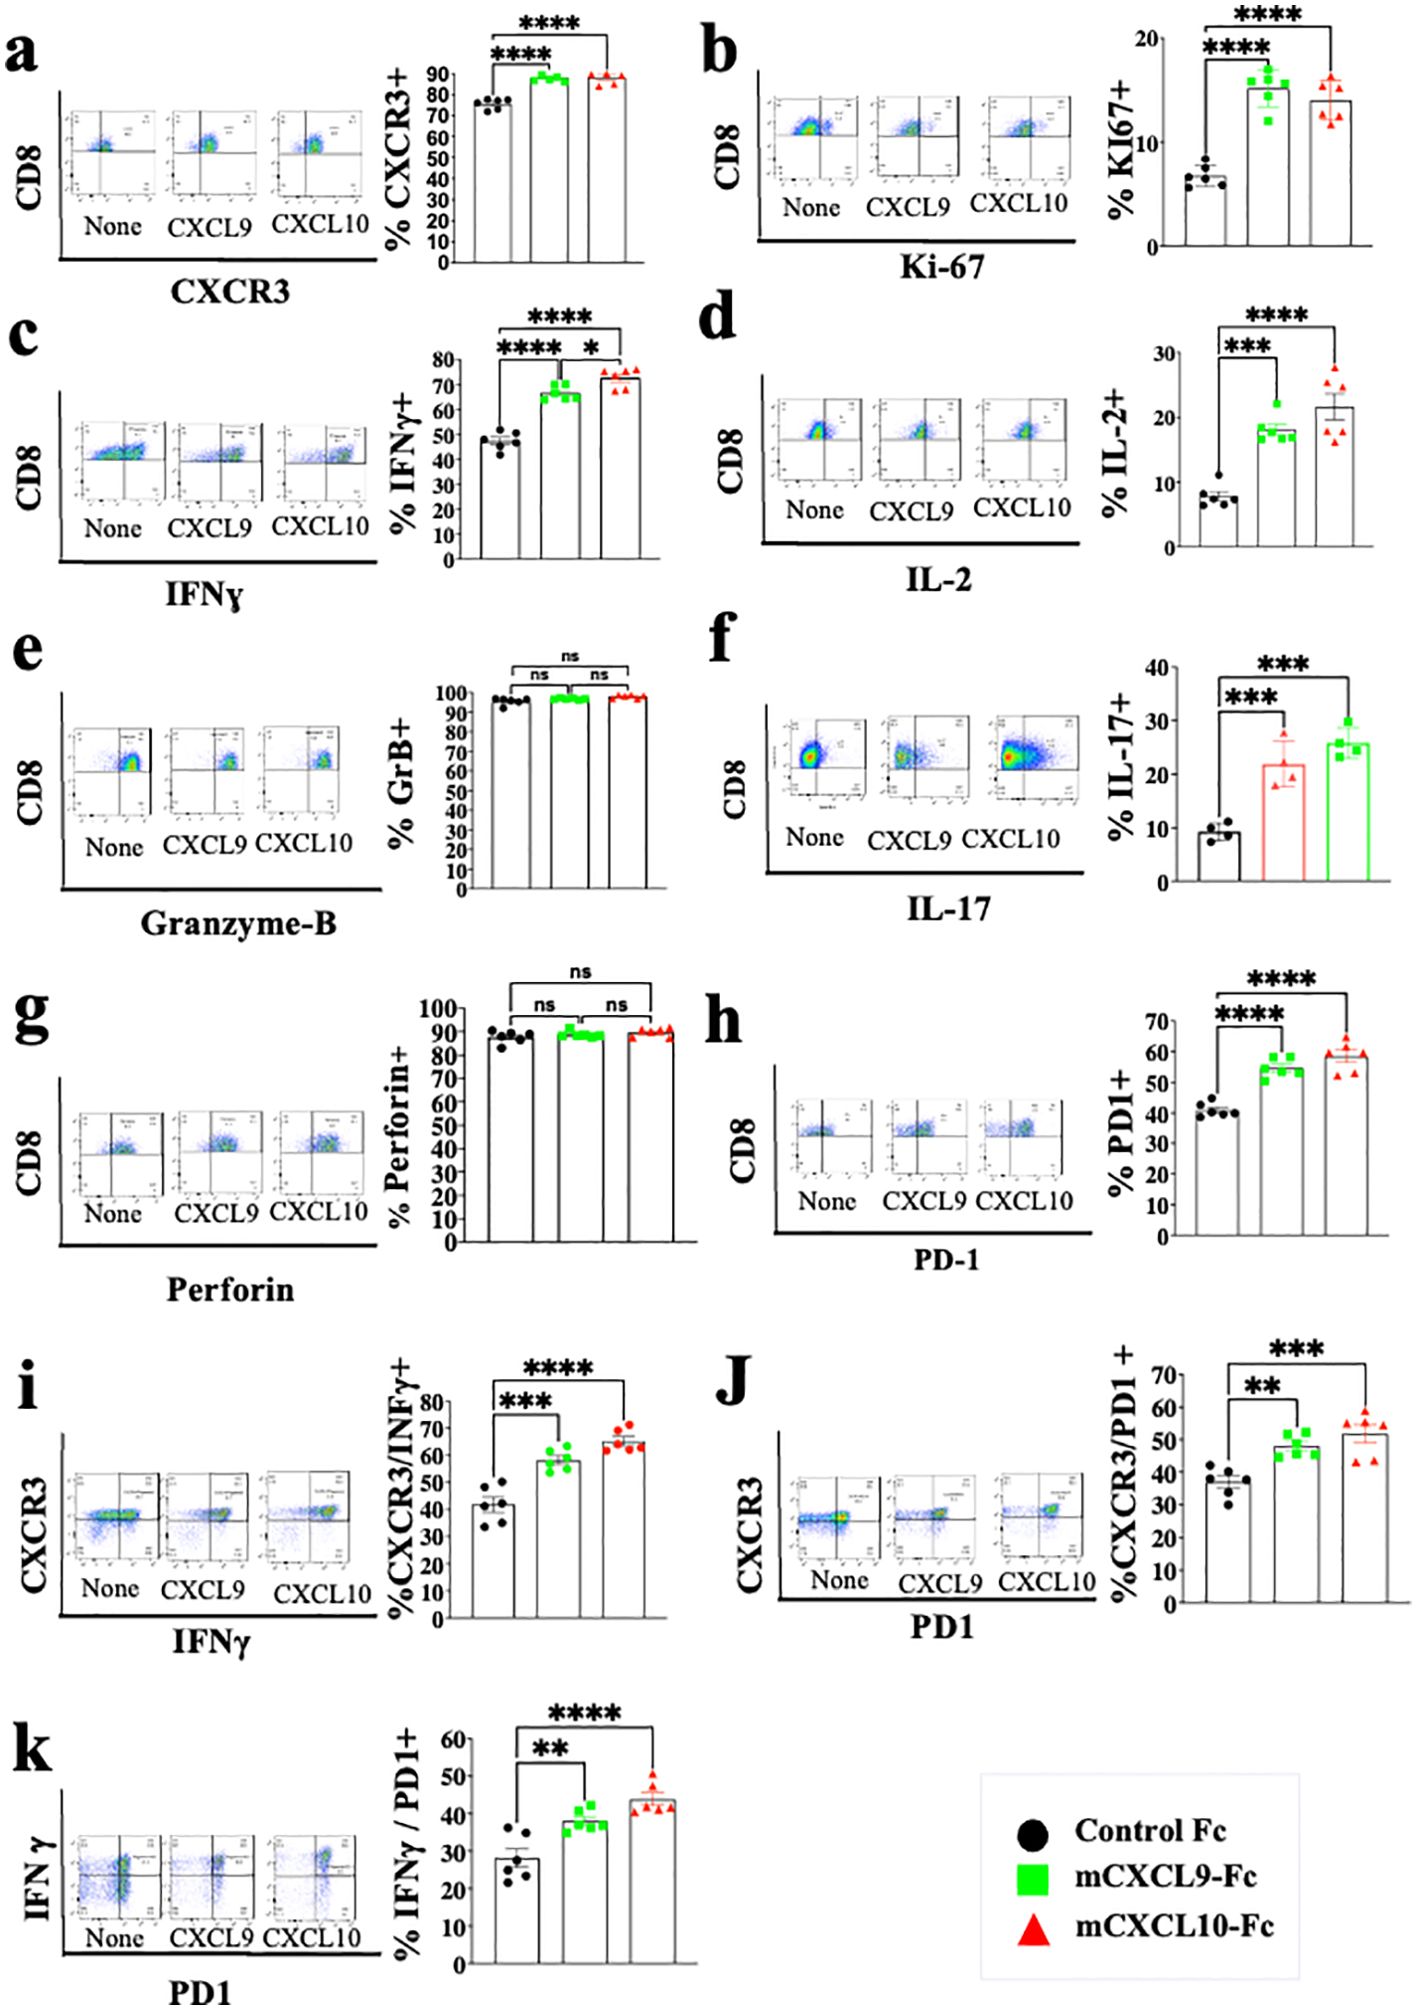
Figure 3. CXCL10 and CXCL9 drive the polarization of CD8+ T cells into IFNɣhigh cytotoxic T cells and Th17-like CD8+ T cells while increasing their Ki-67 and IL-2 expression. Spleenocytes were obtained from naïve CXCL10KO mice (6 per group) and sorted into CD8+ T cells using a MACS Easy-Sep magnetic separation kit. CD8+ T cells were then cultured at a density of 106 cells per well, in the presence of anti-CD3 monoclonal antibody (mAb) at 5µg/ml, anti-CD28 mAb at 3µg/ml, and IL-2 at 10ng/ml. Following four days in culture, the cells were supplemented with either 100 ng of CXCL9 or CXCL10 for 48 hours and subsequently analyzed via flow cytometry to assess the expression of CXCR3, PD-1, IFN-γ, Ki-67, IL-2, IL-17, granzyme-B, and perforin. (A) Analysis of CXCR3 Vs. CD8 (B) Analysis of Ki67 Vs. CD8 (C) Analysis of IFN-γ Vs. CD8 (D) Analysis of IL-2 Vs. CD8 (E) Analysis of Granzyme-B Vs. CD8 (F) Analysis of IL-17 Vs. CD8 (G) Analysis of Peripherin Vs. CD8 (H) Analysis of PD-1 Vs. CD8 (I) Analysis of IFNγ Vs. CXCR3 (J) analysis of PD-1 Vs. CXCR3 (K) analysis of PD-1 Vs. IFNγ. Results present data from one of two independent experiments with similar observations Significance was determined using a one-way analysis of variance (ANOVA) test using Tukey’s multiple comparisons test; *P≤ 0.05, **P≤ 0.01, ***P≤ 0.001 were considered significant. ns, not significant.
Crosstalk between cancer and the immune cells expands the self-feeding loop and its association with immune checkpoint blockadeAs previously addressed, CXCL10 is known to be IFN-γ-inducible (31, 32). To evaluate the possible extension of the CXCL10- IFN-γ axis to the cancer cells, we first evaluated whether IFN-γ also induced CXCL10 production in various murine and human cancer cell lines (Supplementary Figure S1). In four out of five different cell lines that we examined, IFN-γ significantly increased CXCL10 production but did not affect CXCL9 production. Notably, human A375 melanoma cells produced a similar base level of CXCL10 and CXCL9 (about 200 pg/ml) but in response to IFN-γ, it showed about a 6-fold increase in CXCL10 production, with no increase in CXCL9 production (Supplementary Figure S1E). To detect how anti-PD-1 or anti-CTLA-4 checkpoint blockade would interfere in the above cycle, we used a 3-D spheroid system (41) that includes tumor spheroids and CD8+ T cells from MC38 cancer-developing donors as described in Figure 4A. Cultures were or were not supplemented with 10 µg/ml αPD-1 or αCTLA4 and analyzed 24h later by flow cytometry and by ELISA (Figures 4B, C). The results clearly demonstrated that blockade of either PD-1 or CTLA-4 triggered the IFNγ-CXCL10-CXCR3 cycle that included a significant increase in the relative number of CD8+ T cells, their proliferation (Ki67+), CXCR3 expression, IFNγ production, and CXCL10 production. Collectively, this implies that ICT induces the IFN-γ-CXCL10-CXCR3 cycle, and its amplification is CXCL10-dependent. CXCL9 was not produced by CD8+ T cells or cancer cells and it has not been investigated as part of the loop, but should be taken into consideration at the tumor site where it is largely produced by CD106+ DC (19).
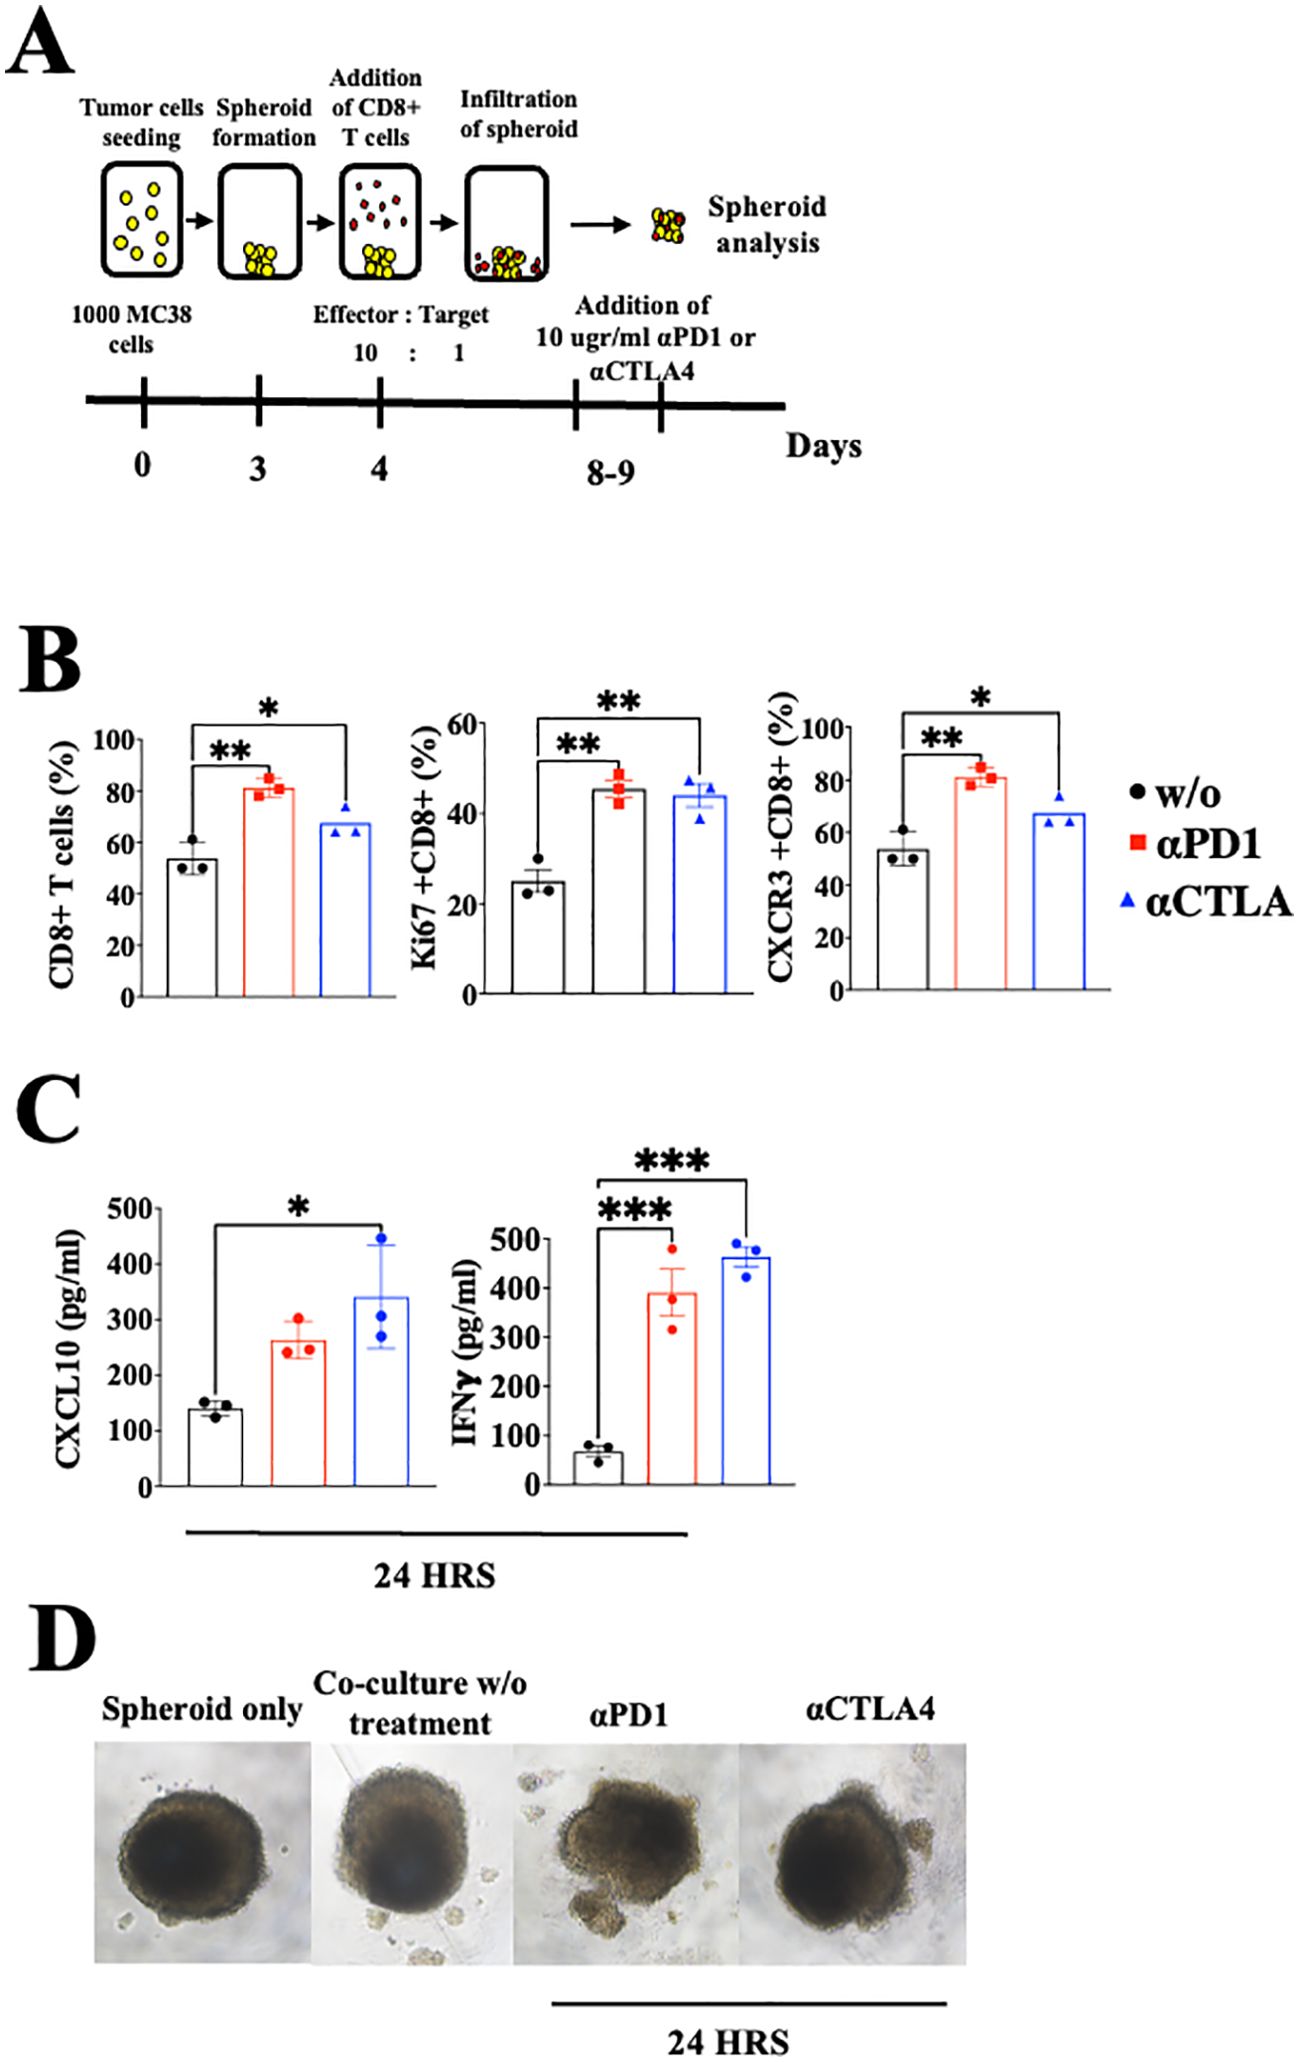
Figure 4. Blockade of PD-1 and CTLA-4 induces the CXCR3-CXCL10-IFNγ cycle in spheroids with activated CD8+ T cells coculture setup. (A) A scheme depicting the coculture protocol for MC38 spheroids with activated CD8+ T cells isolated from WT C57Bl/6 mice. MC38 spheroids were either cocultured with or without activated CD8+ T cells, supplemented with 10 µg/ml of αPD-1 or αCTLA4, and analyzed 24 hours post-treatment. (B) Flow cytometry analysis conducted on the interior compartment of the spheroid. (C) ELISA analysis of CXCL10 and IFN-γ levels following the addition of αPD-1 or αCTLA4. (D) Monitoring of spheroid structure using a light microscope. Results present data of one of three independent experiments with similar observations. Significance was determined using a one-way analysis of variance (ANOVA) test using Tukey’s multiple comparisons test; *P≤ 0.05, **P≤ 0.01, ***P≤ 0.001 were considered significant.
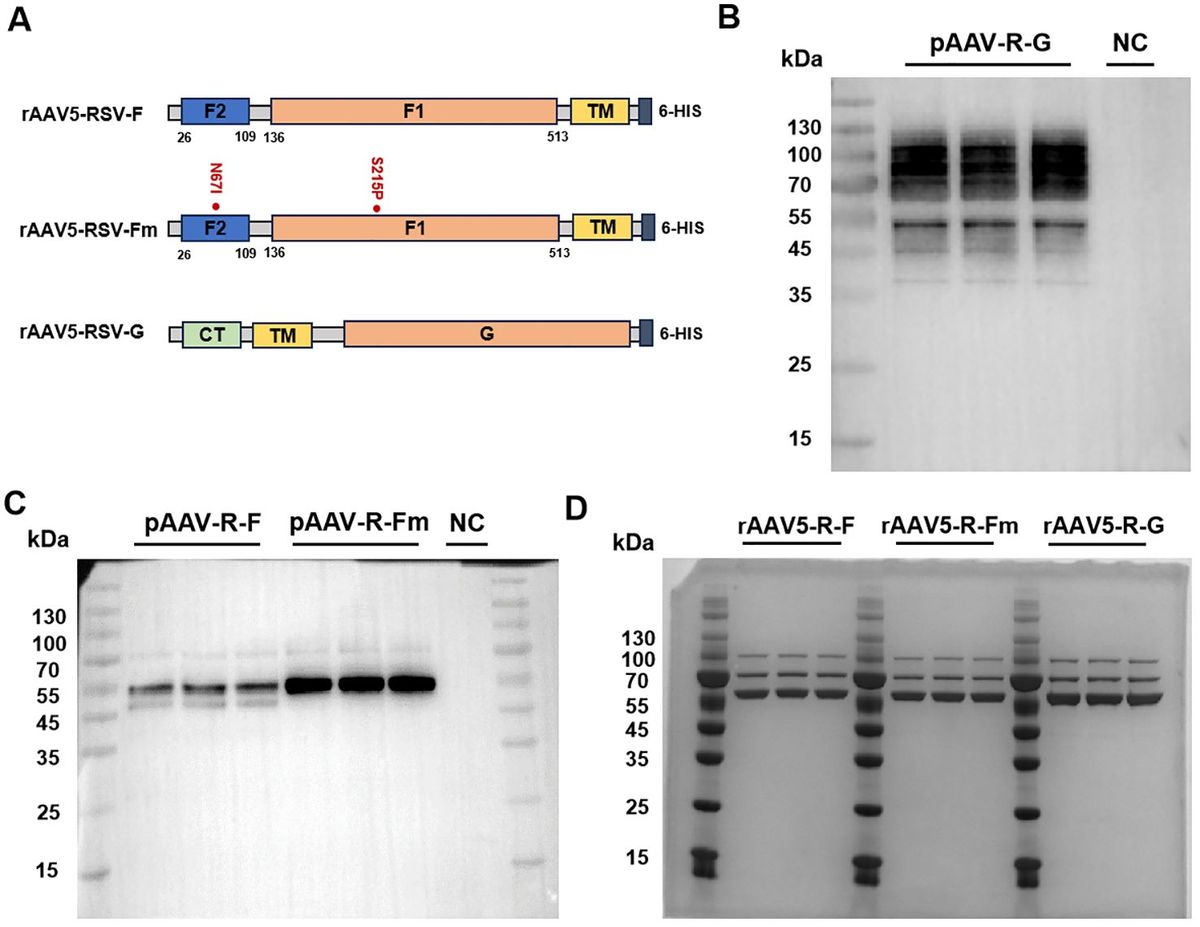
Administration of CXCL10-Fc and CXCL9-Fc limits melanoma growth while selecting subtypes of effector and cytotoxic CD4+ and CD8+ T cells with an IFN-γhigh signature, further limiting tumor growth.Previously, we developed a fusion protein that includes CXCL10 linked to the N-terminus of murine IgG1 Fc (CXCL10-Fc) for cancer therapy and CXCL11-Fc for therapy of autoimmunity (27, 42). Each purified fusion protein was subjected to Western Blot analysis (Supplementary Figure S2A) and Ca++ flux using CHO cells overexpressing human CXCR3A (Supplementary Figure S2B). For in vivo studies, each fusion protein was administered to mice engrafted with the ret melanoma cell line. CXCL9-Fc and CXCL10-Fc significantly reduced tumor growth (Figure 5A, day 13 P<0.05). We analyzed the effect of therapy on the relative number (out of total CD45+ cells) of CD8+ T cells, CD4+ T cells, and NK cells at the tumor site. The relative number of CD8+ T cells increased from about 3% to 20% and 15% following CXCL9-Fc or CXCL10-Fc treatment, respectively; CD4+ T cells increased from about 5% to about 18% and 13%, respectively (Figure 5B). As for NK cells, their relative number in control mice was about 1.8% and increased about 2-fold in mice after CXCL10-Fc treatment (Figure 5B). Further analysis of CXCR3+ NK cells is beyond the scope of the current manuscript, which mainly focuses on CD8+ and CD4+ T cells.
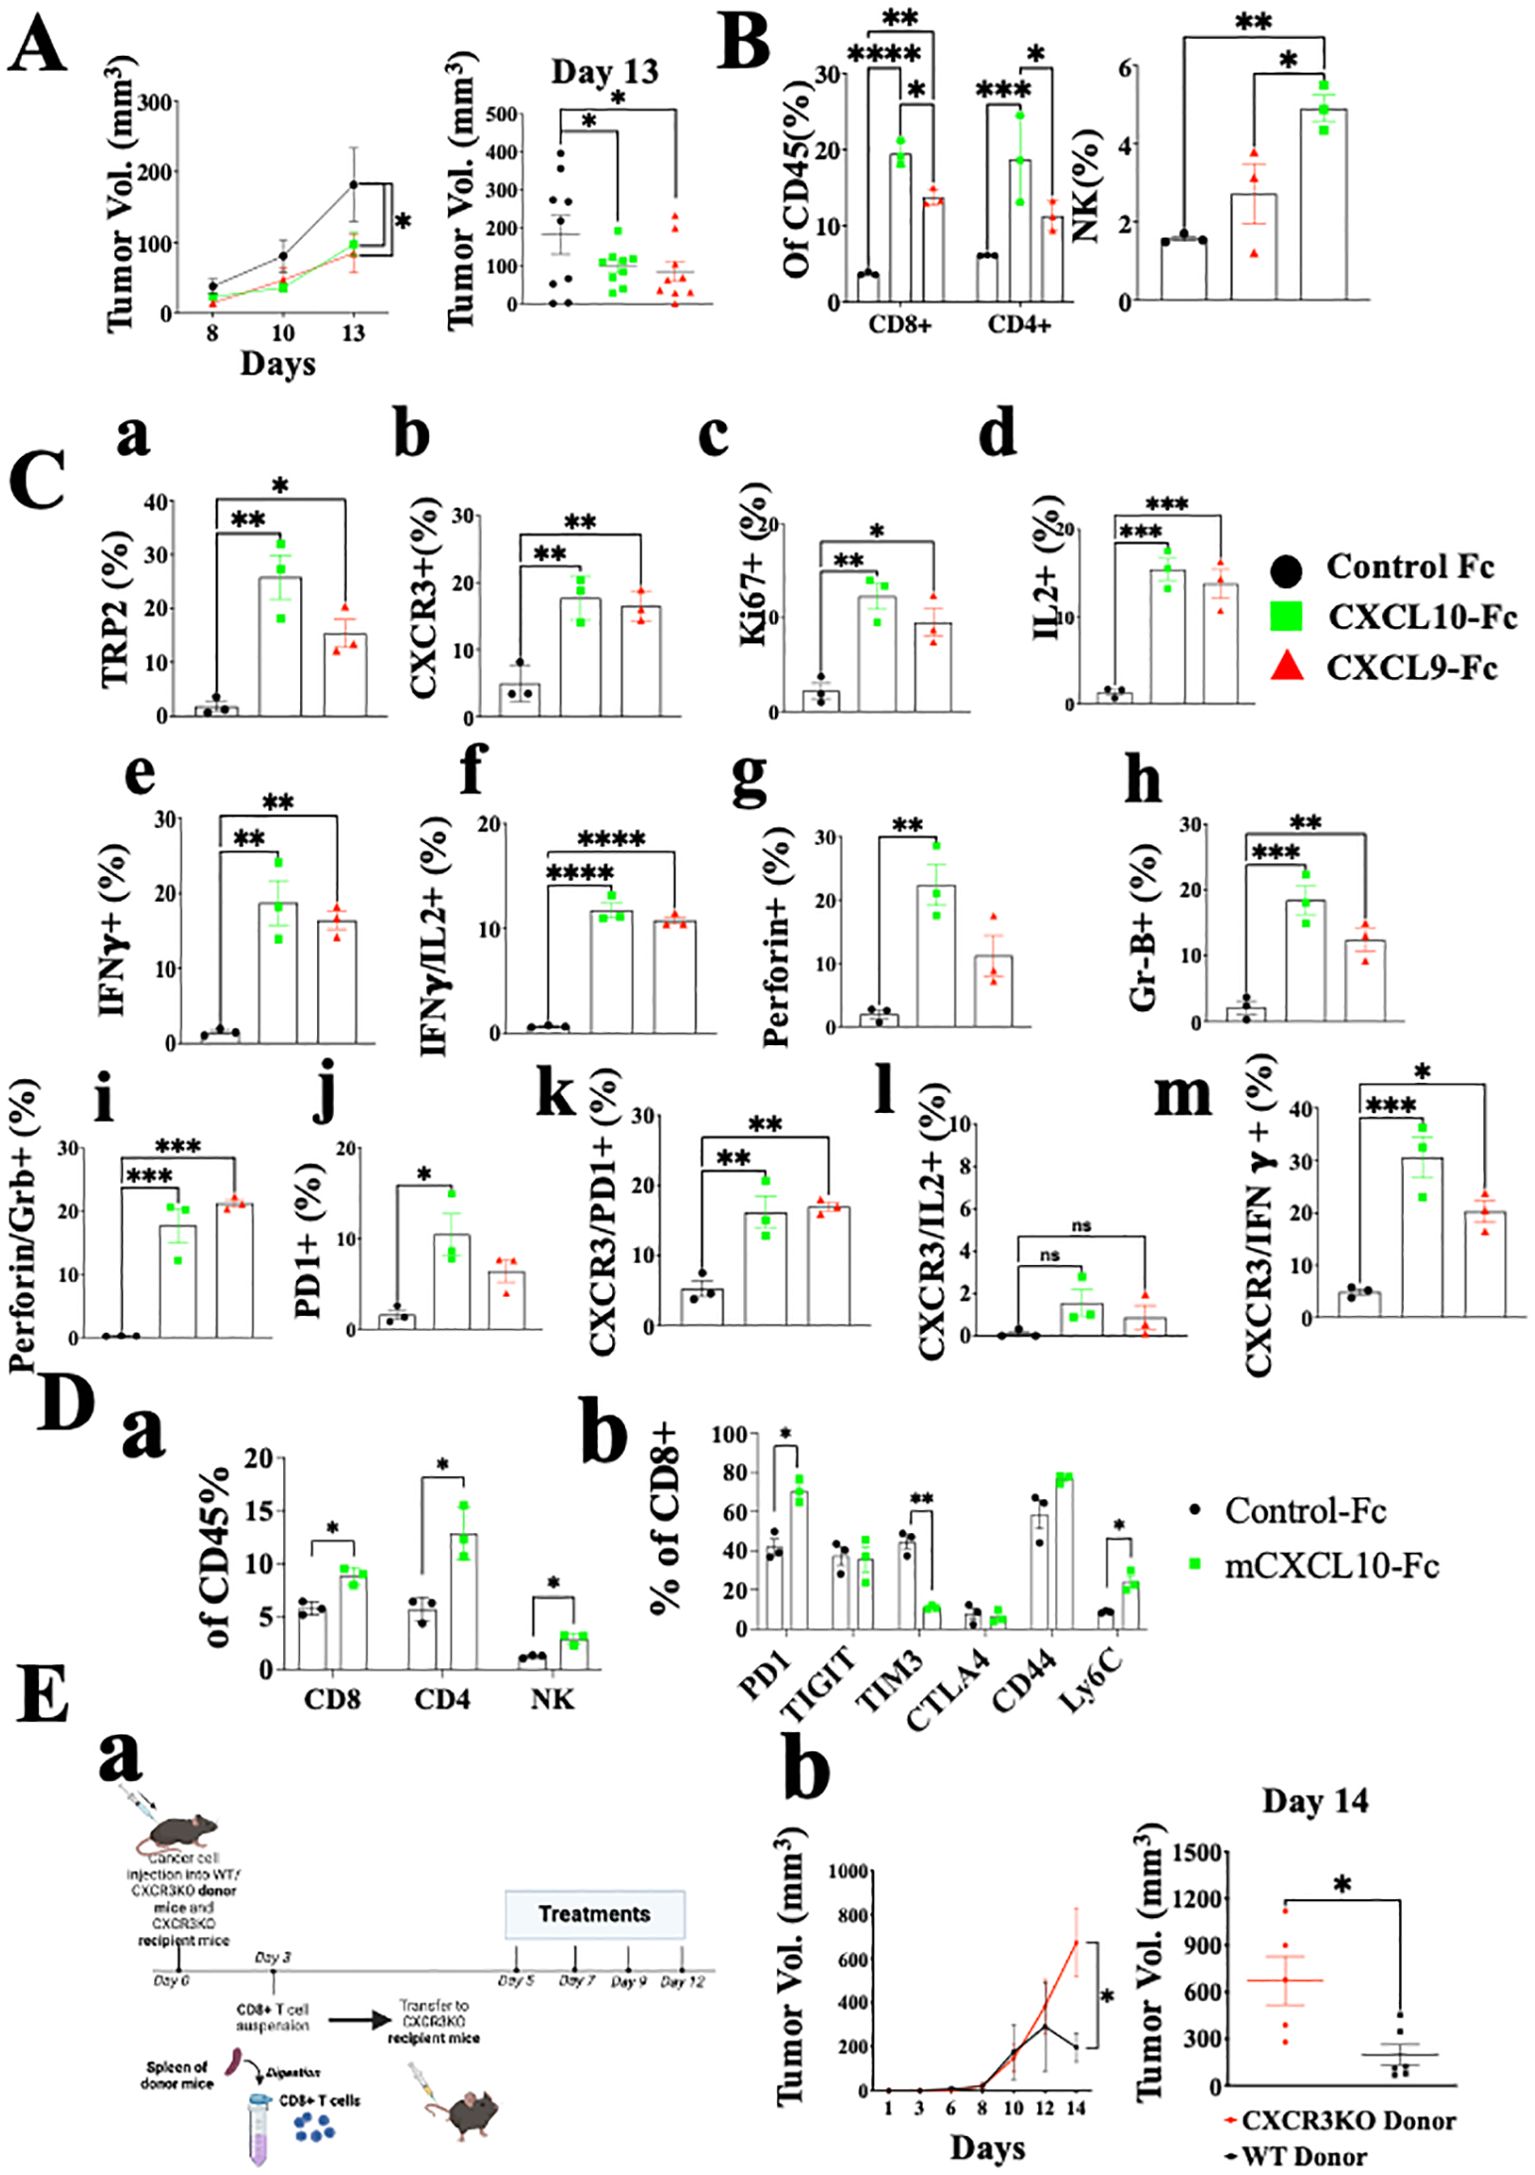
Figure 5. CXCL10-Fc and CXCL9-Fc induce IFNγhigh, IL17high effector/cytotoxic CD8+ T cells and exhaustion recovery that directly limit tumor growth C57BL/6 mice were subcutaneously injected with 2x10⁵ ret tumor cells overexpressing mCherry on the right flank. When tumor size reached about 50 mm3, they were separated into three identical groups of nine mice each. Each group was injected three times with 200µg/mouse CXCL10-Fc or CXCL9-Fc or with isotype matched control IgG, on days 8, 10, and 12. (A) The kinetics of tumor growth of all groups. (B) TILs were gated on CD45+ population. The effect of CXCL9-Fc or CXCL10-Fc therapy on the relative number of CD8+, CD4+, and NK cells at the tumor site is shown (as a percentage of total CD45+ population). (C) CD8+ T cell flow cytometry analysis (as a percentage of total CD45+CD8+ population) (D panel a) CXCL10-Fc directly induces CXCR3+ CD8+ T cells that restrain melanoma growth. (D panel b) PD-1, TIGIT, TIM3, CTLA4, CD44 and Ly6C expression determined on CD8+ T cells (as a percentage of total CD45+CD8+ population). (E) CXCL9-Fc limits tumor growth in CXCR3KO mice if reconstituted with CXCR3+ CD8+ T cells from cancer developing donors: (a) Schematic overview of the experimental protocol: Three days after subcutaneous engraftment of the ret melanoma cell line in either C57BL/6 WT or CXCR3 KO donor mice, CD8+ T cells were isolated from the spleen and intravenously transferred (0.5 × 10⁶ cells per mouse) into recipient mice lacking CXCR3. All mice received CXCL10-Fc treatment (40 µg/mouse) twice a week and were monitored for primary tumor development. (b) the kinetics of tumor development in each group and scattered analysis of tumor volume on the final day of the experiment, on day 14. Results represent data of one of three independent experiments with similar observations and are shown as mean ± standard deviation. Significance is determined using a one-way analysis of variance (ANOVA) test using Tukey’s multiple comparisons test; *P≤ 0.05, **P≤ 0.01, ***P≤ 0.001, ****P<0.0001 were considered significant.
As for CD8+ T cells, not only did their relative number dramatically increase, but also the relative number of tumor-specific T cells, as determined by TRP-2 pentamer-binding by tumor infiltrating lymphocytes (TILs), showed about 12-fold and a 7-fold increase in CXCL9-Fc and CXCL10-Fc treated mice, respectively (Figure 5C, a). A 3-fold increase was also observed in the expression of CXCR3 on these cells (Figure 5C, b). An about 5-fold increase in Ki67 accompanied by a similar increase in IL-2 production indicates an increase in the proliferation and activation state of these cells (Figure 5C, c, d). Most importantly, both CXCL9-Fc and CXCL10-Fc polarized T cells towards an IFN-γ high signature (Figure 5C, e). Further analysis of IFNγ vs. IL-2 (Figure 5C, f) indicates a clear association between increased IL-2 production and IFN-γ production in these cells. A very similar increase in perforin and granzyme-B was recorded in mice treated with CXCL9-Fc or CXCL10-Fc (Figure 5C, g, h). Further analysis of perforin high granzyme-B high CD8+ T cells (Figure 5C, i) show a clear association between increased perforin production and granzyme-B production in these cells. Thus, 20% of CD8+ T cells induced by CXCL9-Fc or CXCL10-Fc are cytotoxic CD8+ T cells, compared to less than 3% in control mice.
Finally, as a possible counter-mechanism, CXCL9-Fc and CXCL10-Fc led to a significant increase in PD-1 expression from about 2% to about 10% in CXCL9-Fc and about 7% in CXCL10-Fc treated mice (panel j). The significant increase in PD-1 expression, IL-2, and IFN-γ are all associated with increased CXCR3 expression on CD8+ T cells (Figure 5C, k–m). In conclusion, systemic administration of either CXCL9-Fc or CXCL10-Fc markedly increases the relative number of activated highly potent tumor-specific CD8+ T cells at the tumor site, and to some extent PD-1 expression on about 7-10% of these cells.
The possible association between CXCL9/CXCL10 interplay with CXCR3 and upregulation of PD-1 expression motivated us to explore further the effect of CXCL10-Fc on CTLA-4 and other inhibitory receptors including T cell immunoglobulin and mucin domain-containing protein 3 (TIM3) and tyrosine-based inhibition motif domain (TIGIT), which are also upregulated in exhausted T cells (43, 44). In addition, we examined the effect of CXCL10-Fc on the expression of CD44 and Ly6C, which are highly expressed on effector CD8+ T cells and, to a much lesser extent, on exhausted T cells (45). Figure 5D shows that CXCL10-Fc therapy led to a significant increase in the relative number of CD8+ T cells, CD4+ T cells, and NK cells at the tumor site (Figure 5D, a), and to a significant increase in PD-1 expression on these CD8+ T cells (Figure 5D, b); it also led to a marked decrease in TIM3 (p<0.001) and a significant increase in Ly6C (Figure 5D, b), with no significant effect in TIGIT. Collectively this implies that, despite the effect of CXCL10-Fc on the expression of PD-1, which may suggest shifting to T cell exhaustion (43, 44), all other markers imply that therapy may further induce effector/cytotoxic T cells. CTLA-4 expression was low in both groups and was not affected by therapy.
How significant is the direct effect of CXCL10-Fc on the ability of CXCR3+ CD8+ T cells to limit tumor growth? An adoptive transfer set-up in which CD8+ T cells were isolated from the spleen of either WT or CXCR3KO mice engrafted with Ret tumors, and transferred into Ret-tumor-harboring CXCR3KO recipient mice was conducted (Figure 5E, a). Both recipient groups were then treated with CXCL10-Fc. Only the administration of CXCL10-Fc to mice transferred with CXCR3+ CD8+ T cells led to a significant decrease in tumor size (Figure 5E, b). The results represent data from one of two independent experiments with very similar data. In conclusion, CXCL10, which directly polarizes and potentiates CXCR3+ CD8+ T cells (see Figure 3), also directly potentiates these cells to limit tumor growth.
Figure 6A shows the analysis of CD4+ T cells in the same setup as described above for CD8+ T cells (Figure 5C). The results are very similar to those obtained for CD8+ T cells and include a highly significant increase in CXCR3 expression, about 6-fold following CXCL9-Fc therapy and about 10-fold following CXCL10-Fc therapy (Figure 6, a). A significant upregulation in T cell proliferation (Ki67), IFNγ, and IL-2 production was recorded (Figure 6, b–d). Further analysis of IFNγ vs. IL-2 (Figure 6, e) indicates a clear association between increased IL-2 production and IFN-γ production in these cells (Th1 polarization). Analyses of granzyme B (Figure 6, f) and perforin (Figure 6, g) shows a significant increase in granzyme Bhigh perforin high cytotoxic CD4+ T cells (Figure 6, h). The relative number of FOXp3+ Tregs was relatively low (about 3%) and gradually increased to about 4% following CXCL9-Fc and 5% following CXCL10-Fc therapy (Figure 6, i, nonsignificant). Similarly to CD8+ T cells, CD4+ T cells upregulated PD-1 the prevalence of expression from about 6% to 18% (Figure 6, j) with a high association with CXCR3 expression (Figure 6, k). We also analyzed the association between CXCR3 expression and either IL-2 or IFNγ expression. For both a highly significant increase in IL-2 and IFNγ was associated with the increase in CXCR3 expression (Figure 6, l, m). Collectively this further emphasizes the key role of CXCL9-Fc and CXCL10-Fc to induce IL-2highIFNγhigh Th1cells.
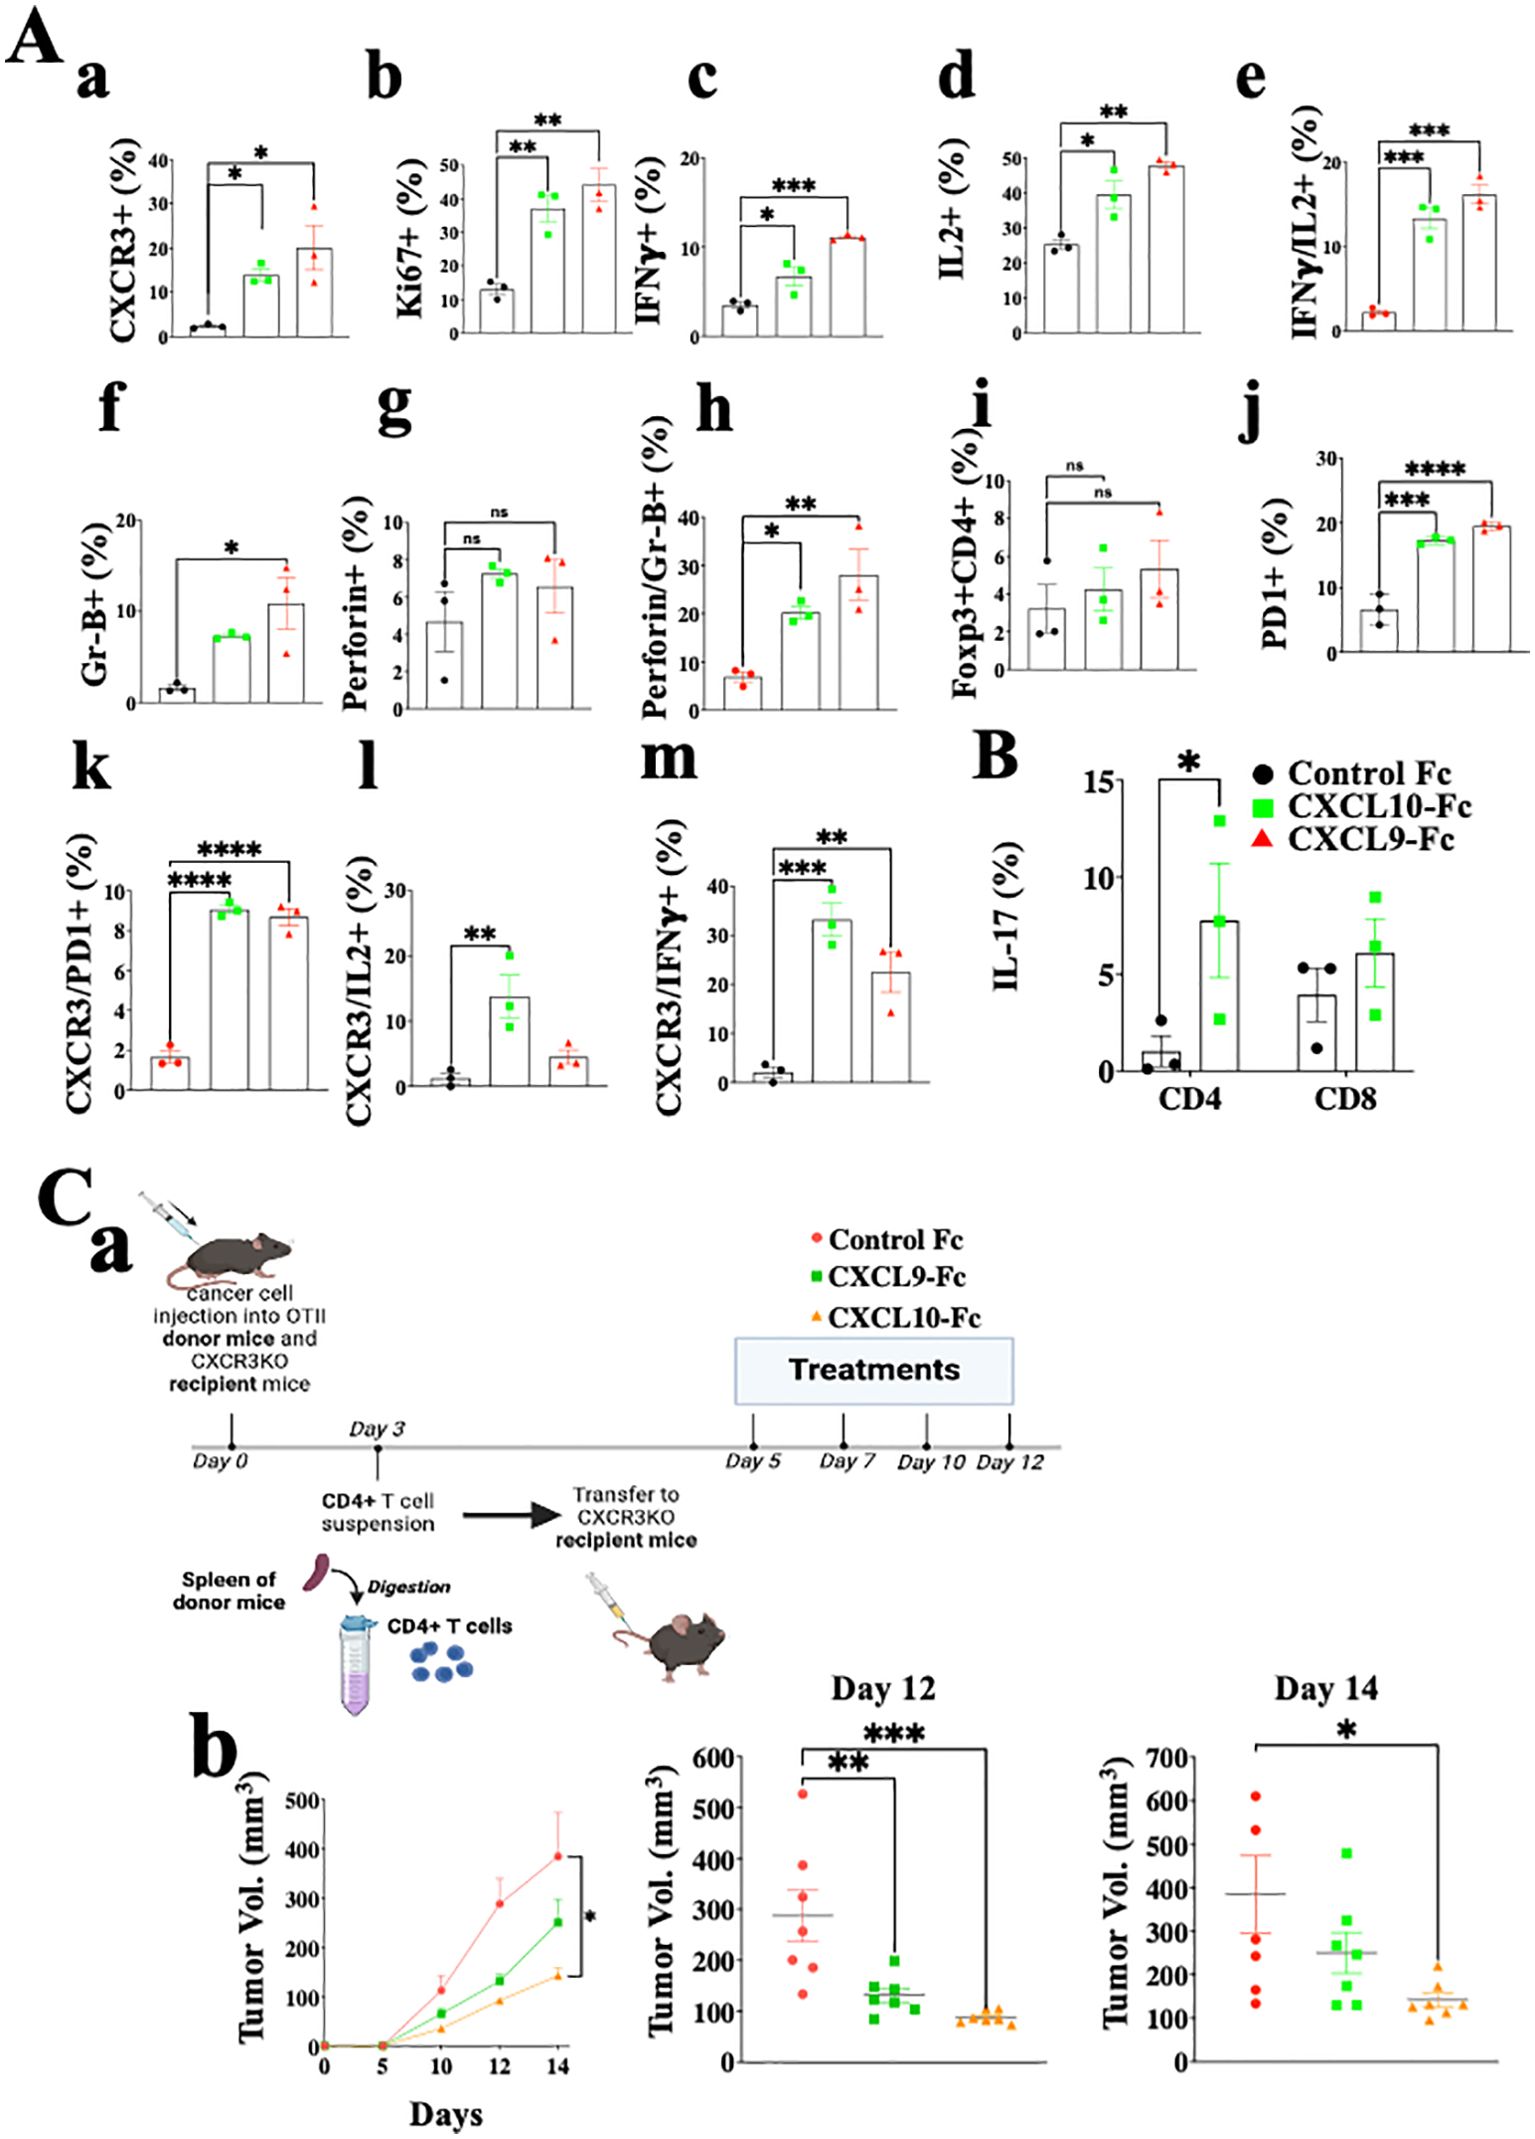
Figure 6. CXCL10-Fc and CXCL9-Fc induce IFNγhigh and IL17high effector/cytotoxic CD4+ T cells that directly limit tumor growth. (A) CD4+ T cell analysis of the ex vivo experiment described in legend to Figure 5. (B) The effect of CXCL10-Fc therapy on the selection of IL-17high CD45+CD4+ T cells (C) CXCL9-Fc and CXCL10-Fc limit tumor growth by directly affect CD45+CXCR3+ CD4+ T cells (a) Schematic overview of the experimental protocol: Three days after subcutaneous engraftment of the ret melanoma line overexpressing OVAII, either in OT-II donor mice or in CXCR3 KO recipient mice, CD4+ T cells were isolated from the spleen of OT-II donor mice and intravenously transferred (0.5 × 10⁶ cells per mouse) to three groups of CXCR3KO mice (7 females/group). Recipient mice were then administrated with CXCL9-Fc, CXCL10-Fc (twice a week, 50µg/mouse), or with isotype matched control IgG. The kinetics of tumor development in each group and scattered analysis of tumor volume on days 12 and 14. Results present data of one of three independent experiments with similar observations and are shown as mean ± standard deviation. Significance is determined using a one-way analysis of variance (ANOVA) test using Tukey’s multiple comparisons test; *P≤ 0.05, **P≤ 0.01, ***P≤ 0.001, ****P<0.0001 were considered significant. ns, not significant.
In summary, the results of CD4+ T cell analyses are very similar to those obtained for CD8+ T cells and imply increased proliferation and shifting T cell polarization into IFN-γ high Th1-like cells and IFN-γhigh cytotoxic CD4+ T cells. In another experiment done using the same protocol, we evaluated IL-17 expression in CD4+ T cells and CD8+ T cells following CXCL10-Fc therapy (Figure 6B), revealing a significant increase in Th17-like CD4+ T cells.
To evaluate the significance of the direct effect of CXCL10-Fc on the ability of CXCR3+ CD4+ T cells to limit tumor growth, we performed an adoptive transfer in which CD4+ T cells were isolated from OT-II mice engrafted with Ret melanoma, transferred into CXCR3KO mice. This is an alternative protocol to the one used above for CD8 analysis (Figure 5D) and requires CXCR3KO OT-II donors. CD4+ T cells from OT-II mice (CXCR3+) engrafted with the ret melanoma cell line transduced to stably express OVA II (ret-OVAII melanoma cell line) were injected into CXCR3KO mice also engrafted with the ret-OVAII melanoma cell line and then treated with CXCL9-Fc, CXCL10-Fc or control IgG1 (Schematic View in Figure 6C, a) and monitored for tumor development. Figure 6C, b shows that both CXCL9-Fc and CXCL10-Fc significantly suppressed tumor development. CXCL10-Fc was superior to CXCL9-Fc (p<0.05). Collectively these results further highlight the role of CXCL9 and CXCL10 in potentiating, not only anti-tumor CD8+ T cells but also anti-tumor CD4+ T cells, including cytotoxic CD4+ T cells.
Collectively the above data imply that CXCL9 and CXCL10 directly polarize different subtypes of effector/cytotoxic T cells that are either CD4+ or CD8+, both with IFN-γhigh signature that can induce an IFN-γ dependent self-feeding loop to further amplify these activities. The results also indicate that the direct effect on either CD4+ or CD8+ T cells alone is sufficient to reduce tumor growth.
Finally, comparative analysis between the spleen and tumor cells of mice treated with either CXCL10-Fc or control IgG (Supplementary Figure S3) showed that successful therapy (Supplementary Figure S3A) led to a significant increase in CD4+ T cells and CD8+ T cells at the tumor site, but not spleen (Supplementary Figure S3B). Similarly, the relative number of NK cells also exclusively increased at the tumor site (Supplementary Figure S3C). Ki67 significantly increased in CD8+ (Supplementary Figure S3D) and CD4+ T cells (Supplementary Figure S3F) in both the spleen and the tumor site, indicating that CXCL10-Fc also induced these cells in the periphery, but the most significant result is at the tumor site where the relative tumor-specific CD8+ T cells are comparatively high (Supplementary Figure S3E). Intracellular cytokine staining further confirm the IFN-γ signature (Supplementary Figure S3G) described above. Finally, Ki67 staining of NK cells showed a significant increase at the tumor site, but not the spleen (Supplementary Figure S3H). It is, therefore, possible that the effect of CXCL10-Fc on NK cells is indirect and is in response to the high levels of IFN-γ, IL-2, and other cytokines at the tumor site.
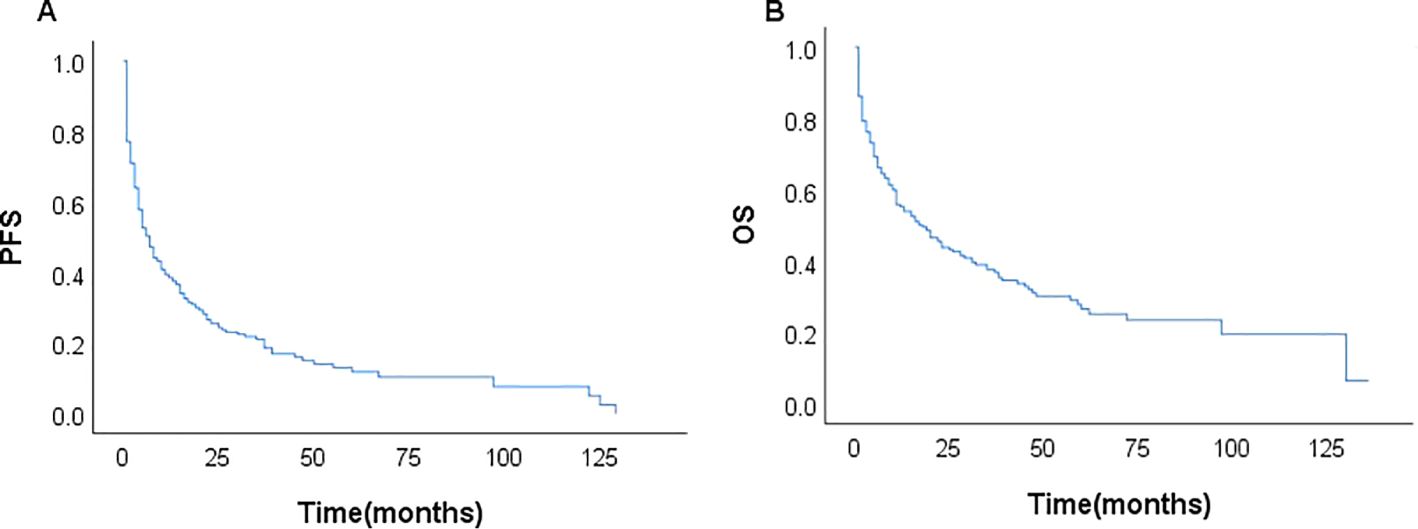
Exploring CXCL9-Fc and CXCL-10-Fc immunotherapy in immunocompetent Balb/C miceWe further explored CXCL9-Fc and CXCL10-Fc therapy in the CT26 colon cancer model in WT Balb/C mice. These mice fully express functional CXCL9, CXCL10 and CXCL11. CXCL10 is also produced by the cancer cells (Supplementary Figure S2C) [see also (46)]. In the first set of experiments, a relatively low dose (50µg/mouse) of CXCL9-Fc or CXCL10-Fc was administered, starting 3 days after tumor engraftment (Figure 7A). Both agents significantly inhibited tumor growth (panels b and c, day 20 p<0.01) and increased survival (panel d) with an advantage to CXCL10-Fc (Log Rank – test p=0.0567). To follow the fate of CXCL9-Fc and CXCL10-Fc 24h post systemic administration, histological sections from the liver, spleen, or tumor site of representative mice injected with either control-Fc, CXCL10-Fc or CXCL9-Fc, were subjected to immunostaining with α-cMyc (included in the recombinant proteins), showing that CXCL9-Fc and CXCL10-Fc could be identified at the spleen and tumor site (where CXCR3+ T cells are present), but not in the liver (Figure 7A, e).
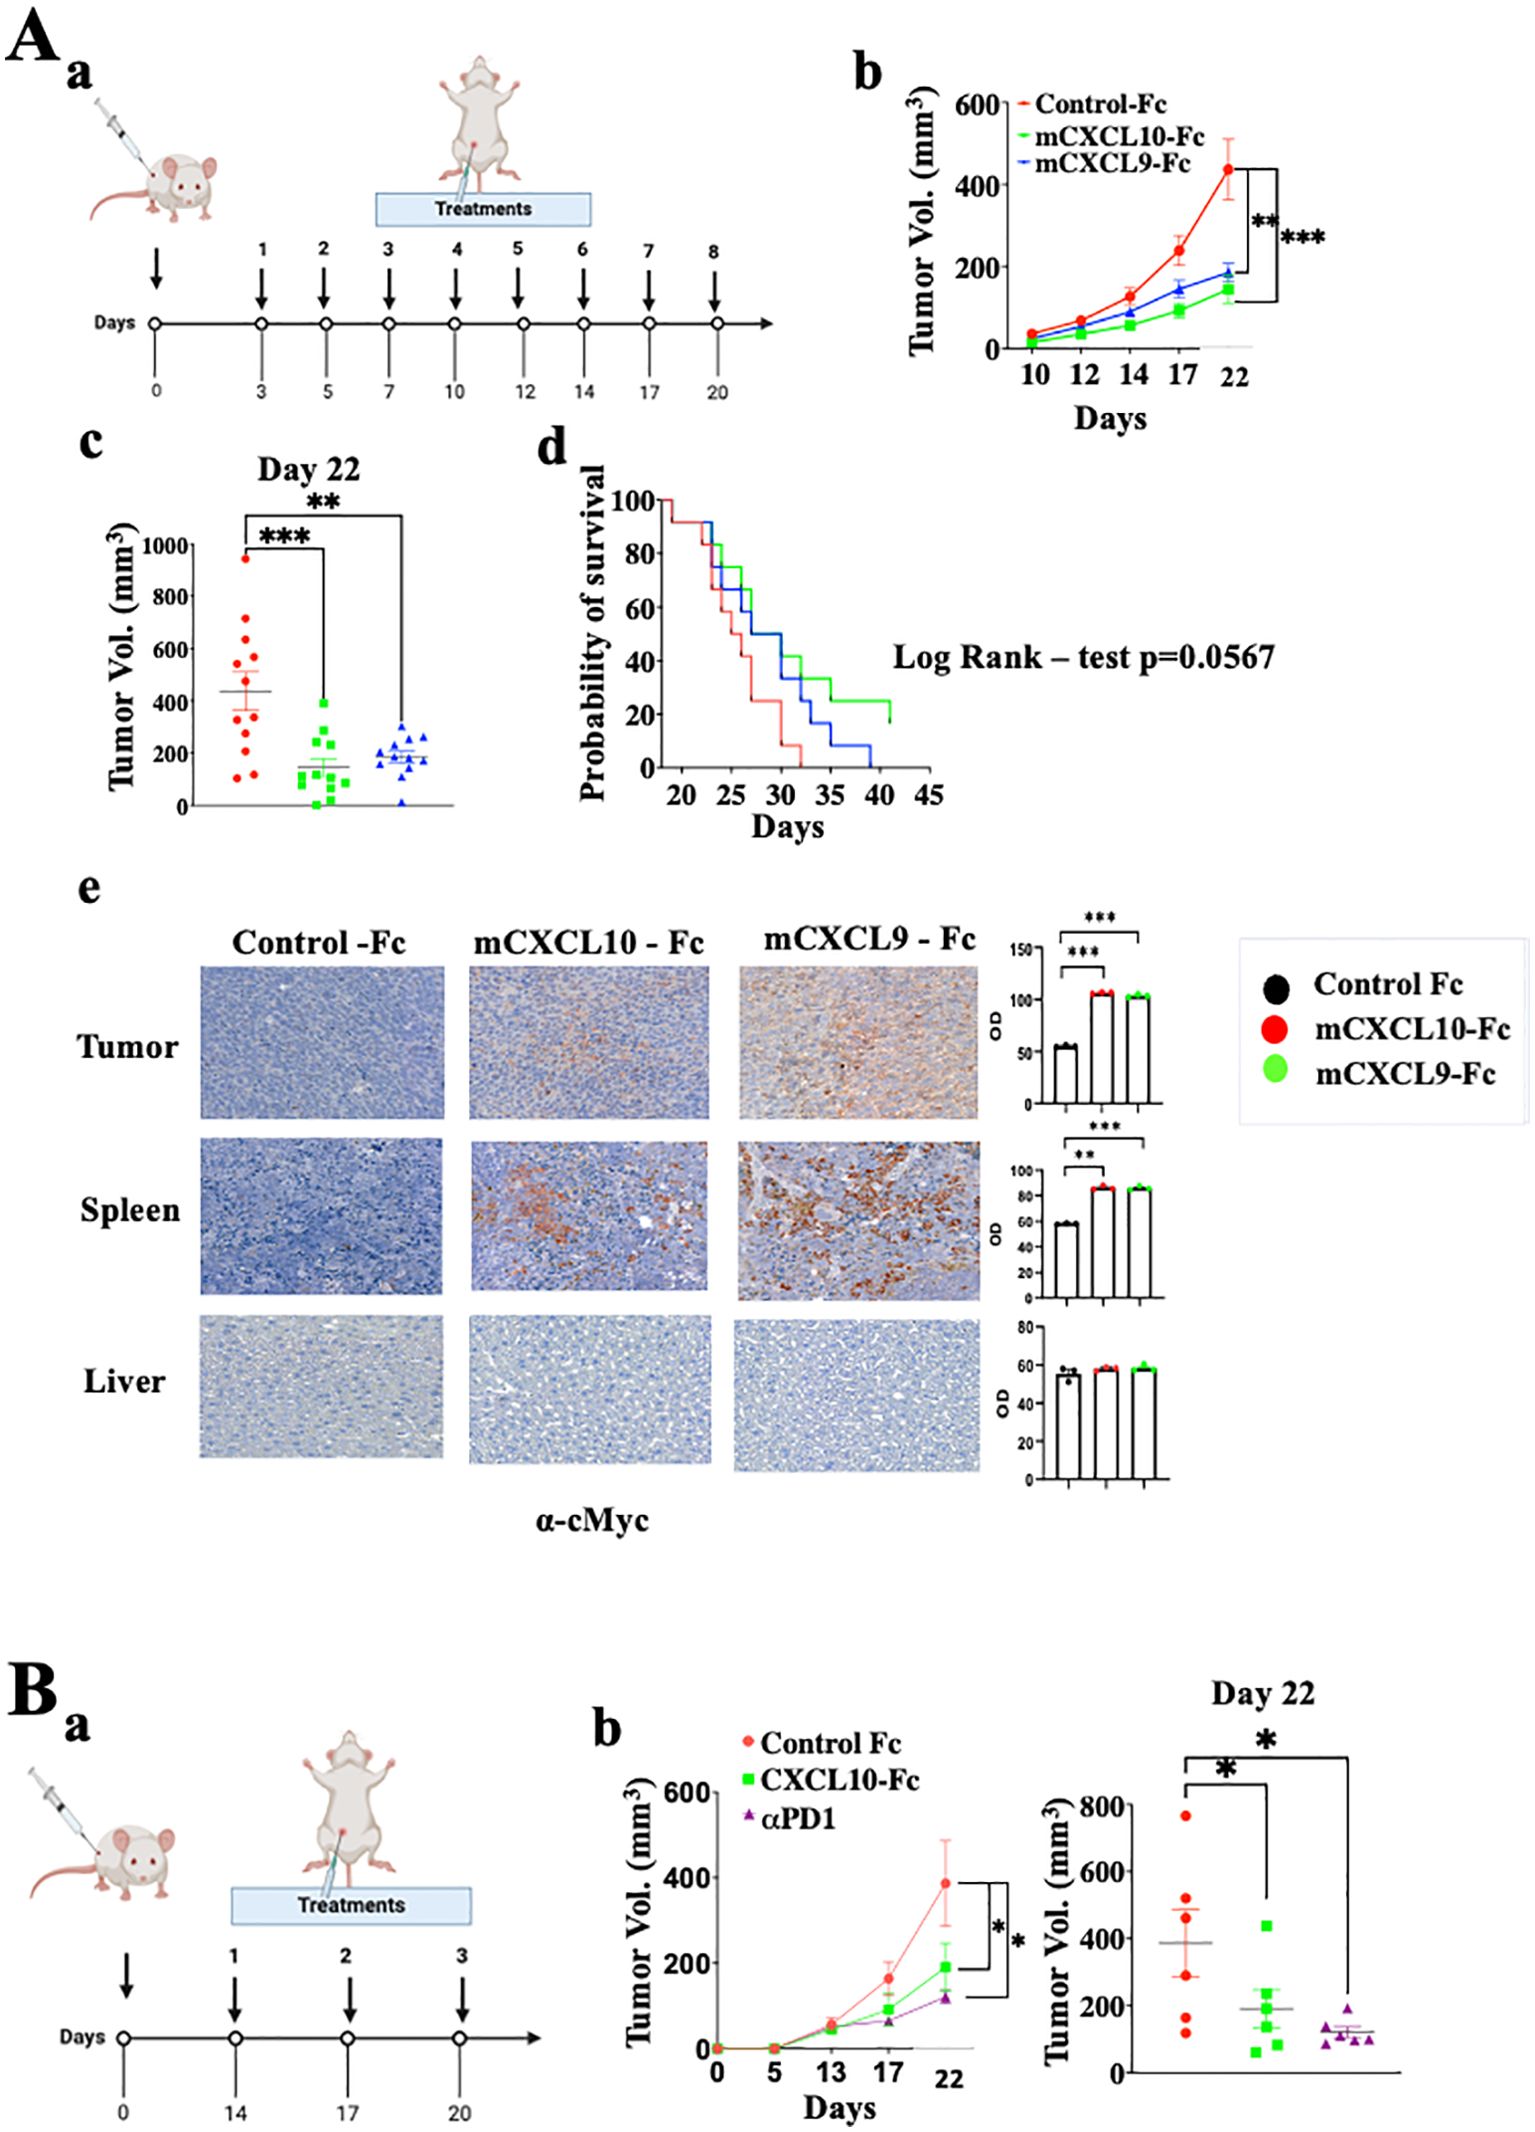
Figure 7. CXCL9-Fc and CXCL10-Fc limit tumor progression in CT26 colon cancer model. (A) Tumor progression kinetics in Balb/C mice treated with CXCL10-Fc or CXCL9-Fc. Balb/C mice were injected subcutaneously with 0.5x10⁶ CT26 cells at the right flank followed by treatment initiation with 50µg/mouse of either CXCL10-Fc or CXCL9-Fc three days post-tumor engraftment, along with a control group. (a) Dosing schedule: illustration of the treatment regimen. (b) Tumor progression kinetics. (c) Scattered analysis on day 22. (d) Survival curve with log rank test analysis. (e) Histology analysis of CXCL10-Fc, or CXCL9-Fc expression compared to control-Fc group using α-cMyc Ab. (B)Tumor progression rate in Balb/C Mice treated with CXCL10-Fc, or αPD-1. Balb/C mice were injected subcutaneously with 0.5x10⁶ CT26 cells at the right flank. When tumor size reached about 50 mm3 they were separated into three identical groups of six mice each and treated with 200µg/mouse of either CXCL10-Fc, 100µg/mouse of αPD-1, or with control Fc. (a) Dosing schedule: illustration of the treatment regimen. (b) Tumor progression kinetics. (c) Scattered analysis on day 22. Results of panel (A, B) are presented as mean ± standard deviation. Each represents two independent experiments with similar data. In each experiment scoring was done by an observer blind to the experimental protocol. Significance is determined using a one-way analysis of variance (ANOVA) test using Tukey’s multiple comparisons test; *P≤ 0.05, **P≤ 0.01, ***P≤ 0.001 were considered significant.
Finally, to further expand CXCL10-Fc therapy, it was administered three times, starting when tumor size reached vol of 50mm3. An anti-PD-1 mAb was used as a positive control. Figure 7B shows that both equally and significantly limited tumor growth.
DiscussionThe current study explores the interplay between CXCR3 and the two key immune checkpoint molecules, PD-1 and CTLA-4, aiming to elucidate the reports that checkpoint blockade is ineffective in the absence of CXCR3 (19, 47). Using an orthotopic model of melanoma, we observed that CXCR3KO mice displayed low responsiveness to anti-PD-1 and anti-CTLA-4 immunotherapy. Several recent studies further support these findings: Chow et al. showed, in a model of MC38 colon cancer, that CXCR3KO mice display low responsiveness to anti-PD-1 therapy (19); Ware et al. reported that the effect of anti- CTLA-4 combined with IL-6 therapy on pancreatic cancer is reduced when CXCR3 is blocked with an antibody (47). Finally, House et al. reported that antibodies to CXCR3 limit anti-CTLA-4 efficiency in the C57BL/6 mouse breast carcinoma following engraftment with AT-3 tumor line overexpressing OVA (48). Collectively these accumulating data indicate, not only a pivotal role of the CXCR3 axis in anti-cancer immunity, but also that one of the major mechanisms by which the immune ICB function is via the CXCR3 axis. This does not contradict the well-documented role of the PD-1 axis in regulating the transformation of exhausted T cells (TEX) into effector T cells (49–51). Anti-PD-1 therapy can convert TEX into effector/cytotoxic T cells, thereby increasing the relative number of T cells that are potentiated via the CXCR3 cycle.
To explain the findings presented here and of others observing that CXCR3KO mice display reduced response to anti-PD-1 and anti-CTLA-4 checkpoint therapy (19, 47, 48), we suggest two different mechanisms that potentially occur simultaneously. The first, established in the current manuscript, suggests that one of the key roles of PD-1 and CTLA-4 is to regulate the CXCL10/CXC9-CXCR3 interplay that promotes effector/cytotoxic T cell functions in a CXCR3-CXCL10/CXCL9-IFNγ feedback loop. This may also explain why patients that are either CXCL9 or CXCL10 low are poor responders to anti-PD-1 therapy, as opposed to those that are CXCL9 or CXCL10high (13–19). A second possible mechanism relates to crosstalk between the PD-1 or CTLA-4 axis and the CXCR3 axis. The latter needs to be further explored.
The two complementary key questions that the current manuscript asks are: (1) What is the mechanism by which CXCL9 and CXCL10 potentiate effector/cytotoxic CD4+ and CD8+ T cells? and (2) whether the administration of CXCL9-Fc or CXCL10-Fc could amplify these effects The second question holds much relevance for combination therapy consisting of ICT and CXCL9-Fc/CXCL10-Fc. The observations that PD-1 and CTLA-4 are key regulators of the CXCR3-CXCL9/CXCL10 axis, which may explain in part why patients that are either CXCL9 or CXCL10 low are poor responders to anti-PD-1 therapy, as opposed to those that are CXCL9 or CXCL10high, could have clinical implications for personalized therapy, and may extend the degree of responses to these immune checkpoint inhibitors. The relevance of the CXCR3-CXCL9/CXCL10 axis to other ICT including TIGIT, LAG-3, and TIM-3 has yet to be studied.
The most relevant human cancers in this context are melanoma, non-small cell lung cancer (NSCLC), ovarian cancer, gastric cancer, and colorectal cancer, where high levels of CXCL9/CXCL10 indicate favorable prognosis and low levels poor prognosis (13–19). The response to ICT in melanoma patients correlates to CXCL9/10 expression levels in blood or at the tumor site) (18, 19). Likewise, NSCLC patients with high plasma levels of CXCL9 and CXCL10 displayed better responses to anti-PD-1 or anti-PD-L1 therapy (13). It should be noted that some melanoma patients receive combination treatments with anti-CTLA-4 and anti-PD-1 mAbs, and yet almost 50% of them show negligible responses (2). It is possible that adding CXCL9-Fc/CXCL10-Fc to the existing antibody therapy would enhance responses in these patients. One possibility for identifying candidates for CXCL0-Fc or CXCL10-Fc therapy would be to culture patient biopsies (52, 53) and examine whether the addition anti-PD-1 or anti-CTLA-4 mAbs increase CXCL10 and CXCL9 levels, using an experimental set-up similar to that represented in Figure 4.
Our data suggest a potential use of CXCL9-Fc and/or CXCL10-Fc for cancer immunotherapy. CXCL9-Fc and CXCL10-Fc could be administered i.v., for example, during early clinical development stages. In our study, repeated administration was i.p. Future studies will compare the two routes of administration. One of the potential limitations of biological drugs that enhance anti-tumor immunity is the risk of toxicity. This issue can be carefully addressed in pre-clinical studies. One optional possibility that would be considered in case of toxicity is mutating CXCL10 and the development of less toxic variants as has recently been done for IL-2 (54).
The in vitro studies presented in Figures 2, 3 and the ex vivo analyses presented in Figures 5, 6 show that the direct effects of CXCL9 and CXCL10 include skewing of CD4+ and CD8+ T cell polarization into IFN-γhigh T cells, including IL17high CD4+ T cells (Th17) and IL17high CD8+ T cells (significant in the in ex vivo model), also known as Tc17 cells, which are thought to play a major role in combating cancer (38). Both CXCL9 and CXCL10 induced rapid proliferation (ki-67) and IL-2 production by both CD4+ and CD8+ T cells, with a marked increase in tumor-specific (TRP2-specific) CD8+ T cells, and an increase in granzyme-B+ CD4+ T cells, which may explain in part the efficacy of the adoptive transfer studies in which CXCL10-Fc and CXCL9-Fc limit tumor progression in CXCR3KO mice that are reconstituted with CXCR3+ CD4+ T cells (Figure 6B). Such cytotoxic CD4+ T cells appear to play a key role in limiting tumor progression, particularly those in which tumor antigens are presented by MHCII on cancer cells, among them bladder cancer (55) and melanoma (56). Likewise, the adoptive transfer of CXCR3+ CD8+ T cells into CXCR3KO mice enabled response to CXCL10-Fc (Figure 5E), showing that the direct effect on CD8+ T cells induced by CXCL10-Fc is sufficient to restrain tumor growth.
The increased expression of PD-1 on both CD4+ and CD8+ T cells in cultures supplemented with CXCL9 or CXCL10, and upregulation of PD-1 on these cells in vivo following CXCL9-Fc and CXCL10-Fc therapy, may suggest that the CXCL9/CXCL10 interaction with CXCR3 that potentiate effector/cytotoxic T cells is partially regulated by this increase. The increased expression of PD-1 following CXCL10-Fc therapy is not associated with any increase in other inhibitory receptors including HAVCR2 (TIM3) and TIGIT, that may indicate increase in CD8+ T cell exhaustion (43, 44), indicated that. In addition, we examined the effect of CXCL10-Fc on the expression of CD44 and Ly6C, which are highly expressed on effector CD8+ T cells, and to a much lesser extent on exhausted T cells (45). Collectively our results show that the chemokine therapy described here does not increase T cell exhaustion, but on the contrary, may further induce effector/cytotoxic T cells. Notably, these therapies led to a marked decrease in TIM3, which may be part of the mechanism of T cell potentiation.
According to our results it is likely that CXCL9 and CXCL10 possess very similar activities, differing mainly by the cells that produce them. CXCL9 is mainly produced by macrophages and DC, particularly CD106+ DC (19), whereas CXCL10 is mainly expressed by effector T cells and, in a wide range of tumors, by the cancer cells themselves. The importance of CXCL10 produced by the cancer cells has been emphasized by a recent study comparing response to anti-PD-1 using colon cancer cells that are CXCL10high (CT26), and CXCL10low (Colon 26), showing that only the first respond to anti-PD-1 treatment (46). Furthermore, CXCL10KO mice did respond to anti-PD-1 when the engrafted tumor cells were CXCL10high (MC38) (19).
Collectively, this manuscript suggests that the CXCL9/10-CXCR3 axis is important, not merely in the trafficking of T cells to tumors (57), but even more so in the polarization, potentiation, and proliferation of these cells, and the self-feeding loop that further promotes their activities. This may also explain why peripheral (systemic) administration of CXCL9-Fc or CXCL10-Fc limits tumor growth even though systemic administration of these agents would be expected to compromise the chemokine gradients that allow the endogenous CXCR3 ligands to attract T cells into the tumors. Finally, and most importantly, the manuscript brings compelling evidence implying a pivotal role for the PD-1 and CTLA-4 axes in regulating the CXCR3/CXCL9/10, leading to the induction of effector/cytotoxic T cells. The role of other known ICI in the regulation of this axis has yet to be studied.
Materials and methodsMouse strains and maintenanceIn all experiments, 8-10 weeks old female mice were used. C57BL/6 (WT) and Balb/C (WT) mice were purchased from Harlan (Israel). CXCR3KO mice, CXCL10KO mice, OTII mice, and OTI mice were purchased from JAX lab (Bar Harbor, Maine). All mice were maintained under individually ventilated caging systems (IVC). All experiments were approved by the Technion Committee for Care and Use of Laboratory Animals which operates under the NIH guideline (Technion animal experimentation protocol No: IL-072-05-2021, valid until June 2025).
Cell lines and cultureRet (murine melanoma cell line) was kindly provided by Prof. Neta Erez from Tel Aviv University, with permission of Prof. Viktor Umansky (DKFZ). CT26 (murine colon cancer cell line) and MC38 colon cancer cell line were purchased from ATCC. Cells were routinely tested for mycoplasma contamination and maintained under 37°C and 5% CO2 conditions in RPMI Medium 1640 (Gibco, Rhenium, Israel, Cat. 21875034). Cho-Ki cells were purchased from Perkin Elmer (USA) and maintained under 37°C and 8% CO2 conditions in F-12 (Nutrient Mixture F-12(Ham), Gibco, Rhenium, Israel, Cat. 21765029). All media were supplemented with 10% fetal calf serum (Fetal Bovine Serum Heat Inactivated, Merck Life Science, Israel, Cat. F9665-500ML), 1% L-glutamine (Gibco, Rhenium, Israel, Cat. 25030024), and 1% Pen-Strep solution (Gibco, Rhenium, Israel, Cat. 15140122).
Tumor engraftmentRet and CT26 cells were collected after trypsinization, washed with PBS, and resuspended in 100µl PBS per mouse (4.5x10⁵/100μL in PBS). Cells were injected subcutaneously into the right flanks of 6–8 week-old female C57BL/6, or BALB/c mice. In all experiments, when tumors reached a volume of ∼50 mm3, mice were randomized into different experiment groups, monitored daily for evidence of illness, and treated with mouse anti-PD-1 (clone RMP1-14, BioXCell Cat. BE0146), mouse anti-CTLA-4 (clone 9H10, BioXCell Cat. BE0131) antibodies or mouse CXCL10-Fc and CXCL9-Fc proteins. Control groups were treated with IgG isotype control (BioXCell Cat. BE0089). Tumor volume was measured manually using an electronic caliper. Tumor volume was calculated using the formula π/6 × a × b × c, where a represents the length, b represents the width, and c represents the height of the tumor (58).
Western blottingProtein samples were separated on 4%-20% SDS-PAGE mini gels (GeneScript) and transferred to nitrocellulose membranes using a semi-dry blotter (Trans blot Turbo transfer system, Biorad) at 1.3A/25V per mini gel for 7 min, in transfer buffer (250mM Glycine, 25mM Trizma base, 20% methanol). The membrane was blocked with 1% BSA in PBS for 1h at room temperature (RT) and incubated with 1:5000 anti-HIS tag HRP-conjugated primary antibody, diluted in blocking solution. The membrane was shaken for 2 hours at RT, followed by three washes with TBST (150mM NaCl, 20mM Tris-HCl pH=8, 0.1% Tween 20), incubated for 1 min in EZ-ECL solution (Advansta K-12045-D20) and developed on VILBER Fusion FX7 Machine.
Cytokines quantification by indirect ELISA (sandwich)Cytokine concentrations in culture media were assessed using commercial ELISA kits: Murine IP-10 (CXCL10) Standard ABTS ELISA Development Kit, (900-K153, Peprotech), Human IP-10 (CXCL10) Standard ABTS ELISA Development Kit (900-K39, Peprotech), ELISA Kit for MOUSE CXCL9 (UCSN SEB928Mu), Human MIG (CXCL9) Standard ABTS ELISA Development Kit (900-K87, Peprotech) and Murine IFN gamma Standard ABTS ELISA Development Kit, (900-K98, Peprotech) according to manufacturer’s instructions.
Spleenocyte isolation and activationCD4+ and CD8+ T cells were isolated from whole spleens by EasySep™ CD4+ (StemCell Technologies, Cat. 19852A) or CD8+ (StemCell Technologies, Cat. 19853A) T cells enrichment magnetic beads according to manufacturer standard protocol. Spleenocytes were activated with 5 µgr/ml of anti-mouse CD3ϵ (Biolegend Cat. 100302), 3 µg/ml of anti-mouse CD28 (Biolegend Cat. 102116) and 10 ng/ml of Murine IL-2 (Peprotech Cat. 212-12-20). They were separately cultured in vitro in DMEM media.
TIL isolationTIL isolation was performed as follows: 1 gram of tumor tissue was cut into ≤ 5mm pieces, transferred into a GentleMacs tube (Cat. 130-096-334 purple cap) containing 5ml of cold RPMI 1640 medium, supplemented with 20% FCS, 2% P/S and run on the GentleMacs device, using the program: m_impTumor_02*, for three times. 75 µl of freshly prepared collagenase I solution (Sigma, Cat. c0130) and 150 µl Dispase II solution (Roche, Cat. 04942078001) were added to the minced tissue and incubated at 37°C, on a shaker 110rpm, 40min. The tubes were run again on the GentleMacs device, using the program: m_impTumor_04*, three times.
The liquid was passed through a 40µm cell strainer (Bar Naor, Cat. BN93040S), washed with cold PBSx1, and completed the volume to 25ml with cold PBSx1 in a 50 ml tube. The solution was centrifuged at 1500 rpm for 5 min at 4°C and then resuspended with 5 ml of cold RBC lysis (41.4 gr NH4Cl buffer, 5 gr NaHC03, 0.189 gr EDTA, 500 ml DDW), vortexed and incubated for 7 min at RT. 45 ml of cold PBSX1 was added to the tube, centrifuged at 1500 rpm, for 5 min, at 4°C, and then resuspended with the FACS buffer (500ml PBSX1, 10 ml FCS, 10 ml 50Mm EDTA)/medium for further procedure. Spleenocyte isolation was performed as follows: a spleen was minced in 10 ml of cold PBSX1 using a 40µm cell strainer (Bar Naor, Cat. BN93040S), centrifuged at 1500 rpm, for 5 min, at 4°C and resuspended with 0.5 ml of cold RBC lysis buffer (Rhenium, Cat. 00-4333-57), for 20 seconds at RT. The final volume was completed to 10 ml with PBSX1 and centrifuged again under the same conditions. The pellet was resuspended in 2 ml of FACS buffer for further analysis.
Flow cytometry acquisition and analysisBefore immunostaining, cells were plated at a density of 1x10⁶ cells/well in an appropriate medium and stimulated for 4-6 hours under 37°C and 5% CO2 conditions with Cell Activation Cocktail (Biolegend 423303). Tumor and spleen cells were immuno-stained for the following surface and intracellular markers. Cell permeabilization was carried out using the BD Biosciences kit (BD Biosciences 554714) according to the manufacturer’s instructions. All monoclonal antibodies were purchased from BD Biosciences and BioLegend. Flow cytometry data was acquired on BD LSRFortessa using and analyzed with FlowJo V.10 software (FlowJo, Ashland, Oregon, USA).
Paraffin embedding of tumor, spleen, and liver tissuesTumor and spleen tissues were immediately fixated in 4% formaldehyde PH=7.2 overnight, the next day they were placed in tissue cassettes and kept in ethanol 70% overnight. The next day, tumor tissue was subjected to the processes of dehydration - three exchanges of ethanol 95% (20min each), three exchanges of ethanol 100% (20min each), clearing - two exchanges of chloroform (10min each), and embedding - two exchanges of paraffin (1h each, 60°C), followed by a third exchange of paraffin overnight. Tumor tissue was then molded into paraffin blocks and 5µm sections were cut, and were let dry overnight at 37°C until stained.
Immunohistological stainingSlides were de-paraffinized at 60°C for 1 hour and incubated in K-Clear solution for 2 repeats of 5 min each and in 100% EtOH for 2 repeats of 5 min each. Endogenous peroxidase blocking was performed using freshly prepared 100% methanol with 1% H2O2, followed by 1-2 min wash in 70% EtOH and 3x rinsing with double distilled water. (DDW). Antigen retrieval was performed by microwave boiling the slides in 10 sodium citrate buffer, pH 6 for 22 minutes. The slides were slowly cooled down to RT and washed twice with PBS. Blocking was performed using 10% goat serum for 1 hour at RT. Following blocking, slides were incubated with primary antibodies overnight, at 4°C. On the next day, the slides were washed 4x5 min in PBS. 2-3 drops of HISTOFINE Simple Stain Max Po (Multi) Universal Immuno peroxidase Polymer anti–rabbit/mouse (Nichirei) were added followed by 1-hour incubation, RT. Slides were then washed 4x5 min in PBS and then incubated with HISTOFINE Simple Stain AEC Solution (10 min, RT) (Nichirei), and then washed until clear and then counter-stained for 30 sec with hematoxylin. Slides were then washed and left in DDW for 10 min at RT, and then mounted and sealed with mounting medium (Immuno Mount, Thermo Shandon). Statistical analysis was performed using Fiji software.
Calcium assayCalcium assay was performed in CHO cells which overexpress human CXCR3A. GPCR stimulation with a CXCR3A ligand induces Ca++ flux. The assay is based on a reporter system that includes calcium binding to the aequorin oxidation of coelenterazine which leads to the emission of light (469nm). Ca++ flux in CHO cells was induced by 100 ng of CXCL10 (Peprotech) and CXCL9 (Peprotech) chemokines and detected using the Calcium Assay Kit (Zotal, AB-ab112114-10). The OD measurements were performed on a plate reader (Infinite M200 PRO).
Adoptive
留言 (0)