
記住我

Juvenile X-linked retinoschisis (XLRS), a vitreoretinal disorder, is the leading cause of macular dystrophy in young males, with a global prevalence of up to 1 in 5,000 individuals (1). The pathology of the disease involves an X-linked recessive mutation in the retinoschisin-1 (RS1) gene located at Xp22.1–p22.3 (1). Mutations in RS1, of which there are greater than 200 known, impair production of the 224 amino acid protein, retinoschisin-1 (RS1) (1). RS1 is primarily secreted by photoreceptors and bipolar cells, and influences cell–cell interactions through a ubiquitous discoidin domain, facilitating photoreceptor-bipolar cell signaling, and stabilizing the extracellular environment of the retina (2, 3). In the absence of functional RS1, the laminar architecture of the retina becomes disrupted, causing retinal layer separation, known as schisis, and the formation of retinal cysts. Cysts, a hallmark of XLRS, spatially divide the inner nuclear and outer plexiform layers, separating the bipolar cells and photoreceptors. This separation impedes electrical transduction in the retina, leading to a characteristic waveform in electroretinography (ERG) termed an electronegative ERG, in which the ascending b-wave does not exceed the baseline.
From a clinical perspective, almost all patients with XLRS experience foveal involvement, impairing central vision (4, 5). Comparatively, around 50 percent of patients also exhibit peripheral involvement (2, 4). The progressive impairment of central vision due to macular atrophy can result in substantial functional vision loss. Additionally, the development of schisis significantly increases the risk of vitreous hemorrhage and full thickness retinal detachment, especially following even mild ocular trauma (4). Strategies to manage cyst severity are needed.
Currently, carbonic anhydrase II inhibitors (CAIs) serve as the primary medical therapy available for patients with XLRS. The proposed mechanism of CAIs involves inhibition of membrane-bound carbonic anhydrase (CA) in the retinal pigment epithelium (6). Fluid transport from the subretinal space into the choroid is enhanced experimentally following introduction of a carbonic anhydrase inhibitor (CAI), acetazolamide, suggesting CA is involved in maintaining fluid homeostasis of the retina (6). However, despite their efficacy in reducing intraretinal cyst formation in some patients, systemic CAIs are associated with well-known systemic side effects affecting the endocrine, gastrointestinal, cardiovascular, and central nervous systems, while there is often poor compliance with topical CAIs, especially in children (7–9).
While CAIs have shown short term benefits including mild decrease in central macular thickness, reduction of intraretinal cyst formation, and improved vision, it is not known whether they prevent the long-term progression of XLRS (8). Additionally, several studies have reported limited effects on retinal morphology or functional benefit, leading to inconsistent use of CAIs across different treatment centers (5, 10).
Sudden discontinuation of topical brinzolamide, a commonly used CAI in clinical practice, can lead to increased cyst formation and elevated intraocular pressure during periods of drug holiday (8, 9). There are currently no studies demonstrating long-term efficacy or safety, and CAIs are at best a treatment with variable efficacy, not a cure.
Given the lack of effective long-term therapy, ongoing efforts in gene therapy have emerged as a potential avenue for treatment. A Phase I/IIa trial was conducted on human subjects which involved a single intravitreal injection of an AAV8 vector carrying the RS1 gene (11). This safety study was introduced after good success in a mouse model; however, in human subjects, several ocular inflammatory outcomes were recorded (11). An additional human study utilizing an AAV2 vector to deliver intravitreal RS1 also reported inflammatory outcomes (12).
Compared to intravitreal injections delivering equivalent doses of AAV, subretinal injections elicited lower levels of humoral immune reactions both in mice and in primates (13). In our study, we investigate whether a subretinal injection of low-dose adeno-associated virus, AAV2/4-EF1α-RS1, can rescue the retinal phenotype with reduced risk of vector toxicity and ocular inflammation. In this study, we subretinally administered a low dose AAV2/4-EF1α-RS1 gene therapy to Rs1-KO mice, a model for XLRS. To account for the potential effect of the subretinal injection procedure, a control group receiving a subretinal injection of a hypertonic buffer, similar in osmolarity to the AAV storage buffer, was included.
We hypothesized that subretinal injections of low dose AAV2/4-EF1α-RS1 could correct the retinal phenotype in the Rs1-KO mouse detectable by electroretinography (ERG), optical coherence tomography (OCT), and a visually guided swim assay (VGSA). However, our experiments revealed an unexpected therapeutic effect of the buffer, including cyst reduction accompanied by long-term ERG improvement, constituting a novel finding in XLRS.
2 Methods 2.1 Study designNatural history, as well as gene therapy efficacy and effect of subretinal buffer injections, were evaluated in a mouse model of juvenile X-linked retinoschisis (Rs1-KO). The natural history of this Rs1-KO mouse model has been previously reported, including the variable expressivity of the phenotype (14). We examined treatment-naïve eyes from postnatal day (p) 15- to 12-months of age. OCT images were analyzed for both outer nuclear layer (ONL) thickness and cyst severity.
To study the effect of gene therapy, eyes treated with a subretinal injection of gene therapy vector (AAV2/4-EF1α-RS1) (n = 10) were compared to hypertonic buffer-injected eyes (n = 15) and treatment-naïve eyes (n = 30). The hypertonic buffer-injected cohort was initially included to account for the high salt content in the solution where the vector is produced and stored, as part of the standard formulation to prevent viral clumping. Injections alternated between the left and right eyes to avoid systematic bias. The selection of an AAV2/4 vector was based on a previously demonstrated tropism for all layers of the retina, including the photoreceptor and bipolar cell layers, the primary secreters of RS1 (15).
Injections were performed between p24 and p31. Outcome measures include ERG, OCT, VGSA, and immunohistochemistry. ERG was performed at 1-, 2-, 3-, and 5-months post injection (MPI) to assess retinal function. OCT was performed at 2- and 3-weeks post-injection (WPI), then 1-, 2-, 3-, and 5 MPI to assess cyst severity and retinal structure. A visually guided swim assay was performed at 5 to 7-months of age to assess functional vision. The eyes were collected and fixed at 6 MPI for immunohistochemistry. For the purpose of ERG and OCT experiments, one eye is considered a biological data point. For the purpose of the VGSA, each data point is representative of the averaged time-to-platform of a mouse for 20 different trials using randomly selected platform positions. Mice were treated in one eye with either vector or hypertonic buffer. Mice treated with gene therapy in one eye and hypertonic buffer in the fellow eye were excluded from the VGSA. Both male (Rs1 hemizygous mutants) and female knockout mice (Rs1 homozygous mutants) were used in this study.
To investigate the effect of the buffer, the subretinal injection of the hypertonic buffer was compared to the subretinal injection of an isotonic buffer and a sham puncture injection group that included a mechanical puncture of the sclera without deposition of a subretinal buffer fluid. Endpoints included ERG and OCT, and the same timelines as stated above were used in this group.
2.2 Animal husbandry and ethics statementThis study was performed in accordance with the recommendations set forth by the National Institute of Health in the Guide for the Care and Use of Laboratory Animals. Animals were handled in accordance with the approved Institutional Animal Care and Use Committee (IACUC) protocol #4031421 at the University of Iowa. The Rs1-KO C57Bl/6J mouse model was kindly supplied by Paul Sieving, M.D., Ph.D. at the National Eye Institute. Generation of the Rs1-KO mouse model was previously described (16). This mouse model contains a deletion of exon 1 and a 1,630 bp fragment of intron 1 on the Rs1 gene (16).
Animals were housed according to the IACUC recommendations. Humane endpoints were observed, and the method of euthanasia used was carbon dioxide inhalation followed by cervical dislocation.
2.3 Statistical analysisAnalysis was performed using GraphPad PRISM 10.0 (GraphPad Software, Inc., San Diego, California, United States). Two-way ANOVA was performed for ERG and OCT metrics and followed by multiple comparisons (Tukey’s test, non-parametric). One-way ANOVA was performed for VGSA and cone density followed by multiple comparisons (Tukey’s test, non-parametric). Simple linear regression was used for correlation of peak cyst area vs. 5 MPI ERG amplitudes.
2.4 Genotyping informationGenotyping was performed using Taq Polymerase (New England biolabs, Ipswich, MA) using the primers listed in Table 1. The PLA2 primer was previously described (16). A 10 microliters (μL) reaction volume was used containing 2 μL of DNA (approximately 25 μg/μL), 3.7 μL of ultrapure water, 1 μL of 10X Buffer/Mg++, 1 μL of 20 mM primer mix (Table 1), 0.2 μL of 50 mM dNTPs, 0.1 μL of rTaq, and 2 μL of 5X Betaine. Cycling conditions are as follows; initial denaturing at 94°C for 30 s, annealing at 57°C for 30 s and extension at 72°C for 30 s, with a final extension step at 72°C for 4 min. This produces a 516-base pair (bp) wild-type band and a 300 bp knockout band.

Table 1. Primers.
2.5 AAV packagingThe human RS1 gene was cloned into a shuttle plasmid pFBAAV and provided by the Viral Vector Core at the University of Iowa. The bacterial backbone is from Invitrogen’s pFastBac system. The shuttle plasmid consists of the pFBAAV backbone, an EF1α promoter, and a bovine growth hormone polyadenylation signal. The plasmid was packaged into an AAV2/4 capsid by the Budd Tucker Laboratory at the University of Iowa. The AAV was formulated at 2 × 10⁹ viral genomes (vg)/mL titer, and the composition of the storage buffer is listed in Table 2. Titering was performed using digital droplet PCR.
Table 2. Buffer solutions.
2.6 Subretinal injectionMice were anesthetized using a ketamine/xylazine mixture (87.5 mg/kg ketamine, 12.5 mg/kg xylazine). A tropicamide ophthalmic solution of 1% was applied 3 min prior to injection to dilate the eyes. Proparacaine was applied as a topical anesthetic and 10% povidone-iodine was applied as a topical antiseptic. A partial thickness puncture was made just posterior to the limbus through the sclera with a 30-G sharp needle, then a 33-G blunt Hamilton needle was inserted and positioned between the RPE and the retina. Two μL of either gene therapy vector at a concentration of 2 × 10⁹ vg/mL, a hypertonic buffer, or an isotonic buffer was injected into the subretinal space (formulation available in Table 2). The injection of a solution subretinally creates a separation of the retina and the RPE known as a subretinal bleb. This bleb was assessed by the injector as seen through the operating microscope and in the rare cases with no visible bleb or a large vitreous hemorrhage, the mouse was excluded. For the sham injection puncture experiment, the same sharp needle was used to make an entry into the eye, then the blunt Hamilton needle was introduced subretinally however no liquid was delivered. Mice with retinal detachments that persisted until the first OCT time point were excluded. The mouse was then given topical ophthalmic ointment consisting of neomycin, polymyxin B sulfates, bacitracin zinc, and hydrocortisone. Mice were injected with atipamezole to aid in recovery from the anesthetic.
2.7 ElectroretinogramDark adaptation occurred overnight, and ERGs are conducted in the morning to control for potential diurnal variations. Mice were anesthetized using a ketamine/xylazine mixture (87.5 mg/kg ketamine, 12.5 mg/kg xylazine). A tropicamide ophthalmic solution of 1% was applied to the eyes for pupil dilation. A 2.5% Hypromellose solution (Akron, Lake Forest, Illinois) was applied to maintain corneal hydration during testing. Testing was performed on the Diagnosys Celeris with integrated heated platform (Diagnosys, Lowell, MA). Electrodes were placed on the cornea of bilateral eyes, and impedance was kept below 10 kΩ. Eyes were exposed to various light intensities in a modified ISCEV protocol (17). To evaluate rod electrical function in treated and untreated Rs1-KO mice, animals were dark-adapted (DA) overnight to isolate the rod response, and eyes were subjected to 15 flashes of 0.01 cd·s/m2 light (0.01 dim flash) then 15 flashes of dark-adapted 3.0 cd·s/m2 standard combined response (3.0 SCR). To evaluate cone electrical function in treated and untreated Rs1-KO mice, eyes were light-adapted (LA) for 10 min to bleach the responses from rods, and subjected to 15 flashes of 3.0 cd·s/m2 light (3.0 flash) followed by 20 flashes of a 5 Hz flickering light of 3.0 cd·s/m2 (5 Hz flicker), which is more reproducible in mice than the standard light-adapted 30 Hz flicker in humans (18). Multiple comparisons were performed between every group at each time point. Non-significant comparisons were not graphed.
2.8 Optical coherence tomographyMice were anesthetized using a ketamine/xylazine mixture (87.5 mg/kg ketamine, 12.5 mg/kg xylazine), and tropicamide ophthalmic solution 1% was applied for pupil dilation. 1% carboxymethylcellulose was applied to maintain corneal hydration during testing. OCTs were conducted in the afternoon to control for potential diurnal variations. Cyst severity in the natural history data (Figure 1) was determined via a modified scoring protocol from previously described literature (19, 20). Briefly, measurements of cyst height were taken at four points equidistant, 500 μm from the optic nerve, two on the superior–inferior line bisecting the optic nerve, and two on the nasal-temporal line bisecting the optic nerve. Measurements were then translated to a scoring scale as previously described, in which a score of 1 was assigned to zero cyst height and a score of 6 was assigned to cyst height >100 μm. The score was averaged across all four points (20).
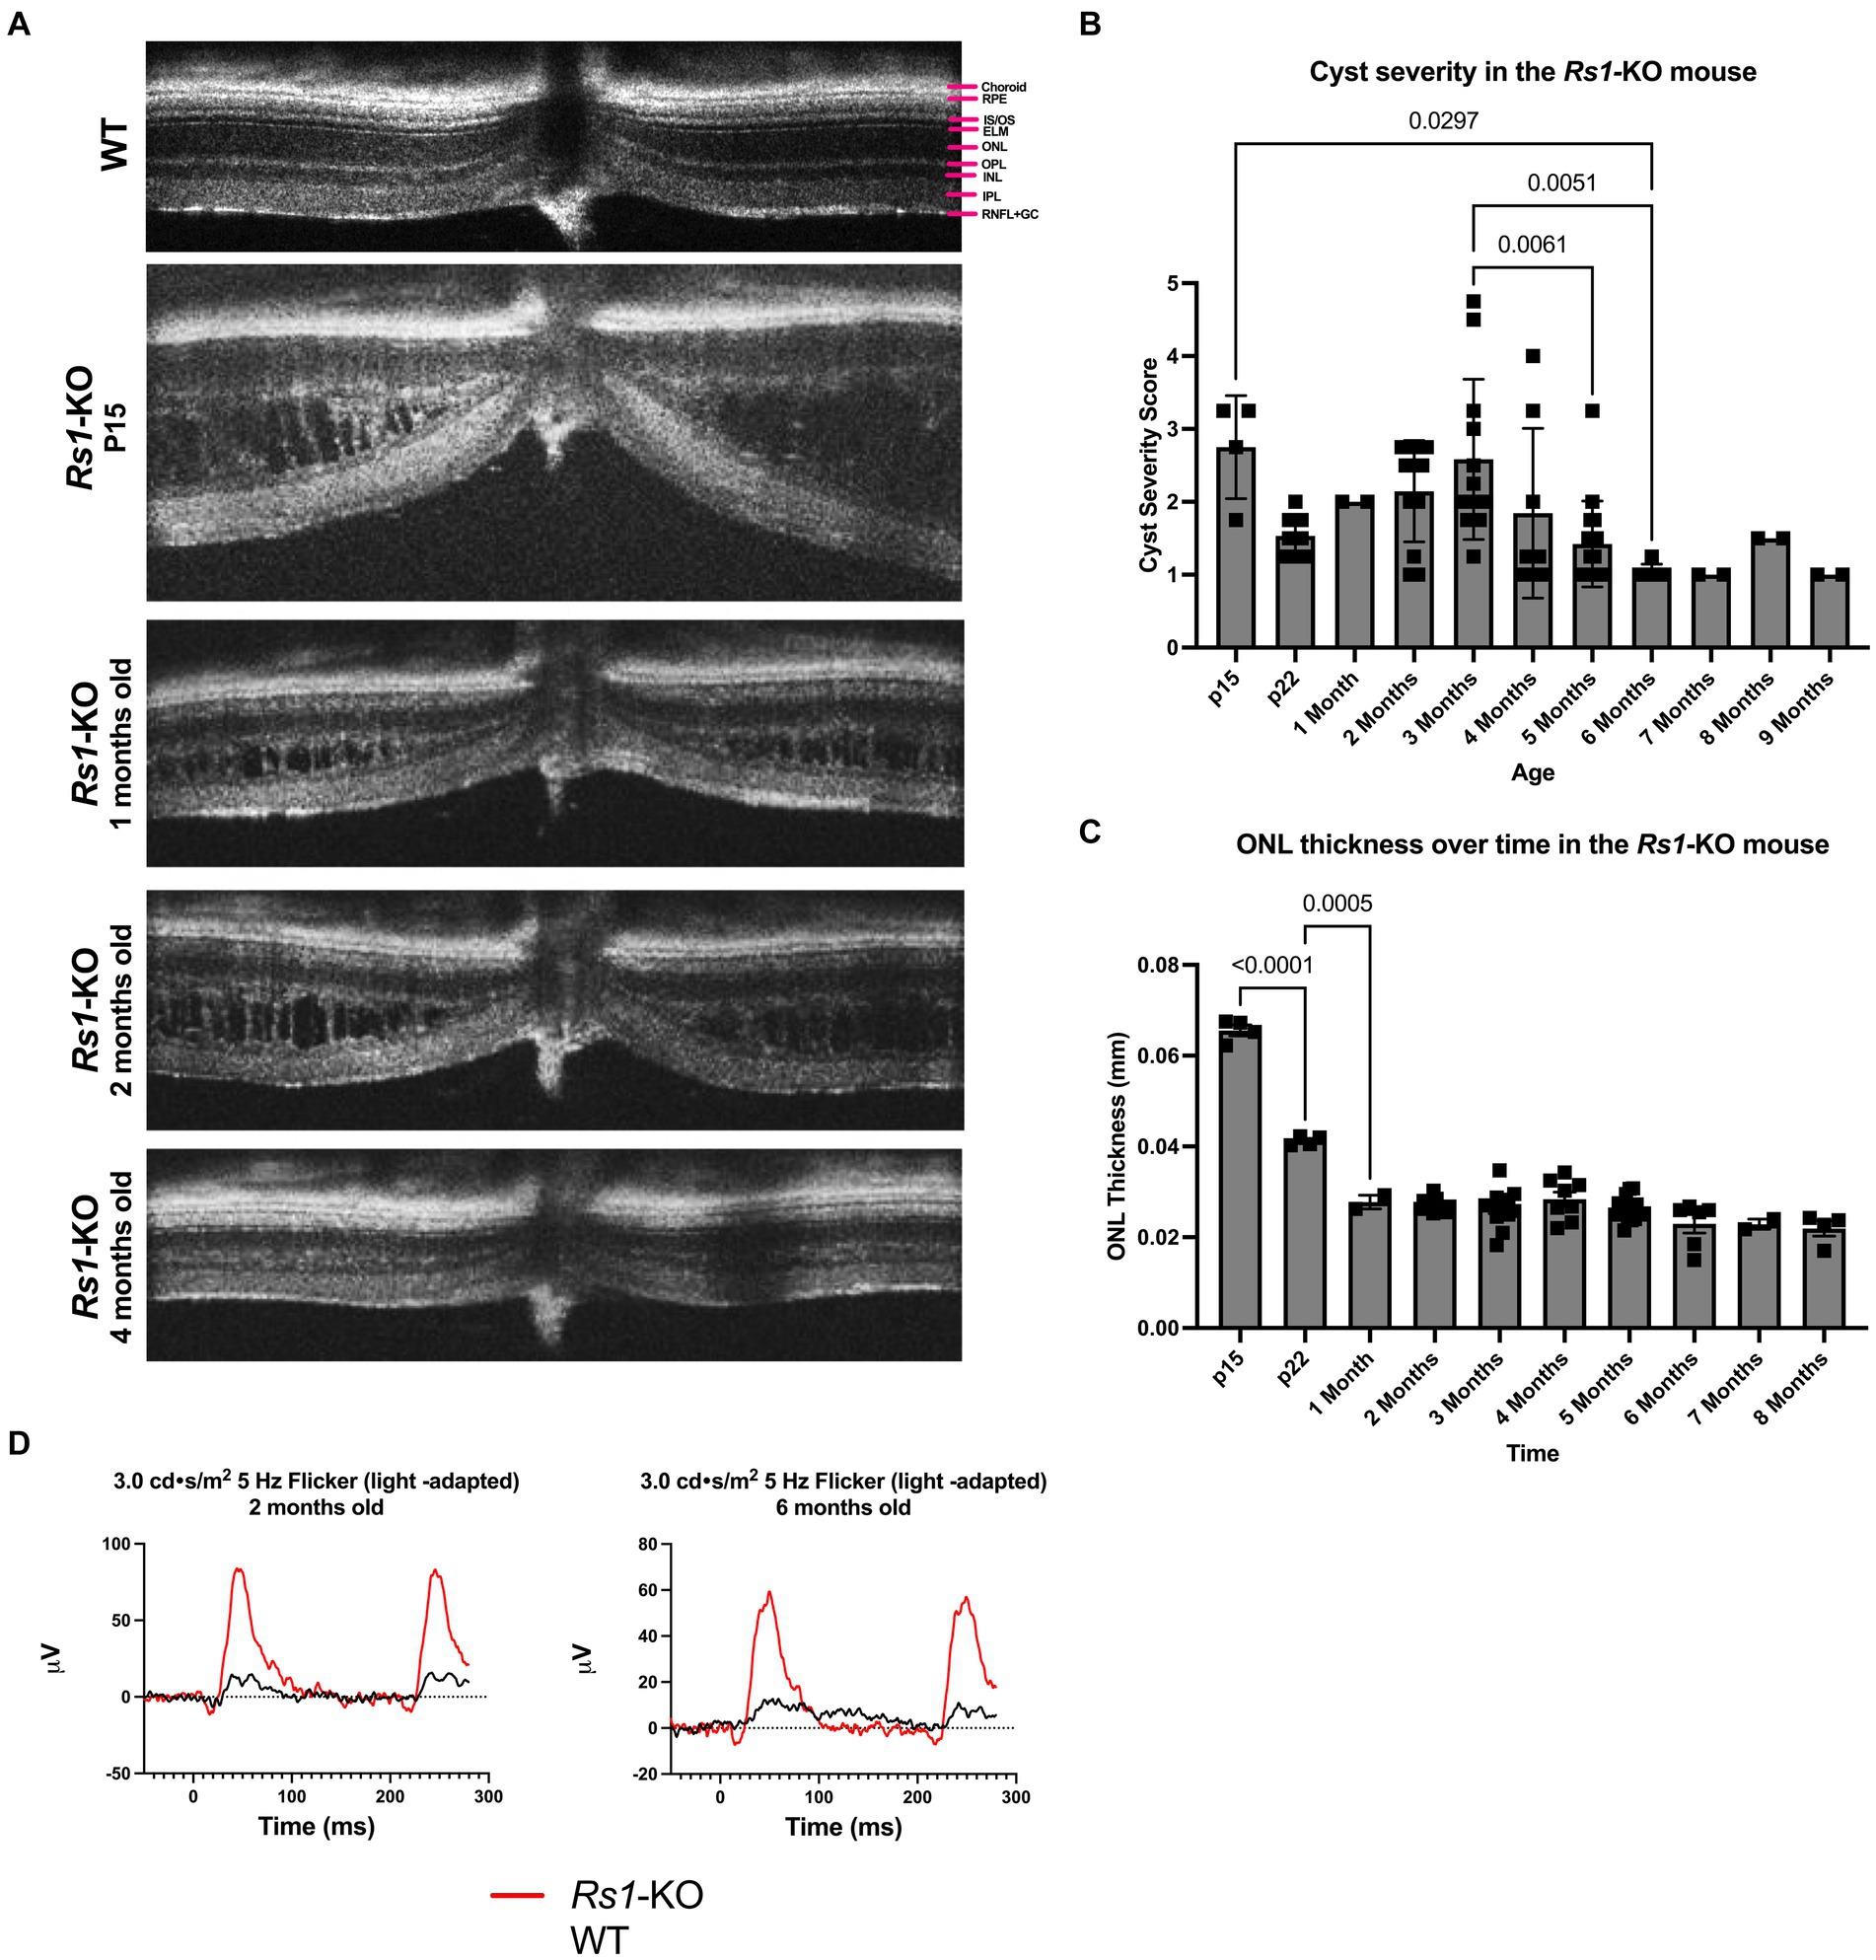
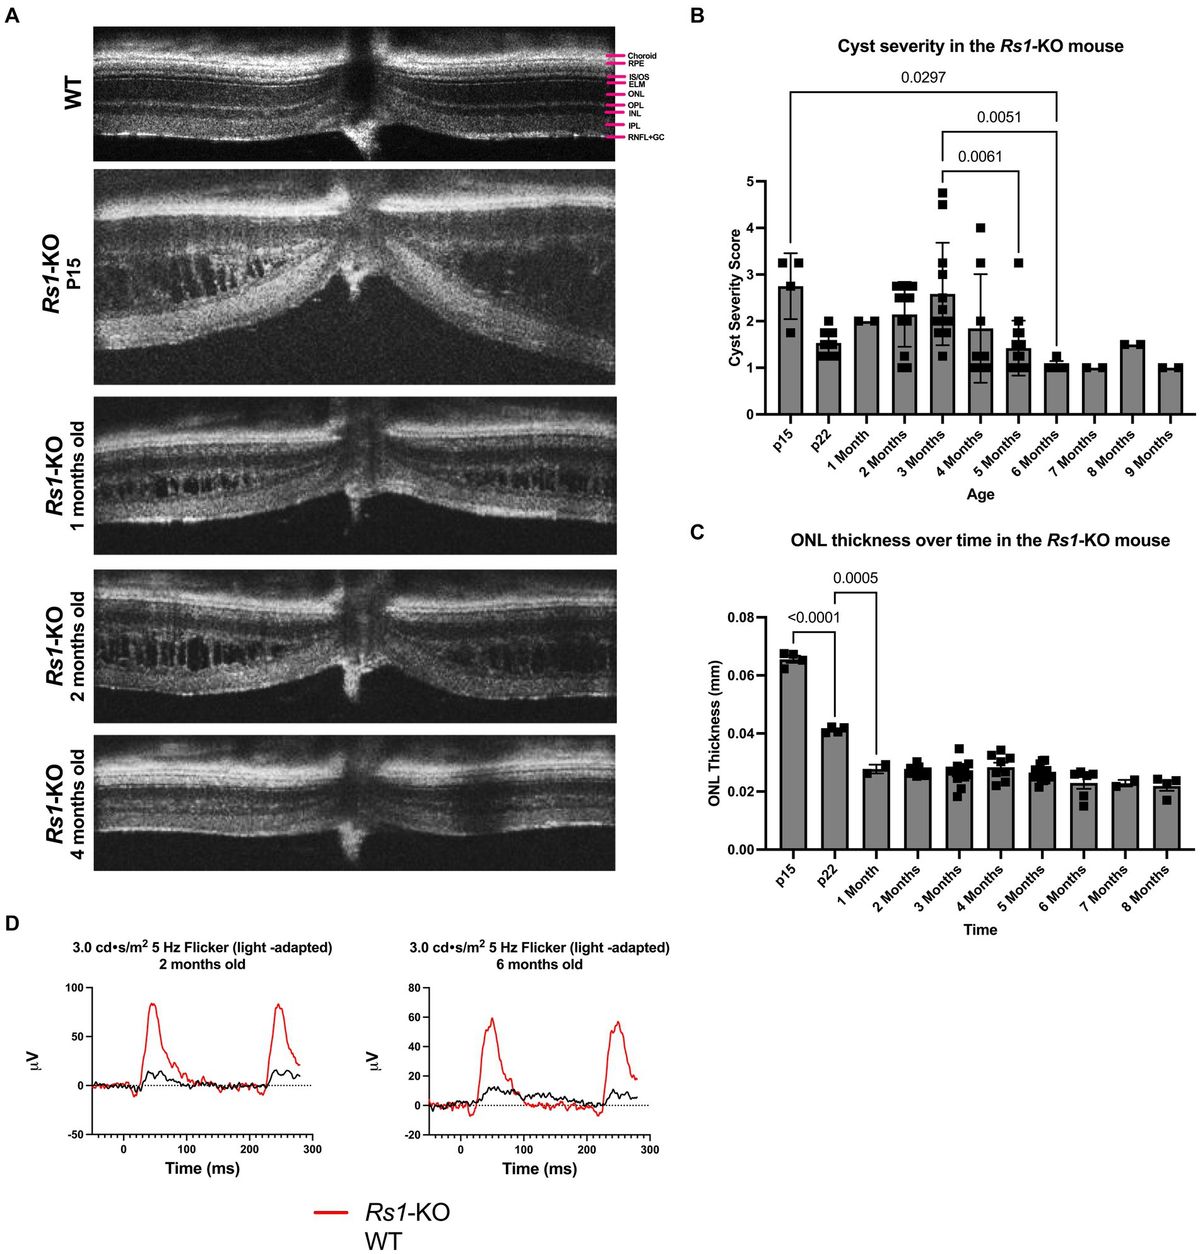
Figure 1. (A–D) Layers of the WT mouse retina is represented as follows; retinal nerve fiber layer and ganglion cell layer (RNFL + GC), inner plexiform layer (IPL), inner nuclear layer (INL), outer plexiform layer (OPL), outer nuclear layer (ONL), external limiting membrane (ELM), photoreceptor inner and outer segments (IS/OS), retinal pigment epithelium (RPE), and choroid (A). Natural history of disease in the Rs1-KO mouse compared to WT BL/6 mouse. OCT images were collected from p15 to 9-months of age in Rs1-KO mice. Representative OCT images demonstrate retinoschisis in Rs1-KO mice at p15, 1-, 2- and 4-months old, compared to a WT mouse without retinoschisis (A). Cyst severity and ONL thickness were measured at each age. To calculate cyst severity (B), cyst height was measured at 4 different positions in an eye and translated to a scoring scale of 1 to 6, with 1 representing a cyst height of 0. ONL thickness (C) was measured overtime. ERGs of Rs1-KO mice and WT mice were collected at 2- and 6-months of age. Representative waveforms are demonstrated (D). As early as 2-months of age, Rs1-KO mice show reduced ERG b-wave amplitudes and delayed latency of the b-wave peak, compared to the robust WT waveforms.
For all other cyst severity studies, volumetric scans were taken centering on the optic nerve along with nasal and temporal scans. Cyst severity was determined via manual segmentation of cyst area using the ImageJ software. Center scans, those which best bisect the optic nerve, were quantified by manually segmenting individual cyst cavities and recording the total area of cysts in the scan. Similar quantifications were performed on nasal-temporal slices located approximately 500 μm superior and inferior of the center scan, and area was reported as a sum of these measurements. Multiple comparisons were performed between every group at each time point. Non-significant comparisons were not graphed.
2.9 Visually guided swim assayAAV2/4-EF1α-RS1 vector-treated mice and mice injected with the hypertonic buffer underwent a VGSA performed in light and dark conditions to assess functional vision at approximately 5 to 7-months of age compared to treatment-naïve controls. The VGSA has been described in detail elsewhere (21). In brief, the mice undergo four training days in the light, four testing days in the light, two training days in the dark, and four testing days in the dark, and the performance of each mouse to 5 different platform locations were measured during each training or testing day. For each trial, the mice were placed into a plastic pool and were expected to find a platform. Five of the eight possible platform positions are randomly assigned each day with all platforms being used approximately the same number of times. The maximum time to platform (TTP) was set at 60 s for each trial to prevent fatigue and undue stress. After the mouse had completed the trial or after 60 s of searching, the mouse was removed from the pool, dried, and placed in its cage until the next trial. Mice were excluded in rare cases where they could not be motivated to participate and search for the platform. Data from all trials was excluded if a mouse had a swim time greater than one standard deviation from the mean of the group and consistent floating occurred, such as more than three episodes of floating per trial or more than three corrections required per trial. Corrections for floating include snapping fingers or touching the mouse’s tail.
2.10 ImmunohistochemistryEyes were enucleated and a small puncture was made through the cornea with a 27-G needle. Eyes were placed in 4% paraformaldehyde for 24 h and transferred to PBS for 24 h. After fixation, eyes were embedded in Tissue-Tek O.C.T. compound (VWR, Batavia, IL) and frozen in a bath of 2-methylbutane cooled with liquid nitrogen. Eyes were sectioned on the superior–inferior axis at a thickness of 10 μm using a Cryostat microtome and stored at-80°C for future use.
For immunohistochemistry, sections were permeabilized using 0.3% Triton X-100 in PBS (buffered at pH 7.4) for 10 min at room temperature, blocked with a blocking buffer containing 5% BSA, 5% normal goat serum, and 0.05% Triton X-100 in PBS for 1 h at room temperature, and then incubated with primary antibodies or biotinylated-peanut agglutinin (biotinylated-PNA) in a dilution buffer containing 5% BSA, 1% normal goat serum, and 0.05% Triton X-100 in PBS at 4°C overnight. The following day, samples were washed in 1xPBS three times before incubation with secondary antibodies or streptavidin Alexa Fluor-568 conjugate at room temperature for 1 h. After washing in 1xPBS an additional three times, samples were mounted with VectaShield mounting medium with DAPI (Vector Laboratories, Burlingame, CA). Images were taken using a fluorescence microscope and color channels were overlayed in ImageJ. No contrast enhancements or brightness levels were altered after acquisition.
Antibodies and reagents used for immunohistochemistry were as follows: anti-CtBP2/RIBEYE antibody (BD Transduction Laboratories #612044; 1:200 dilution); biotinylated-PNA (Vector Laboratories #B-1075; 1:500 dilution).
Images were taken directly superior and inferior of the optic nerve head and were gathered at 40× magnification. Three serial images were acquired on either side of the optic nerve leading to 6 total images gathered per eye. These images were then independently quantified by three individuals masked to treatment groups and the number of cones per image was averaged. The quantifications were averaged and divided by the image width to produce the reported average cones per 100 μm.
For immunohistochemistry on the whole flat-mount retinas, the retina was permeabilized using 0.3% Triton X-100 in PBS for 10 min at room temperature, blocked with blocking buffer containing 5% BSA, 5% normal goat serum, and 0.05% Triton X-100 in PBS at 4°C overnight. The following day, samples were washed in 1xPBS two times for 10 min in room temperature before incubation with secondary antibody streptavidin Alexa Fluor-568 conjugated and Hoechst 1:1000 (Thermo Fisher Hoechst 33342) at room temperature for 1 h tilted in a 2 mL Eppendorf tube. After washing in 1xPBS two times for 10 min at room temperature, samples were mounted with Fluoromount-G (Electron Microscopy Science #17984-25). Images were taken on a THUNDER Imager (Leica DM6B microscope equipped with a Leica DFC9000 GT camera), z-stacks were between 10–17 stacks at 1.5 μm and computational clearing of z-stacks was carried out using LAS X software. With the use of ImageJ, two rectangle boxes per retina were cropped to approximately 350 × 350 μm to obtain a uniform area in which to count cones on a flat mount. The image was converted to 8-bit and thresholded to isolate the cone staining on the image. Once these steps were completed, a particle analysis was conducted to count and label cones present in the cropped image. Cone density of buffer-injected or sham-punctured eye was normalized to its untreated fellow eye and reported as a percentage.
3 Results 3.1 Natural history of disease in the Rs1-KO mouse compared to WT BL/6 mouseThe features of the Rs1-KO mouse model were characterized. Cyst severity was quantified over time in the Rs1-KO mouse using a modified cyst severity scoring system, as previously described by Bush et al. (19). Figure 1 demonstrates typical OCT findings in the Rs1-KO mouse at p15, 1-, 2-, and 4-months of age, compared to a WT mouse (Figure 1A). Retinal cysts can be observed in the Rs1-KO mouse retina up to 3 months of age, in contrast to the organized, laminar retinal architecture of the WT mouse. Cysts are apparent as early as p15 with an average severity score of 2.75 out of 6 (Figure 1B). Cysts appear the most severe at 2- to 4-months old, hitting a local maximum at 3-months. Thereafter, cyst severity reduced with maturity.
At p15, Rs1-KO mice have comparable ONL thicknesses (65.56 μm) as mice that are WT (62.8 ± 6.23) (22), or heterozygous for the Rs1 gene. In untreated Rs1-KO mice, significant thinning of the ONL occurred from p15 to p22 (Figure 1C, p < 0.0001), during which the ONL thickness was decreased by more than 37%. After 1-month, the ONL thickness in Rs1-KO mice did not significantly change, indicating that most of the photoreceptor cell loss occurred during eye maturation in this mouse model.
ERGs measure the electrical response of the retina in vivo to understand how the disease affects signal transmission in light and dark conditions. ERGs of Rs1-KO mice consistently demonstrated a reduction in function of rod-dependent and cone-dependent visual pathways compared to WT eyes. Figure 1 demonstrates typical ERG waveforms for this XLRS model at 2 and 6 months of age under light-adapted (5 Hz flicker) metrics (Figure 1D). In summary, features of the Rs1-KO mouse model resemble the clinical course in humans, including cyst formation, ONL thinning, and diminished electrical activity of retinal photoreceptors and bipolar cells observable on ERG. The phenotypes observed mirror those reported by Sieving et al. (14).
By administering gene therapy at 1-month of age, we aimed to determine if the intervention could mitigate the severity of cysts in the retina and subsequently improve the electrical signaling of retinal cells after the initial ONL thinning phase. Results from vector-treated and hypertonic buffer-injected eyes were compared to those of treatment naïve eyes (untreated).
3.2 Cyst severity is significantly reduced in vector-treated and hypertonic buffer-injected eyes at 1 MPIUsing cyst area (mm2) of central OCT cross-sections as a measure of cyst severity, we observed that cysts were nearly completely ameliorated in vector-treated Rs1-KO eyes (n = 10) and hypertonic buffer-injected Rs1-KO eyes, in contrast to untreated eyes at 1 MPI (vector-treated: 0.001871 mm2, p < 0.0001; hypertonic buffer: 0.002878 mm2, p < 0.0001, untreated: 0.01691 mm2, Figures 2A,B). This reduction in cyst burden was particularly noteworthy because it coincided with the critical cyst developmental period around 2-months of age, a time when peak cyst formation is typically observed in Rs1-KO mice (Figure 1). This data suggests that the injection of either the vector or hypertonic buffer can effectively reduce cysts during a crucial phase of cyst development. Interestingly, there was no difference in the extent of cyst reduction between the vector and hypertonic buffer-injected eyes.
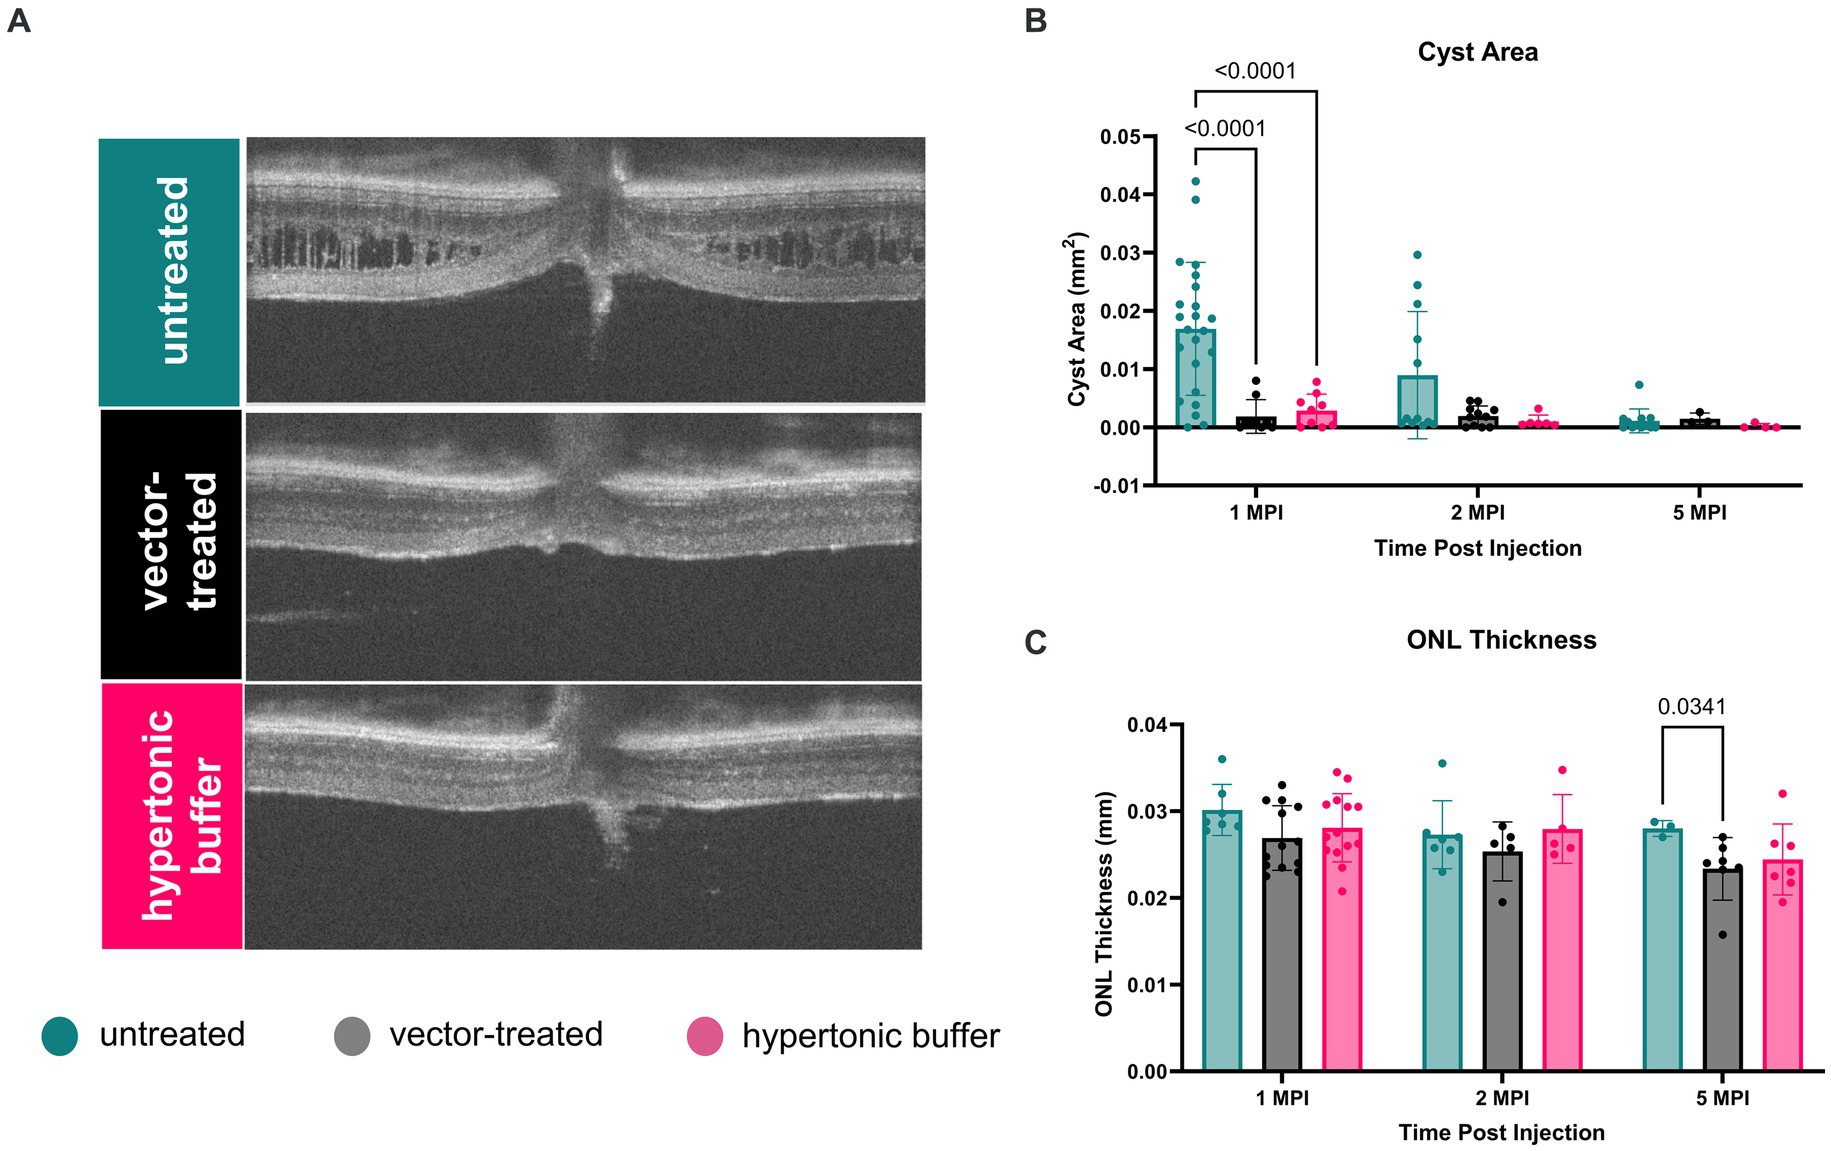
Figure 2. (A–C) Cyst severity is significantly reduced in vector-treated and hypertonic buffer-injected eyes at 1 month post injection (MPI). OCT images of vector-treated, hypertonic buffer-injected, and untreated eyes were collected at 1, 2, and 5 MPI. Volumetric scans were taken centering on the optic nerve. Representative OCT images demonstrate cyst changes at 1 MPI (A). Cyst severity (B) was determined via manual segmentation of cyst area using the ImageJ software. Multiple comparisons were performed between every group at each time point. Non-significant comparisons were not annotated in the graphs. Vector-treated (n = 10) or hypertonic buffer-injected Rs1-KO eyes demonstrated significantly less cyst severity than untreated eyes (B) at 1 MPI. ONL thickness (C) remained stable from 1 to 5 MPI in all cohorts; however, at 5 MPI, vector treated eyes had statistically thinner ONLs than untreated eyes.
At subsequent time points, 2 and 5 MPI, since cyst severity naturally decrease in untreated Rs1-KO eyes (Figure 1B), we did not observe significant differences in cyst severity among untreated, vector-treated, or hypertonic buffer-injected eyes (14) There is no notable change in ONL thickness from 1 to 5 MPI in all cohorts; however, at 5 MPI, vector treated eyes had a statistically thinner ONL than untreated eyes (p = 0.0341) (Figure 2C).
Cysts spatially separate bipolar cells and photoreceptors, and it is hypothesized that the lower b-wave amplitudes and/or electronegative ERG phenotype associated with XLRS is a consequence of this spatial separation. To examine the potential influence of reduced cysts on retinal electrical signaling, we conducted ERGs under light-adapted and dark-adapted conditions.
3.3 Hypertonic buffer outperforms untreated and vector-treated eyes in light-adapted ERGs, but not in dark-adapted ERGsERGs were performed at 1, 2, 3, and 5 MPI to evaluate treatment efficacy, and ERG amplitudes in vector-treated Rs1-KO eyes (n = 10) or hypertonic buffer-injected Rs1-KO eyes (n = 15) were compared to those in their contralateral untreated Rs1-KO eyes.
3.3.1 Light-adaptedThe retinal cone pathway was assessed using two light-adapted ERG assays: the 5 Hz flicker and the 3.0 flash. At 1 MPI, both vector-treated and hypertonic buffer-injected eyes showed significantly higher amplitudes, suggestive of superior cone function, compared to untreated eyes in the 5 Hz flicker assay (vector-treated: 30.17 ± 7.14 μV, p = 0.0002; hypertonic buffer: 32.86 ± 6.88 μV, p < 0.0001; untreated: 15.42 ± 6.17 μV, Figure 3A). This effect persisted until 2 MPI in vector-treated eyes (vector-treated: 32.42 ± 6.89 μV, p < 0.0001) after which amplitudes decreased and significance over untreated eyes was lost. Interestingly, hypertonic buffer injected eyes continued to have significantly higher amplitudes than untreated eyes to 5 MPI (hypertonic buffer: 31.05 ± 6.82 μV, p < 0.0001; Figure 3A).
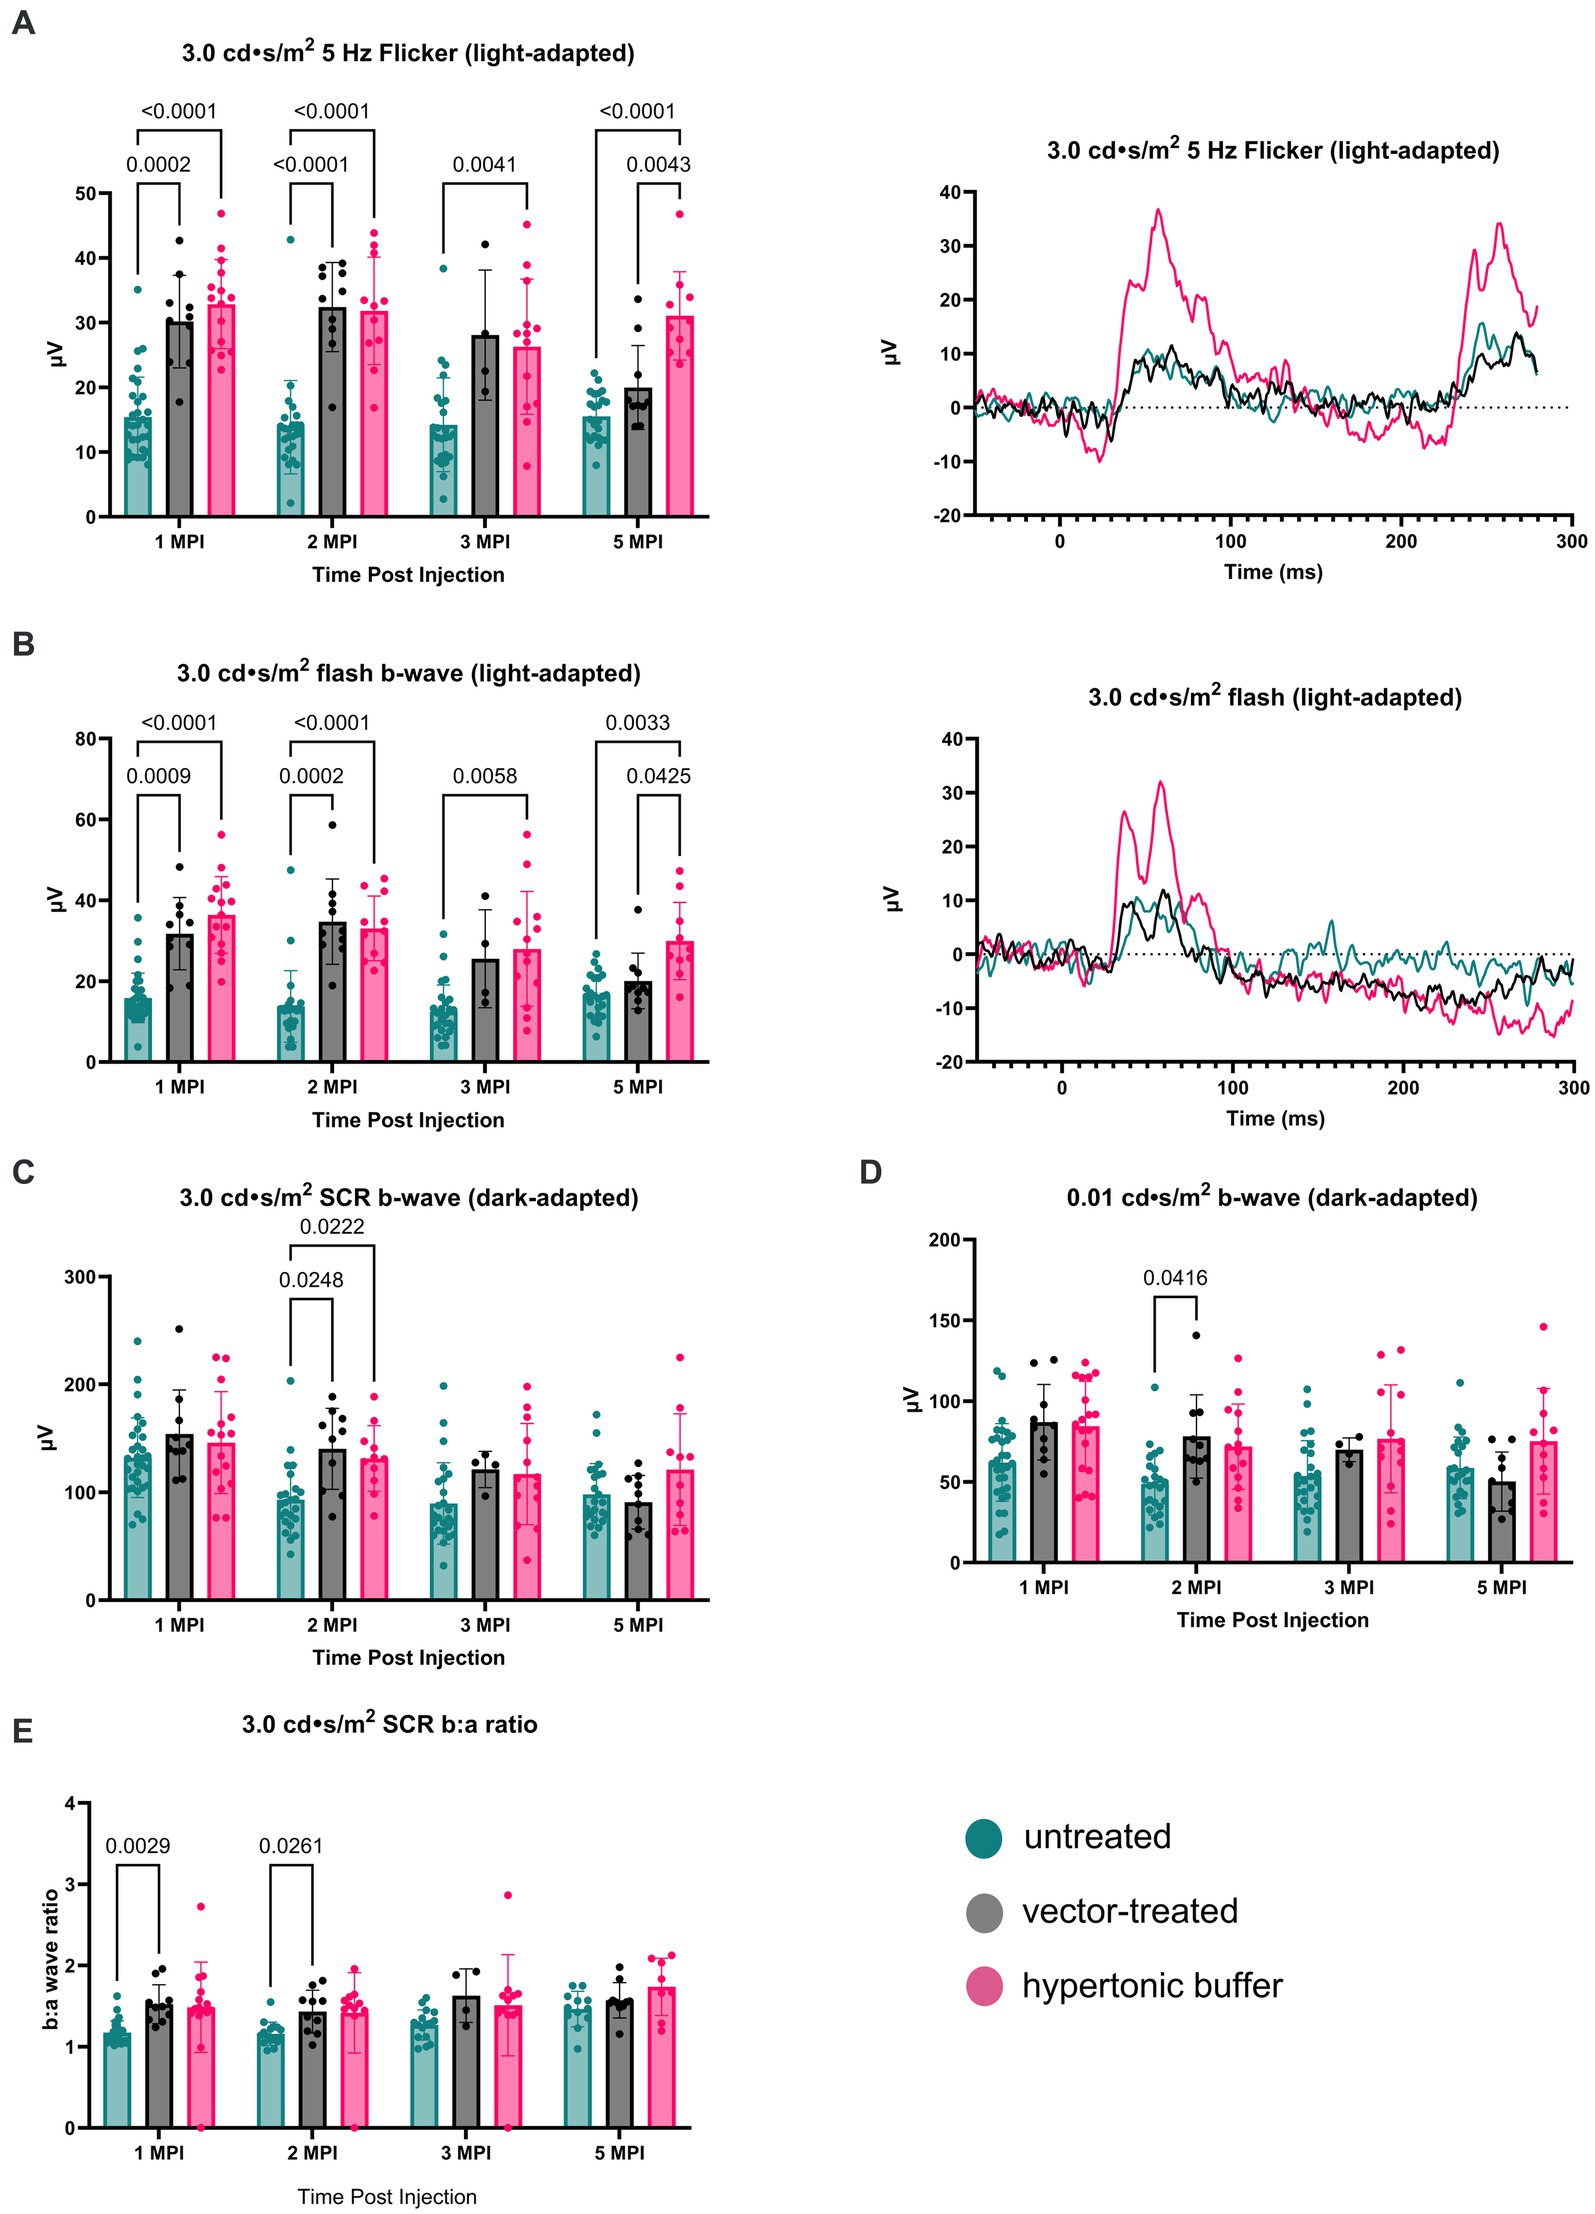
Figure 3. (A–E) Hypertonic buffer robustly outperforms untreated and vector-treated eyes in light-adapted ERGs. Cone-dependent retina function was measured using two separate light-adapted ERG assays—the 5 Hz flicker (A) and 3.0 flash (B). ERG amplitudes are shown from 1-month post injection (MPI) to 5 MPI for vector-treated, hypertonic buffer-injected, and untreated eyes in Rs1-KO mice, and representative ERG traces at 5 MPI are illustrated. In response to both light-adapted assays, hypertonic buffer-injected eyes showed higher amplitudes than untreated and vector-treated eyes to 5 MPI (A). The combined rod-cone function was measured by the 3.0 cd·s/m2 standard combined response (SCR) under dark-adapted conditions (C). At 1, 3, and 5-MPI, there was no difference between vector-treated, hypertonic buffer-injected, or untreated eyes. Isolated rod function was measured using 0.01 cd·s/m2 dim flash after dark adaptation (D). There was no persistent significant difference between hypertonic buffer-injected, isotonic buffer-injected, or untreated eyes in rod dominant ERG settings.
Notably, at 5 MPI, hypertonic buffer-treated eyes demonstrated significantly higher amplitudes than vector-treated eyes (19.98 ± 6.49 μV, p = 0.0043), indicating a more robust and sustained rescue of cone function in the hypertonic buffer group compared to the low-dose AAV2/4-EF1α-RS1 vector (Figure 3A). This data suggests that subretinal injection of the hypertonic buffer provides a more effective long-term improvement in cone function than the vector treatment.
Similarly, in the 3.0 flash assay, vector-treated eyes demonstrated significantly higher amplitudes, suggestive of superior cone function, compared to untreated eyes until 2 MPI (vector-treated: 34.70 ± 10.56 μV, p = 0.0002; hypertonic buffer: 33.04 ± 8.01 μV, p < 0.0001; untreated: 13.75 ± 8.85 μV, Figure 3B) after which time amplitudes began to decrease. However, hypertonic buffer-injected eyes exhibited a more robust and long-term improvement in function with higher amplitude ERGs persisting to 5 MPI (29.93 ± 9.57 μV, p = 0.0033), when compared to untreated eyes (16.43 ± 5.19 μV), and even demonstrated significantly higher amplitudes than vector-treated eyes at 5 MPI (20.03 ± 6.87 μV, p = 0.0425). This robust and sustained improvement in cone function observed in the hypertonic buffer group was an unexpected finding, indicating that the subretinal injection of the buffer alone enabled long-term benefits in retinal cone function. This phenomenon is specific to XLRS, as injection of a hypertonic buffer into eyes without XLRS typically reduces the ERG amplitudes due to surgical trauma (Supplementary Figure S1). Since injection of buffer alone causes an increase in b-wave amplitudes in the absence of restoring RS1 protein expression, this phenotype could be the consequence of cyst amelioration. Representative waveforms demonstrate these findings at 5 MPI (Figures 3A,B).
3.3.2 Dark-adaptedTo measure the electrical function of the eye in dark conditions, the 3.0 SCR and 0.01 dim flash ERG assays were utilized. At 1 MPI, no significant difference was observed in the b-wave amplitudes between untreated eyes and vector-treated or hypertonic buffer-injected eyes in the 3.0 SCR (vector-treated: 153.8 ± 40.87 μV, p = 0.3211; hypertonic buffer: 146.0 ± 47.17 μV, p = 0.5819, untreated: 132.0 ± 37.00 μV, Figure 3C), or 0.01 dim flash assays (vector-treated: 86.91 ± 23.39 μV, p = 0.0691, hypertonic buffer: 84.48 ± 27.73 μV, p = 0.0541, untreated: 62.01 ± 24.05 μV, Figure 3D). At 2 MPI, both the vector-treated and hypertonic buffer-injected eyes showed significantly higher amplitudes, suggestive of an improved combined function of rod and cone photoreceptors in the 3.0 SCR (vector-treated: 140.2 ± 37.56 μV, p = 0.0248, hypertonic buffer: 131.3 ± 30.43 μV, p = 0.0222, untreated: 93.07 ± 32.97 μV, Figure 3C). A similar effect was seen at 2 MPI in vector-treated eyes during the 0.01 dim flash assay (vector-treated: 78.12 ± 25.75 μV, p = 0.0416, Figure 3D). Under the 3.0 SCR b:a wave ratio, vector treated eyes had significantly higher b:a wave amplitude ratios than untreated eyes util 2 MPI (vector-treated: 1.43 ± 0.26 μV, p = 0.0261; untreated: 1.16 ± 0.14 μV, Figure 3E). However, these improvements were transient and were not maintained at 3 and 5 MPI. These results indicate that injection of low-dose AAV2/4-EF1α-RS1 vector or hypertonic buffer did not have a notable long-term effect on rod-dependent retinal function, nor on rod-cone combined function as measured by the 3.0 SCR test. Improvements in ERG amplitudes after the injection of hypertonic buffer were most notable in cone-dependent ERGs.
Following the observed improvements in cone specific electrical pathways, we investigated whether these improvements were associated with differences in functional vision.
3.4 Vector-treated and hypertonic buffer-injected mice perform faster in a light-adapted swim assay than untreated Rs1-KO miceFunctional vision in mice subretinally injected with the low-dose AAV2/4-EF1α-RS1 vector or hypertonic buffer, as well as the untreated Rs1-KO mice, was measured using a VGSA. Mice between 5 to 7-months of age were placed in a pool and platform locations were randomly determined for each trial in light-and dark-adapted environments. One datapoint represents the averaged time it took for a mouse to reach the platform over 20 different trials using randomized platform positions. Administration of the vector or buffer was unilateral. In light-adapted conditions, we observed that vector-treated mice (2.92 s) and hypertonic buffer-injected mice (3.05 s) had a generally faster trend in average swim performance than untreated mice (4.50 s) in lighted environments (Figure 4A). These results confirm that the subretinal injection of vector or buffer alone has potential to benefit functional vision in the light, which correlates with the apparent reduction of cysts, and improved cone pathway ERG signaling. The trends in improvement of functional vision seen in vector-treated mice was comparable to that observed in buffer-injected mice in light-adapted testing conditions. There was less of an impact on functional vision in dark-adapted swim environments (Figure 4B).
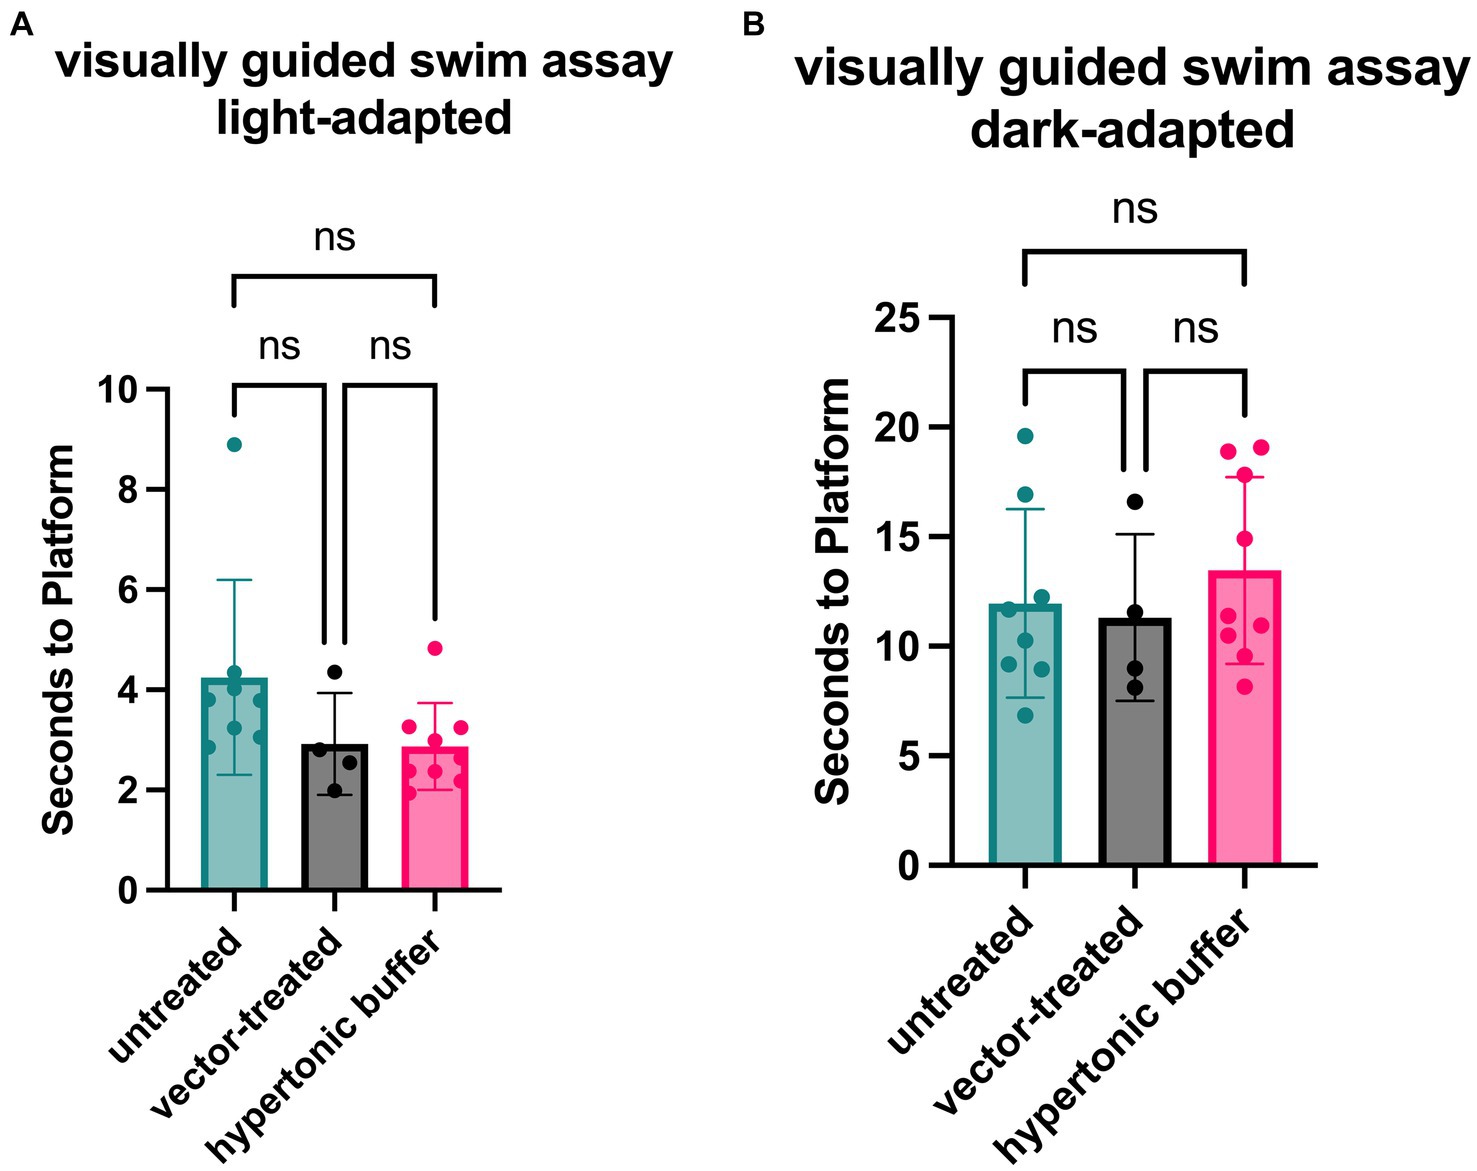
Figure 4. (A,B) Vector-treated and hypertonic buffer-injected Rs1-KO mice perform faster in a light-adapted swim maze than untreated Rs1-KO mice. Mice were placed in a swim maze and testing was performed under light-adapted (A) or dark-adapted (B) conditions. Time-to-platform was recorded. Each data point is representative of the average time-to-platform for a single mouse. In light-adapted conditions (untreated n = 8, vector-treated n = 4, hypertonic buffer n = 10.), we observed that vector-treated mice (2.92 s) and hypertonic buffer-injected mice (3.05 s) had a generally faster trend in average swim performance when finding a random platform than untreated mice (4.50 s) in lighted environments. In a dark-adapted environment, there is a less impactful effect on average time-to-platform between vector-treated (11.31 s), hypertonic buffer-injected (13.78 s), and untreated eyes (11.13 s), suggesting a limited effect on visual function in the dark (B).
Together, the long-term ERG data and functional vision assays suggest that subretinal injections of a hypertonic buffer solution alone led to significant reductions in cyst severity and cone-specific improvements in retinal function and functional vision. The improvements observed in buffer-treated eyes were comparable to, and in some instances superior to, those observed in vector-treated eyes, indicating that treatment with a low-dose AAV2/4-EF1α-RS1 was not efficacious. The reason behind the functional rescue observed in Rs1-KO mice subretinally injected with buffer is not clear.
3.5 Investigation of the effect of tonicity on cone rescueThe injection of hypertonic buffer alone leads to significant improvements in cone-specific ERG amplitudes, light-adapted visual function, and retinal architecture in Rs1-KO mice. Surprisingly, the observed improvements in ERG amplitudes after buffer injection persisted for at least 5 MPI. Previous studies have demonstrated a temporary reduction in existing retinal cavities following the subretinal injection of a balanced salt solution; however, the long-term effects on visual function and electrical signaling of the retina has not been studied (23). Additionally, cystoid retinal conditions in XLRS patients can be modified by the application of diuretic ophthalmic solutions such as brinzolamide and acetazolamide but the connection between fluid reabsorption and cyst resolution is not well understood (8). Previous literature has suggested that the RS1 protein physically interacts with Na/K-ATPase and may act to mediate Na/K-ATPase activity, affecting signaling and ion gradients within the retina (24, 25).
The buffer solution, used both to store the AAV vector and used in the initial buffer injections, contained a high salt content and a greater than physiologic osmolarity. Therefore, we hypothesize that the tonicity of the injected buffer plays a role in promoting cyst resolution and improving retinal signaling. This hypothesis was investigated through a subretinal injection of an isotonic buffer. The isotonic buffer has a similar composition to the hypertonic buffer except possessing a lower concentration of NaCl. Additionally, to account for mechanical trauma to the eye during the injection procedure, a sham cohort was added and received a scleral puncture and introduction of a Hamilton needle subretinally, to mimic injection without the introduction of subretinal fluid, hereafter referred to as the “puncture” group. The endpoints of these two additional experimental groups also include ERG to measure retinal electrical function and OCT to measure retinal structure and cyst severity. The results for these tests are as follows.
3.6 Cyst area is reduced in hypertonic buffer and isotonic buffer-injected eyes, with more robust reduction observed in the hypertonic buffer groupTo determine if the tonicity of the injection buffer ameliorated cysts post injection, OCT was used to image the retinal layers in vivo. Cyst severity was evaluated by the segmentation of total cyst area in the central OCT scan. Outer nuclear layer (ONL) thickness measurements were taken to assess photoreceptor cell survival.
While all groups receiving buffer injections as well as the puncture group had reduced cyst severity at 3 weeks post injection (WPI), the group receiving injections of the hypertonic buffer had the greatest reduction (Figure 5A). In the hypertonic buffer-treated group, cyst area was decreased by 83.77% compared to the cyst areas in untreated eyes (p = 0.0032). Cyst areas were reduced by 68.32 and 69.53% in the puncture group and the isotonic group, respectively (Figure 5A). While a sham puncture influenced cyst reduction, the greatest reduction was observed after the injection of the hypertonic buffer.
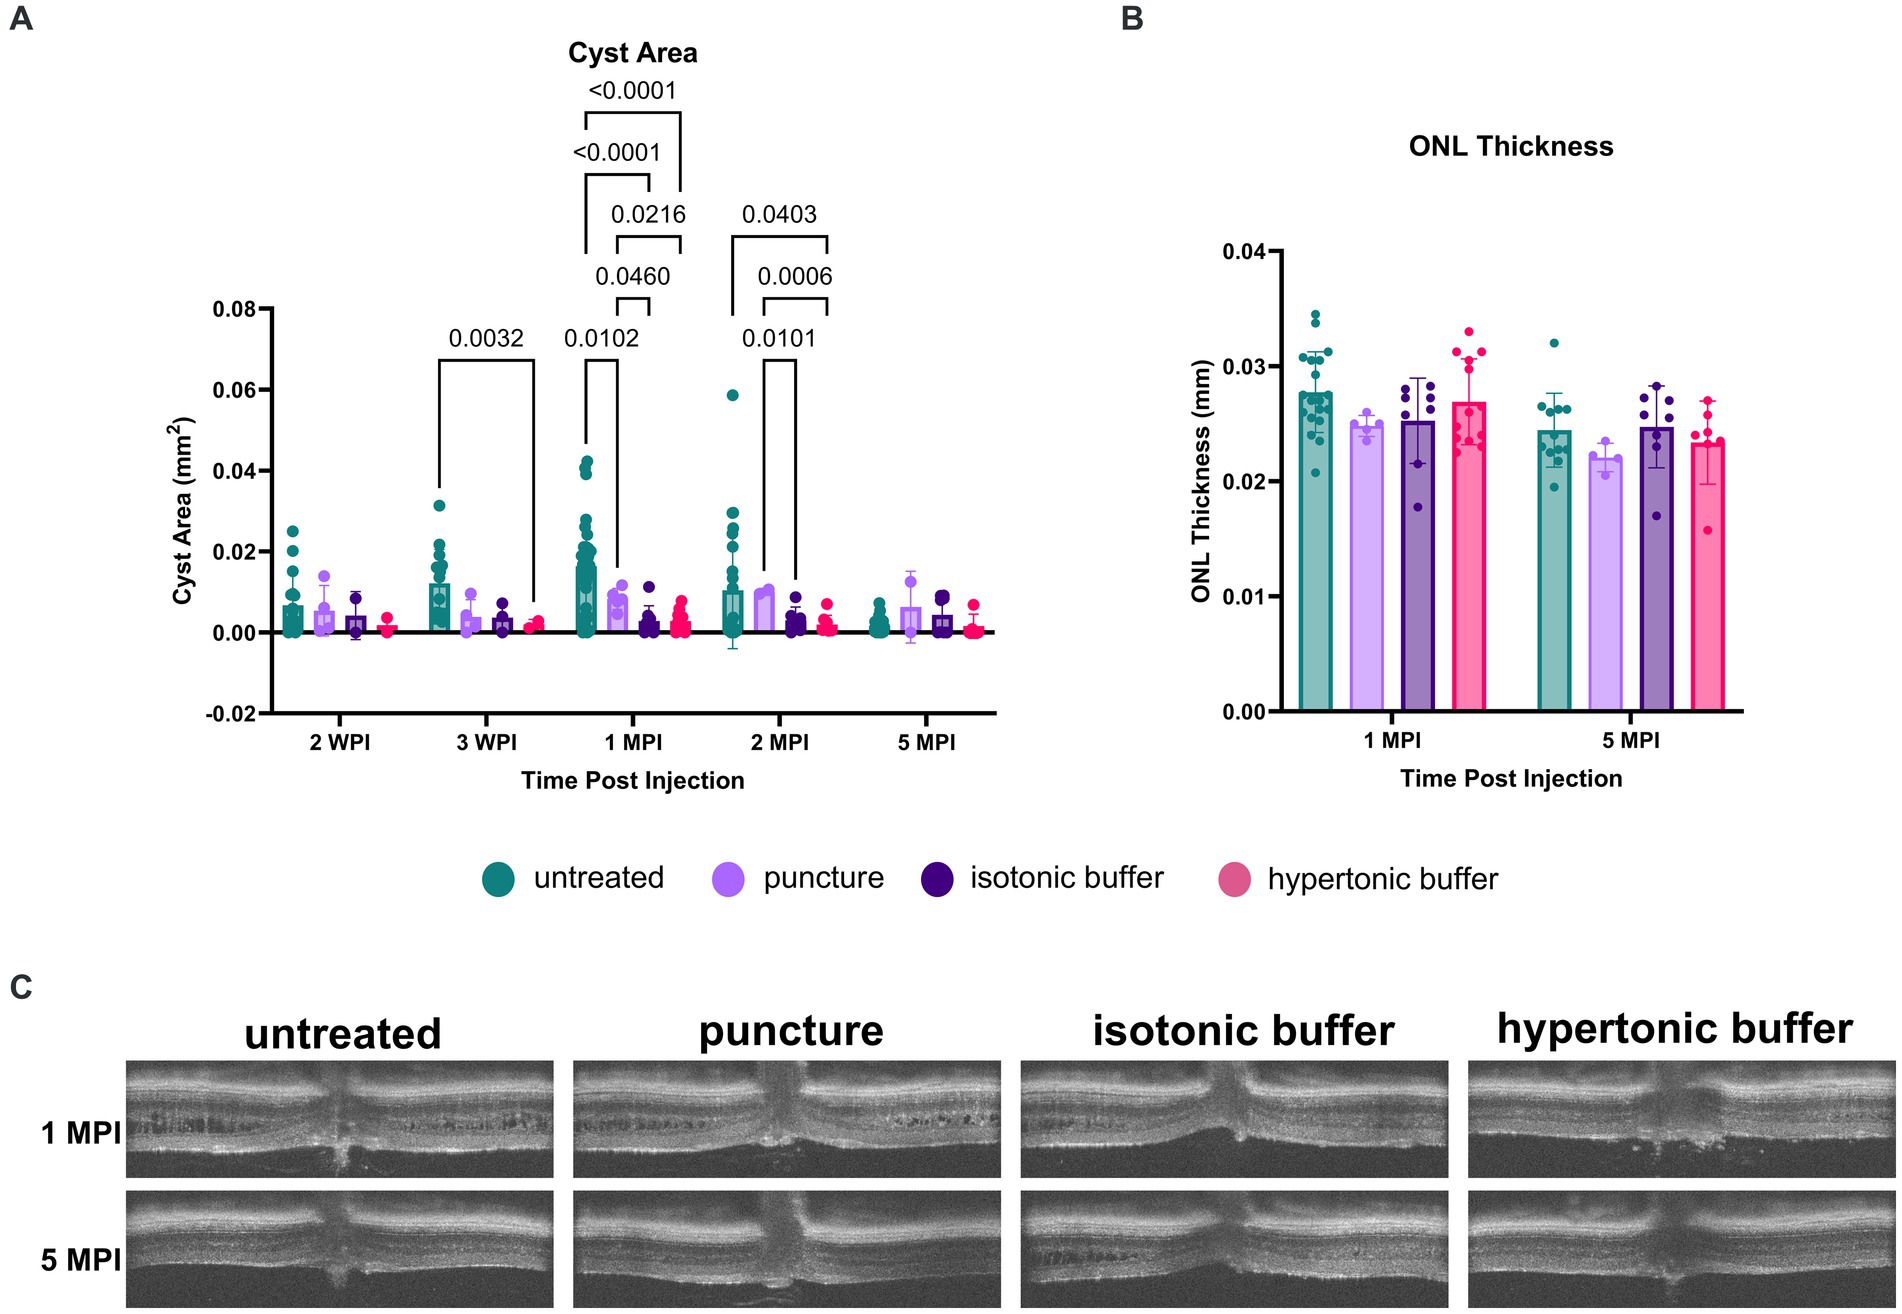
Figure 5. (A–C) Cyst area is reduced in hypertonic buffer and isotonic buffer-injected eyes, with greater reduction observed in the hypertonic buffer group. OCT images were collected at 2- and 3-weeks post injection (WPI), 1-month post-injection (MPI), and 2 MPI. Cyst area quantification (A) and outer nuclear layer (ONL) thickness (B) measurements were taken to assess cyst severity and photoreceptor cell survival, respectively. Representative OCT images demonstrate cysts at respective time points in all experimental groups (C). Each data point is representative of one eye. At 3 WPI, there was less cyst severity in the hypertonic buffer-injected eyes compared to untreated eyes (A). At 1 MPI, hypertonic and isotonic buffer-treated eyes both have less severe cysts than untreated and sham punctured eyes. This effect persisted until 2 MPI for the hypertonic buffer-injected eyes compared to untreated and sham punctured eyes. ONL thickness remains stable to 5 MPI and does not significantly differ between injection groups and untreated controls (B).
At 1 MPI, both hypertonic and isotonic buffer-treated eyes exhibited significantly less severe cysts than untreated or sham punctured eyes. In the hypertonic buffer-treated group, cyst area was decreased by 82.57% compared to the cyst area of untreated eyes (p < 0.0001), and 65.46% compared to cyst area of sham punctured eyes (p = 0.0216, Figure 5A). This implies that subretinal injection of the buffer solution caused cyst reduction, and the reduction is not solely caused by the surgical puncture. In the isotonic buffer-treated group, cyst area was decreased by 82.53% compared to the cyst area of untreated eyes (p < 0.0001, Figure 5A), and 65.38% compared to cyst area of sham punctured eyes (p = 0.0460, Figure 5A). At 1 MPI, sham punctured eyes showed a 49.54% reduction in cyst area compared to untreated eyes (p = 0.0102).
At 2 MPI, there is no longer a significant difference between cyst severity in the puncture group versus in untreated eyes, indicating that the alleviation of cysts in the sham puncture group was transient. In contrast, the reduction in cyst severity persisted to 2 MPI in hypertonic buffer-injected eyes compared to untreated eyes (81.33% reduction, p = 0.0403) and eyes that received only the sham surgical puncture (80.80% reduction, p = 0.0006). At 2 MPI, isotonic buffer-treated eyes also demonstrated a significant reduction in cyst severity compared to sham punctured eyes (70.03% reduction, p = 0.0101). Isotonic buffer-injected eyes did not have significantly reduced cyst severity compared to untreated eyes at 2 MPI (p = 0.1145). Representative OCT images of all experimental groups at 1 and 5 MPI are demonstrated in Figure 5C.
In summary, hypertonic buffer-injected eyes demonstrated an early and sustained reduction in cyst severity, starting as early as 3 WPI and persisting to 2 MPI. Additionally, the reduction in cyst severity was slightly greater in hypertonic buffer-injected eyes than in isotonic buffer-injected eyes at 3 WPI and 1 MPI.
Though cysts were decreased at early timepoints, ONL thickness was not different across time points between hypertonic buffer-injected, isotonic buffer-injected, sham punctured, and untreated eyes, suggesting that there is no difference in photoreceptor survival using this method.
3.7 Hypertonic buffer-injected eyes have a more robust cone rescue on light-adapted ERG over untreated, sham punctured, and isotonic buffer-injected eyes 3.7.1 Light-adaptedFollowing an observed reduction in retinal cysts after subretinal injection of a hypertonic buffer, we investigated whether the improvement in cysts paralleled a similar improvement in electrical function of the retina.
Cone function was measured using two separate light-adapted ERG assays; the light adapted (LA) 3.0 flash and 5 Hz flicker.
Under the light-adapted 3.0 flash assay, both hypertonic buffer and isotonic buffer-injected eyes showed significantly higher amplitudes, indicative of better cone cell functioning, compared to untreated eyes at 1 MPI (hypertonic buffer: 36.37 ± 9.50 μV, p < 0.0001; isotonic buffer: 31.62 ± 8.71 μV, p = 0.0131; untreated: 15.84 ± 6.14 μV, Figure 6A). At this time point, eyes that received the sham puncture also had increased amplitudes (29.59 ± 15.10 μV). Hypertonic buffer-injected eyes continued to demonstrate improved cone functioning over untreated eyes throughout the study period, including at the study endpoint at 5 MPI (hypertonic: 29.93 ± 9.57 μV, p = 0.0060; untreated: 16.43 ± 5.19 μV, Figure 6A). At the endpoint, eyes that received puncture did not have a significant difference compared to untreated eyes, indicating that the effect of a surgical puncture on RS1 phenotypes was transient. Additionally, hypertonic buffer-injected eyes showed significant improvements over sham punctured eyes at 2 MPI (hypertonic: 33.04 ± 8.01 μV, p = 0.0041; sham punctured: 15.51 ± 5.17 μV) and 5 MPI (hypertonic: 29.93 ± 9.57 μV, p = 0.0148; sham punctured: 16.21 ± 4.29 μV, Figure 6A).
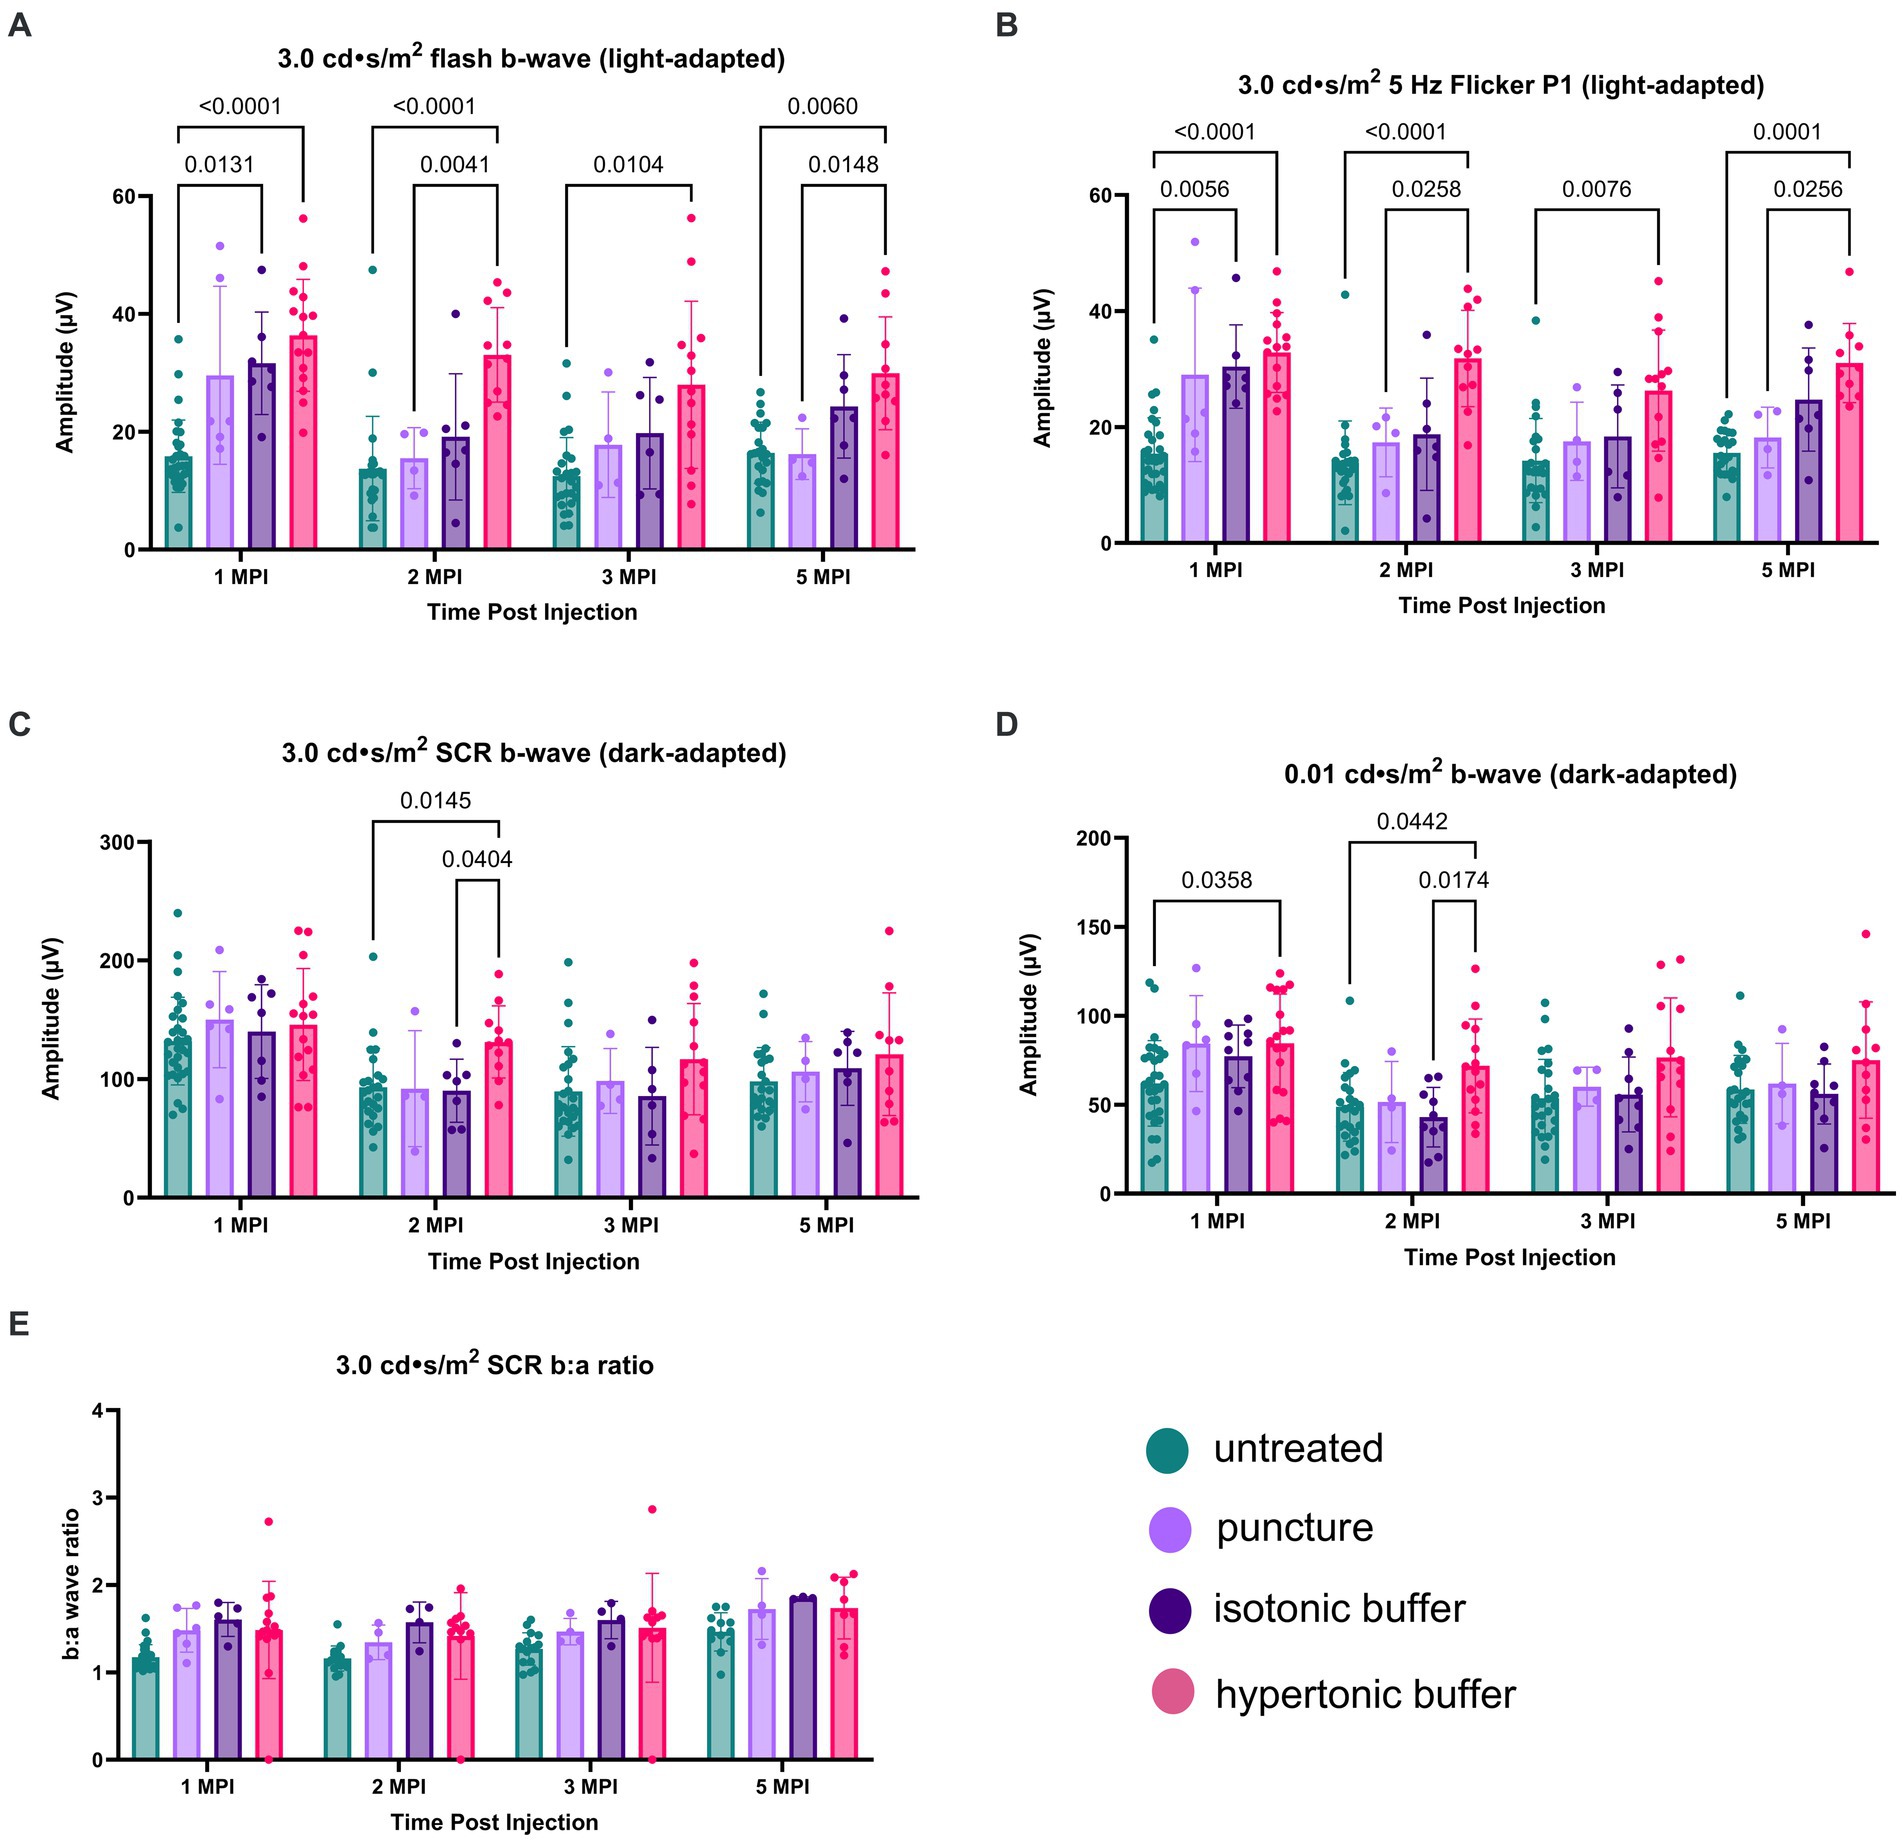
Figure 6. (A–E) Hypertonic buffer-injected eyes experience a robust rescue of cone functioning. Cone-dependent retina function was measured using two separate light-adapted ERG assays—the 3.0 cd·s/m2 flash (A), and the 5 Hz flicker (B) in hypertonic buffer, isotonic buffer, and sham punctured eyes in Rs1-KO mice. Each data point represents one eye. ERG amplitudes are shown from 1-month post injection (MPI) to 5 MPI. In both light-adapted assays (A,B), hypertonic and isotonic buffer-injected eyes showed higher amplitudes compared to untreated eyes at 1 MPI. Hypertonic buffer-injected eyes showed improvements over untreated and sham punctured eyes until 5 MPI. The combined rod-cone function was measured by the 3.0 cd·s/m2 SCR under dark-adapted conditions (C). Rod-dependent retina function was measured by the 0.01 dim flash (D). In the 0.01 dim flash, hypertonic buffer-injected eyes showed improvements over untreated at 1 MPI and over both untreated and isotonic buffer-injected eyes at 2 MPI. However, significant differences over time were not observed.
Similar findings were observed in the second, cone-dependent assay, the 5 Hz flicker. Both hypertonic buffer and isotonic buffer-injected eyes showed significantly higher amplitudes compared to untreated eyes at 1 MPI (hypertonic buffer: 32.86 ± 6.88 μV, p < 0.0001; isotonic buffer: 30.43 ± 7.19 μV, p = 0.0056; untreated: 15.42 ± 6.17 μV, Figure 6B). However, the effect of isotonic buffer injection was not as notable as that observed in hypertonic buffer injected eyes, indicating the tonicity of the buffer could play a role in this observation. In contrast, hypertonic buffer-injected eyes continued to have significantly higher amplitudes, indicating sustained improved cone function, compared to untreated eyes until the study endpoint at 5 MPI (hypertonic buffer: 31.05 ± 6.82 μV, p < 0.0001; untreated: 15.52 ± 3.71 μV, Figure 6B). Additionally, hypertonic buffer-injected eyes had significantly higher amplitudes than sham punctured eyes at 2 MPI (hypertonic: 31.82 ± 8.29 μV, p = 0.0258; sham punctured: 17.36 ± 5.93 μV, Figure 6B) and 5 MPI (hypertonic: 31.05 ± 6.82 μV, p = 0.0256; sham punctured: 18.20 ± 5.24 μV, Figure 6B).
These results show that injection of a hypertonic buffer significantly improved the amplitudes of cone-dependent ERGs, and this effect persists even when cysts are naturally resolved due to age in the Rs1-KO mouse model. The injection of an isotonic buffer also had a beneficial effect, although the magnitudes of improvement were not comparable to those in hypertonic buffer-injected eyes. A transient effect was observed in eyes that received the scleral puncture only (without the injection of a buffer), indicating that the effect of surgical manipulation on cyst and retinal function was transient.
Together, these results show that the introduction of a subretinal buffer solution has unexpected beneficial effects on cyst severity and cone retinal function in eyes affected by XLRS, and the observed effect is long-term. Additionally, the tonicity of the injected buffer solution may play a role in the observed phenomenon.
3.7.2 Dark-adapted ERGCombined rod-cone function was measured by the 3.0 SCR, and isolated rod function was measured using the 0.01 dim flash. In the 3.0 SCR, hypertonic buffer-injected eyes showed improved amplitudes over untreated (p = 0.0145) and isotonic buffer-injected eyes (p = 0.0404) at 2 MPI (Figure 6C). In the 0.01 dim flash, hypertonic buffer-injected eyes showed improvements over untreated at 1 MPI (p = 0.0358, Figure 6D) and over both untreated (p = 0.0442) and isotonic buffer-injected (p = 0.0174) eyes at 2 MPI (Figure 6D). Hypertonic buffer-injected eyes did not show improvements over sham punctured eyes in dark-adapted assays. There was no difference between experimental groups in the SCR b:a wave ratio (Figure 6E). These findings suggest that hypertonic buffer-injection may lead to short term rescue of rods and that this effect may be influenced by the tonicity of the buffer.
3.8 Peak cyst severity on OCT is negatively associated with cone function on ERG at 5 MPI
留言 (0)