
記住我
Postmortem human brain tissue is an invaluable resource for studying microscopic structural changes associated with neurodegenerative and psychiatric disorders. Three-dimensional tissue imaging offers advantages over standard microscopy by enabling improved visualization of cellular morphology and spatial relationships between cells. However, this technique requires optically transparent tissue and the accessibility of target epitopes to antibodies, both of which present technical challenges.
The three major approaches for volumetric imaging are hydrophobic, hydrophilic, and hydrogel-based clearing methods. Hydrophobic methods such as 3DISCO lead to well-preserved cleared organs within a few days, with downsides of tissue shrinkage, reagents that include toxic organic solvents, and the possibility of fluorescent signal degradation over time due to protein instability in clearing solutions (Ertürk et al., 2012; Ueda, 2020). Hydrophilic clearing methods such as CUBIC have the advantage of preserving protein structure and function due to their use of water-soluble reagents (Matsumoto et al., 2019). Hydrogel-based methods offer additional structural stabilization through crosslinking proteins, nucleic acids, and hydrogel monomers that are in place in preparation for lipid removal (Park et al., 2019). Compared to formalin fixation alone, hydrogel-embedding of brain tissue also results in minimal protein loss during clearing (Chung et al., 2013).
Due to the advantages of hydrogel-based methods, we opted to use the SHIELD protocol (stabilization under harsh conditions via intramolecular epoxide linkages to prevent degradation). After the SHIELD procedure, lipids are washed from the tissue using sodium dodecyl sulfate (SDS). If actively clearing, SDS is driven into the tissue with an electric current (Kim et al., 2015).
The fully cleared tissue can be fluorescently labeled and incubated in an index-matching solution so that its refractive index matches that of a glass cover slip. Previous SHIELD-based studies have successfully characterized the morphology and spatial distribution of cells in tissue sections up to 8 mm thick (Chung and Deisseroth, 2013; Ueda, 2020); tissue thickness is limited by the index of refraction inhomogeneity, which blurs images, and by the optical limitations of the microscope. Another challenge to 3D imaging is laser absorption and scattering by pigmented tissue features such as melanocytes.
Tissue clearing and fluorescent labeling have been successfully employed to image whole mouse brains, approximately 13.2 mm × 11.4 mm × 8 mm (Chung and Deisseroth, 2013; Kim et al., 2015; Yun et al., 2019; Wang et al., 2020) and many human organs, including kidney (approximately 12 × 8 × 5 cm), pancreas (approximately 11.5 × 4 × 2 cm), heart (approximately 12 × 8 × 6 cm), lung (approximately 13 × 8 × 0.5 cm), spleen (approximately 13 × 8 × 4 cm), and 2 mm thick brain 6 cm × 8 cm coronals (Ku et al., 2020; Mai et al., 2022; Shi et al., 2022). Previous studies clearing postmortem human brain sections have required minimal fixation several months of clearing (Chung et al., 2013; Liebmann et al., 2016; Liu et al., 2016; Phillips et al., 2016; Lai et al., 2018; Morawski et al., 2018), or the use of 100 μm sections, cleared over a few weeks, that resulted in warping of the tissue surface (Murray et al., 2015). The utility of tissue clearing has been demonstrated through the qualitative visualization of Alzheimer’s disease (AD) amyloid plaques in humans (Ando et al., 2014). Moreover, 2–5 mm human brain sections have been successfully immunostained and volumetrically visualized with a hydrophobic clearing method (Hildebrand et al., 2019).
One barrier to successful immunofluorescent staining in postmortem human brain tissue is signal specificity. Postmortem human tissue is autofluorescent due to sources such as lipids, lipofuscin, hemoglobin, hemosiderin, collagen, and myelin. Recent protocols have added a photobleaching step to reduce background signal from autofluorescence (Duong and Han, 2013; Ku et al., 2020). Furthermore, antigen sites for stains may be masked by formaldehyde crosslinking. Formaldehyde fixation results in inter- and intramolecular crosslinking that results in redistribution of electrostatic charges and physical hindrance of the antigen site availability (Rait et al., 2004; Boenisch, 2006). Antigen retrieval is a process in which the chemical crosslinking that happens between formaldehyde and amino acids is reversed, making epitopes available for immunochemistry (D’Amico et al., 2009). Protocols for antigen retrieval involve incubating tissue in acidic or basic solutions at near boiling heat, resulting in increased staining quality. The utility of antigen retrieval has been demonstrated in pre-fixed frozen mouse tissue (Ino, 2003), frozen human tissue (Alelú-Paz et al., 2008), as well as thin formaldehyde-fixed paraffin-embedded (FFPE) 3 μm to tens of μm sections of human tissue (Namimatsu et al., 2005; Shi et al., 2007). There is a growing body of literature on optimizing antigen retrieval in thicker sections than light scattering in FFPE allows (Evers and Uylings, 1994; Jiao et al., 1999). Alkaline antigen retrieval has been successfully implemented in 500 μm sections of postmortem human brain tissue to visualize neuronal, glial, and vasculature markers (Pesce et al., 2022). Sodium dodecyl sulfate (SDS) has also been used as a medium for antigen retrieval for tissue-clearing organoids and human organs (Messal et al., 2021).
In this study, we introduced SHARD (SHIELD, antigen retrieval, and delipidation), a method by which SHIELD-treated tissue undergoes citrate-based antigen retrieval, delipidation with SDS, and stained for three-dimensional rendering of targets of interest via fluorescent antibodies and small-molecule dyes. SHARD works well across a range of postmortem intervals and disease states and can also be used in a multiplex staining with up to seven colors. We tested it alongside a SHIELD-only protocol and with an additional photobleaching step. To the best of our knowledge, this is the first instance of quantitative analysis of different tissue-clearing treatments across various neurodegenerative disease states using long-term formaldehyde-fixed human tissue3W. The protocol we developed provides a method for tissue clearing and antigen unmasking that is compatible with long-term formaldehyde-fixed human brain tissue and works with the majority of autopsy tissue currently available from brain banks. SHARD offers key benefits of scalability, simplicity, and the ability to stain and image up to six targets, and it can be widely applied to render markers of interest in three dimensions in a few weeks’ time.
2 Materials and equipment 2.1 Reagents• Paraformaldehyde (PFA, Sigma-Aldrich # S812315 325).
• Sodium Phosphate, dibasic (Sigma-Aldrich # S9763).
• Sodium phosphate, monobasic (Sigma-Aldrich # S8282).
• Sodium-m-periodate (Sigma-Aldrich # 311448).
• L Lysine (Sigma-Aldrich # L8662).
• Sodium Hydroxide (Fisher Scientific # S318).
• Potassium phosphate, dibasic (Sigma-Aldrich # P3786).
• SHIELD Kit (LifeCanvas # SH-250, includes SHIELD-Buffer Solution, SHIELD-Epoxy Solution, and SHIELD ON).
• Triton X-100 (Fisher Scientific # BP151).
• Normal Donkey Serum (Jackson ImmunoResearch # NC9624464).
• Sodium chloride (Sigma-Aldrich # S5886).
• Agarose, low gelling (Sigma-Aldrich # A9414).
• Citric acid (Sigma-Aldrich # C7129).
• Sodium citrate tribasic dihydrate (Sigma-Aldrich # S4641).
• Sodium dodecyl sulfate (Fisher Scientific # BP166).
• Boric acid (Sigma-Aldrich # B7901).
• Sodium sulfite anhydrous (Fisher Scientific # S430).
• Tris Base (Fisher Scientific # BP154).
• EDTA 0.5 M, pH 8 (Invitrogen # 15575–038).
• Tween (Thermo Scientific # J20605).
• Hydrogen peroxide (Fisher Scientific # H325).
• Sucrose (Sigma-Aldrich # S0389).
• 10% buffered formalin phosphate (Fisher Scientific # SF100).
• Sodium azide (Sigma-Aldrich # S2002).
• Tomato lectin DyLight 488 conjugate (Vector Laboratories # DL-1174).
• Primary antibodies: see Table 1.
• Alexa Fluor® 750-Anti-Mouse (abcam # ab175738).
• Alexa Fluor® 647-Anti-Mouse (Jackson ImmunoResearch # 715–605-150).
• Alexa Fluor® 647-Anti-Rabbit (Jackson ImmunoResearch # 711–605-152).
• Alexa Fluor® 594-Anti-Chicken (Jackson ImmunoResearch # 703–585-155).
• Alexa Fluor® 594-Anti-Goat (Jackson ImmunoResearch # 705–585-003).
• Cy3-Anti-Goat (Jackson ImmunoResearch # 705–165-147).
• Cy3-Anti-Rabbit (Jackson ImmunoResearch # 711–167-003).
• Cy3-Anti-Chicken (Jackson ImmunoResearch # 703–166-155).
• Alexa Fluor® 488-Anti-Mouse (Jackson ImmunoResearch # 715–545-150).
• Alexa Fluor® 488-Anti-Rabbit (Jackson ImmunoResearch # 711–545-152).
• EasyIndex (LifeCanvas # EI-500-1.52).
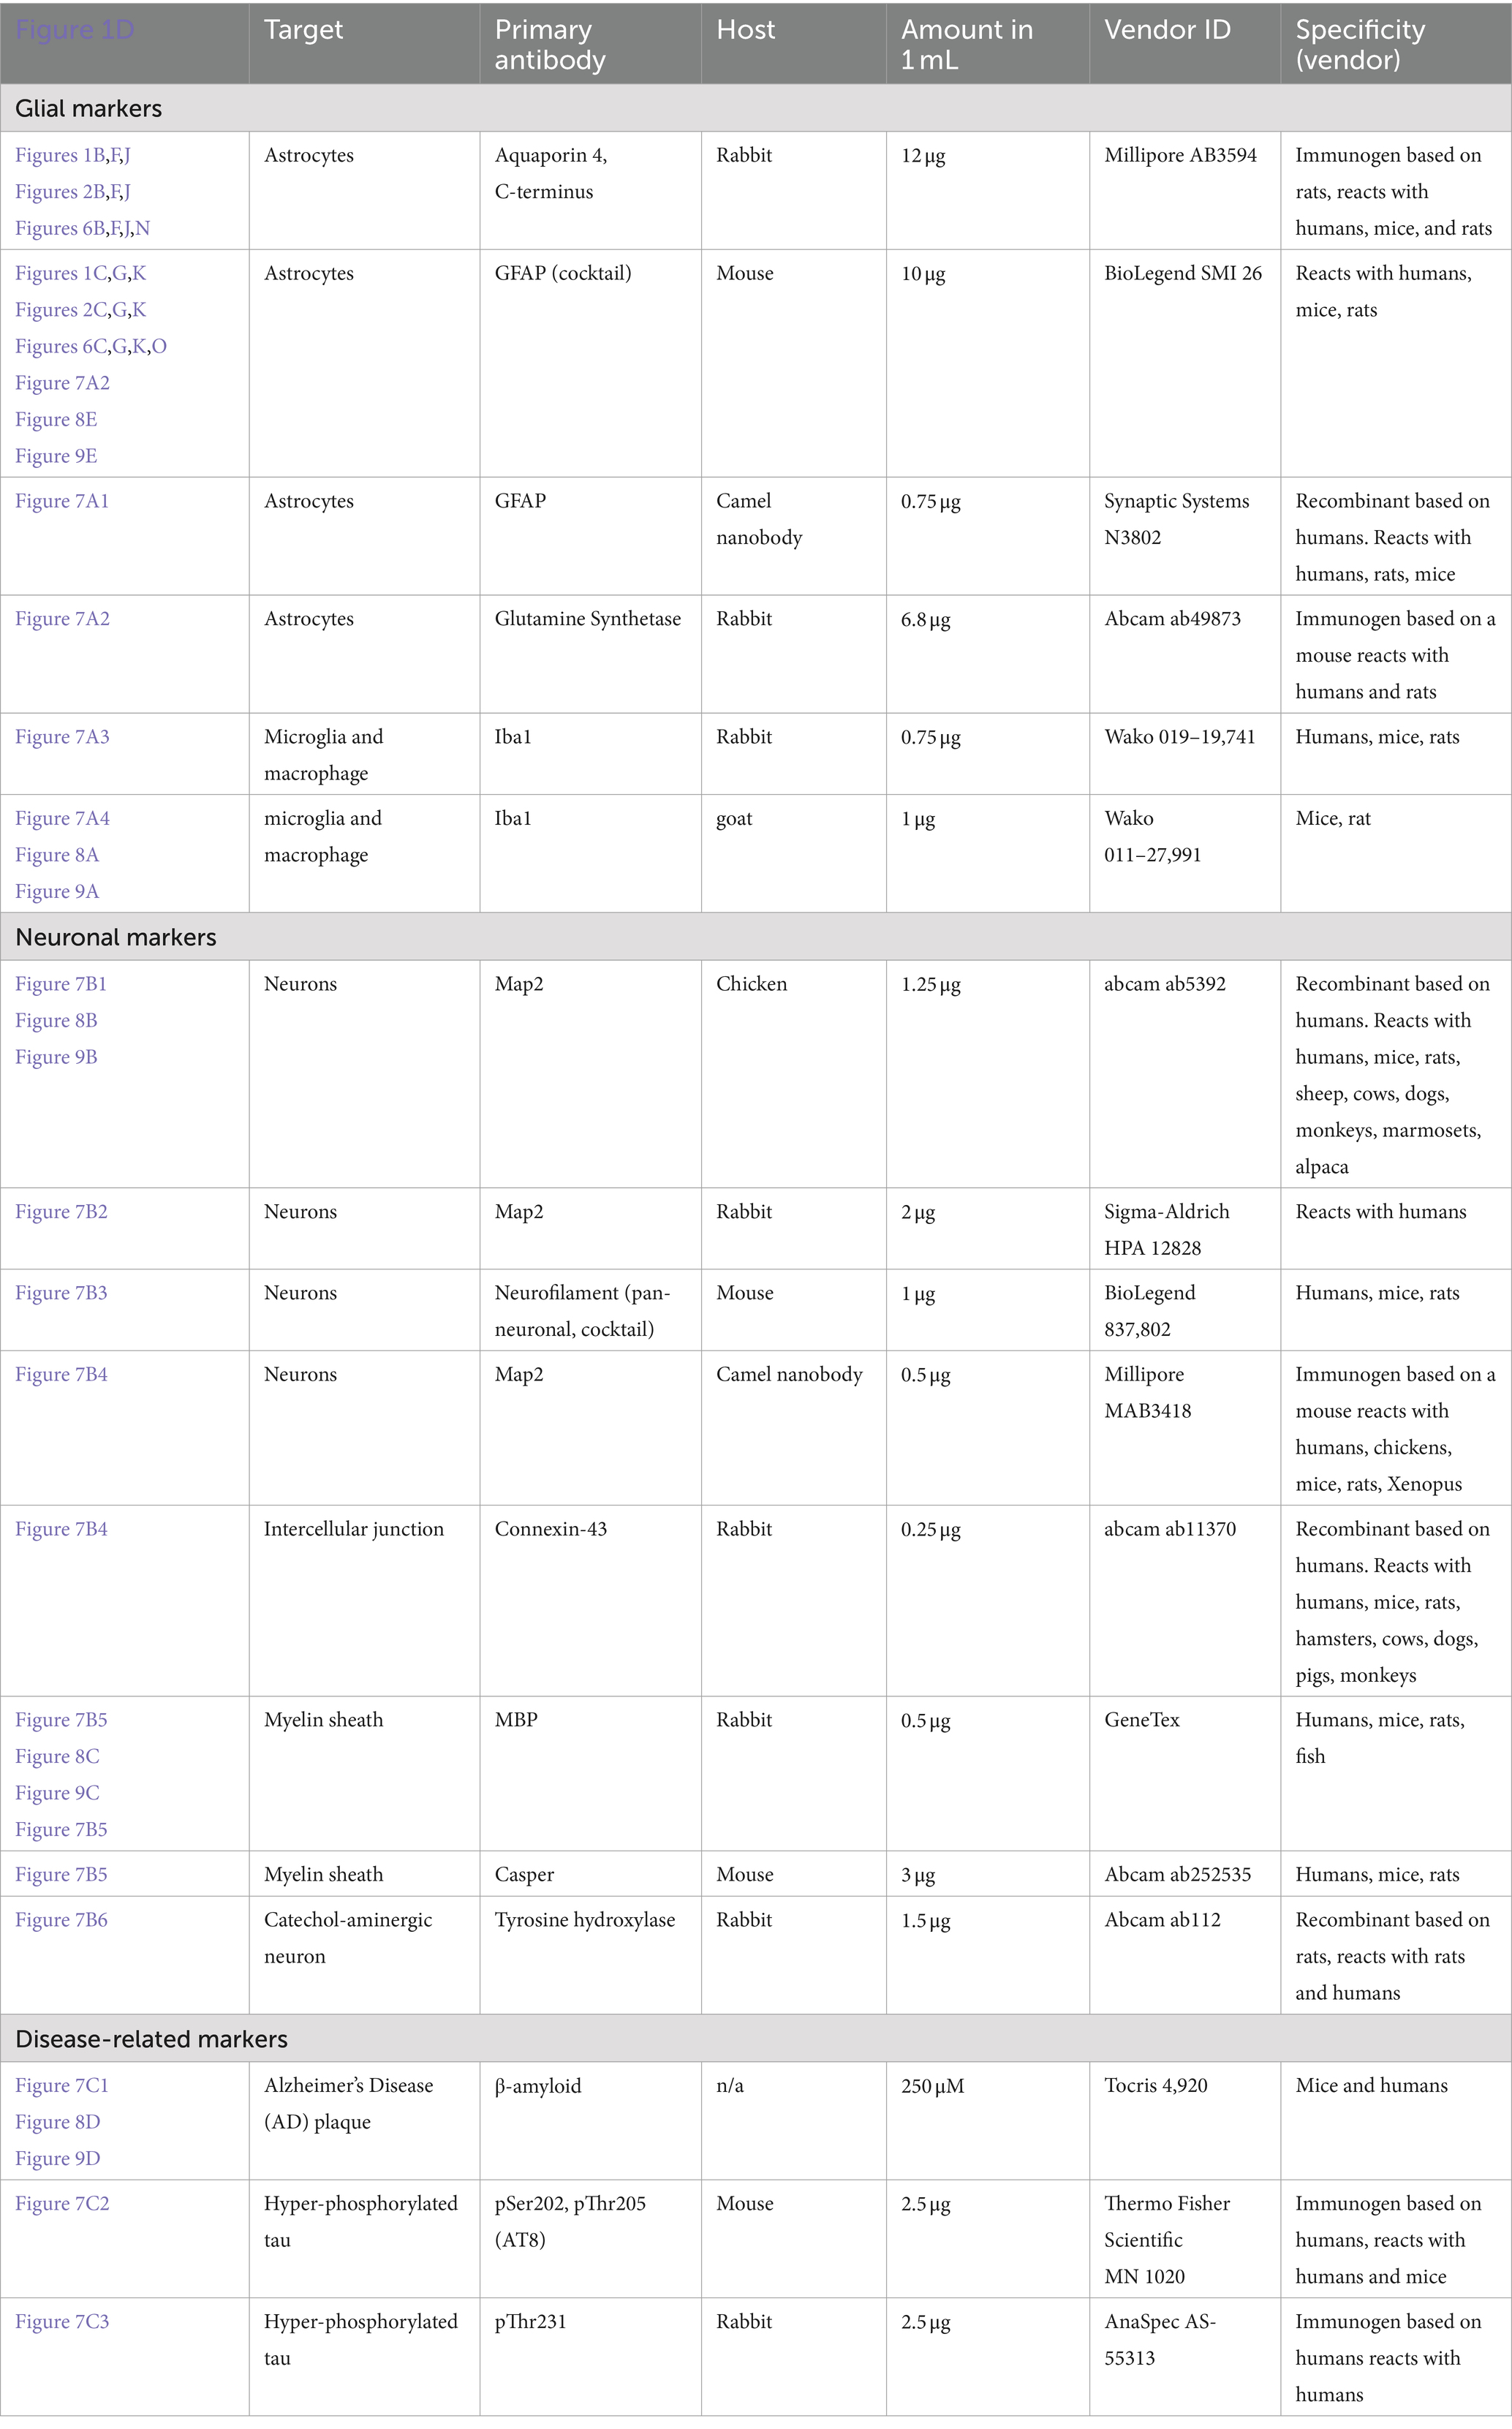
Table 1. Detailed information on the primary antibodies used.
2.2 Materials/equipment• Vibratome (Precisionary Instruments, Inc. # VF-700-0Z).
• Microscope Slides, Precleaned (Fisher Scientific # 12–550-15).
• No. 1.5 Coverglass, 22 × 30 mm (Corning # 2980–223).
• Zeiss 880 LSM Confocal Microscope with Airyscan and 20x PLAN APO Lens, 0.8 numerical aperture (NA), (Zeiss).
• Nikon Ti2 Eclipse Crest V2 spinning disc confocal microscope with 60x PLAN APO λD, 1.42 NA oil, and 100x CFI PLAN APO D 1.45 NA oil objective lenses, as well as a 20x CFI PLAN APO D, 0.8 NA lens.
• Nikon AX-R confocal microscope with 40x CFI PLAN APO silicone oil lens, 1.25 NA with cover glass thickness correction collar set to 0.17 mm, 60x CFI PLAN APO λD, 1.42 NA oil lens, 20x CFI PLAN APO λD, 0.8 NA lens, or 4x CFI PLAN APO λD 0.20 NA lens, equipped with one multi-alkaloid (MA) detector, two tunable GaAsP detectors, one non-tunable GaAsP detector, and seven laser lines: 405, 488, 514, 561, 594, 633, and 730 nm.
2.3 Solution formulations• Periodate-Lysine-Paraformaldehyde (PLP): Heat 1 L of deionized water to 60°C. Add 80 g of paraformaldehyde and 44 g of sodium phosphate dibasic. Cool the solution to room temperature using a water bath. Add 12 g of sodium phosphate monobasic and 8.6 g L of L-lysine Filter the solution and add deionized (DI) water to reach a total volume of 4 L. Adjust the pH to 7.4 using sodium hydroxide.
• SHIELD OFF solution (per 25 mm × 25 mm × 3 mm sample): Mix 5 mL of DI water, 5 mL of SHIELD-buffer solution, and 10 mL of SHIELD-epoxy solution.
• 25x phosphate-buffered saline (PBS): Dissolve 188 g of potassium phosphate dibasic in approximately 800 mL of deionized water, heating as needed. Add sodium phosphate monobasic and sodium chloride and stir until fully dissolved. Cool the solution and dilute it to a final volume of 1 L.
• PBS: Mix 40 mL of 25x stock solution with 960 mL of deionized water.
• 10 mM citrate: Mix 14 mL of 0.1 M citric acid with 86 mL of 0.1 M sodium citrate. Add 900 mL of deionized water to achieve a total volume of 1 L.
• 30% sucrose: Dissolve 300 g of sucrose into 1 L of PBS.
• Passive clearing buffer: Prepare a buffer containing 300 mM sodium dodecyl sulfate (SDS), 10 mM boric acid, and 100 mM sodium sulfite. Adjust the pH to 9.
• PBST: Add 4 mL of Triton X-100 to 996 mL of PBS to make 1 L of PBST.
• Alkaline antigen retrieval solution: Prepare a solution with 10 mM Tris base, 1 mM EDTA, and 0.05% Tween. Adjust the pH to 9.
• 5% donkey serum (DKS): Dilute 50 μL of donkey serum in 950 μL of PBST.
• Primary antibody solution: Add the specified amounts of primary antibodies from Table 1, along with 10 μL of DKS, and adjust the volume to 1 mL with PBST.
• Secondary antibody solution: Prepare the secondary antibody of choice at a 2:1 molar ratio of secondary to the primary antibody, add 10 μL of DKS, and adjust the volume to 1 mL with PBST.
• 4% PFA 1 Prepare a 1:2.5 dilution of 10% PFA stock in PBS to make 4% PFA.
• 0.02% sodium azide tissue storage solution: Dissolve 2 g of sodium azide in 1 L of PBS.
2.4 Software and computer• Zen (Black Edition) with Airyscan Deconvolution (Zeiss).
• Nikon Elements Advanced Research 6.02.01 (Nikon).
• Imaris 10.0 (Oxford Instruments) running on a Windows 10 system with an Intel® Xeon® Gold 5,218 CPU @ 2.30 GHz and 2.29 GHz processors, 192 GB of RAM, and an NVIDIA RTX A6000 Graphics Card.
• Arivis Pro, running on a Windows 11 system with an AMD Ryzen Threadripper PRO 5995WX with 64 cores @ 2.70 GHz, 512 GB of RAM, and an NVIDIA RTX A6000 Graphics Card.
3 Methods 3.1 Study design and brain donorsAutopsy participants included 21 brain donors from three brain banks housed at VA Boston Healthcare System with harmonized neuropathological processing protocols and diagnostic procedures: Understanding Neurological Injury and Traumatic Encephalopathy (UNITE, n = 13), Boston University Alzheimer’s Disease Research Center (ADRC n = 3), and the National Posttraumatic Stress Disorder Brain Bank (NPBB, n = 5). UNITE’s objective is to characterize the neuropathology and clinical-pathological correlates of CTE and repetitive head impacts (Mez et al., 2015; Alosco et al., 2021). The ADRC longitudinally follows its participants to collaborate with the National Alzheimer’s Coordinating Center to study Alzheimer’s Disease (AD) and related dementia (Gavett et al., 2012). The NPBB facilitates research on the cause, progression, and treatment of PTSD (Friedman et al., 2017). Consents for brain donation and research participation were provided by the donors’ next of kin. Institutional review boards from the Boston University Medical Center and VA Boston Healthcare System approved brain donation, postmortem clinical record review, neuropathological evaluation, and clinical interviews with donor family members. Cases were coded as “u,” “p,” or “a,” depending on whether they came from the UNITE, NPBB, or ADRC brain banks (Table 2).
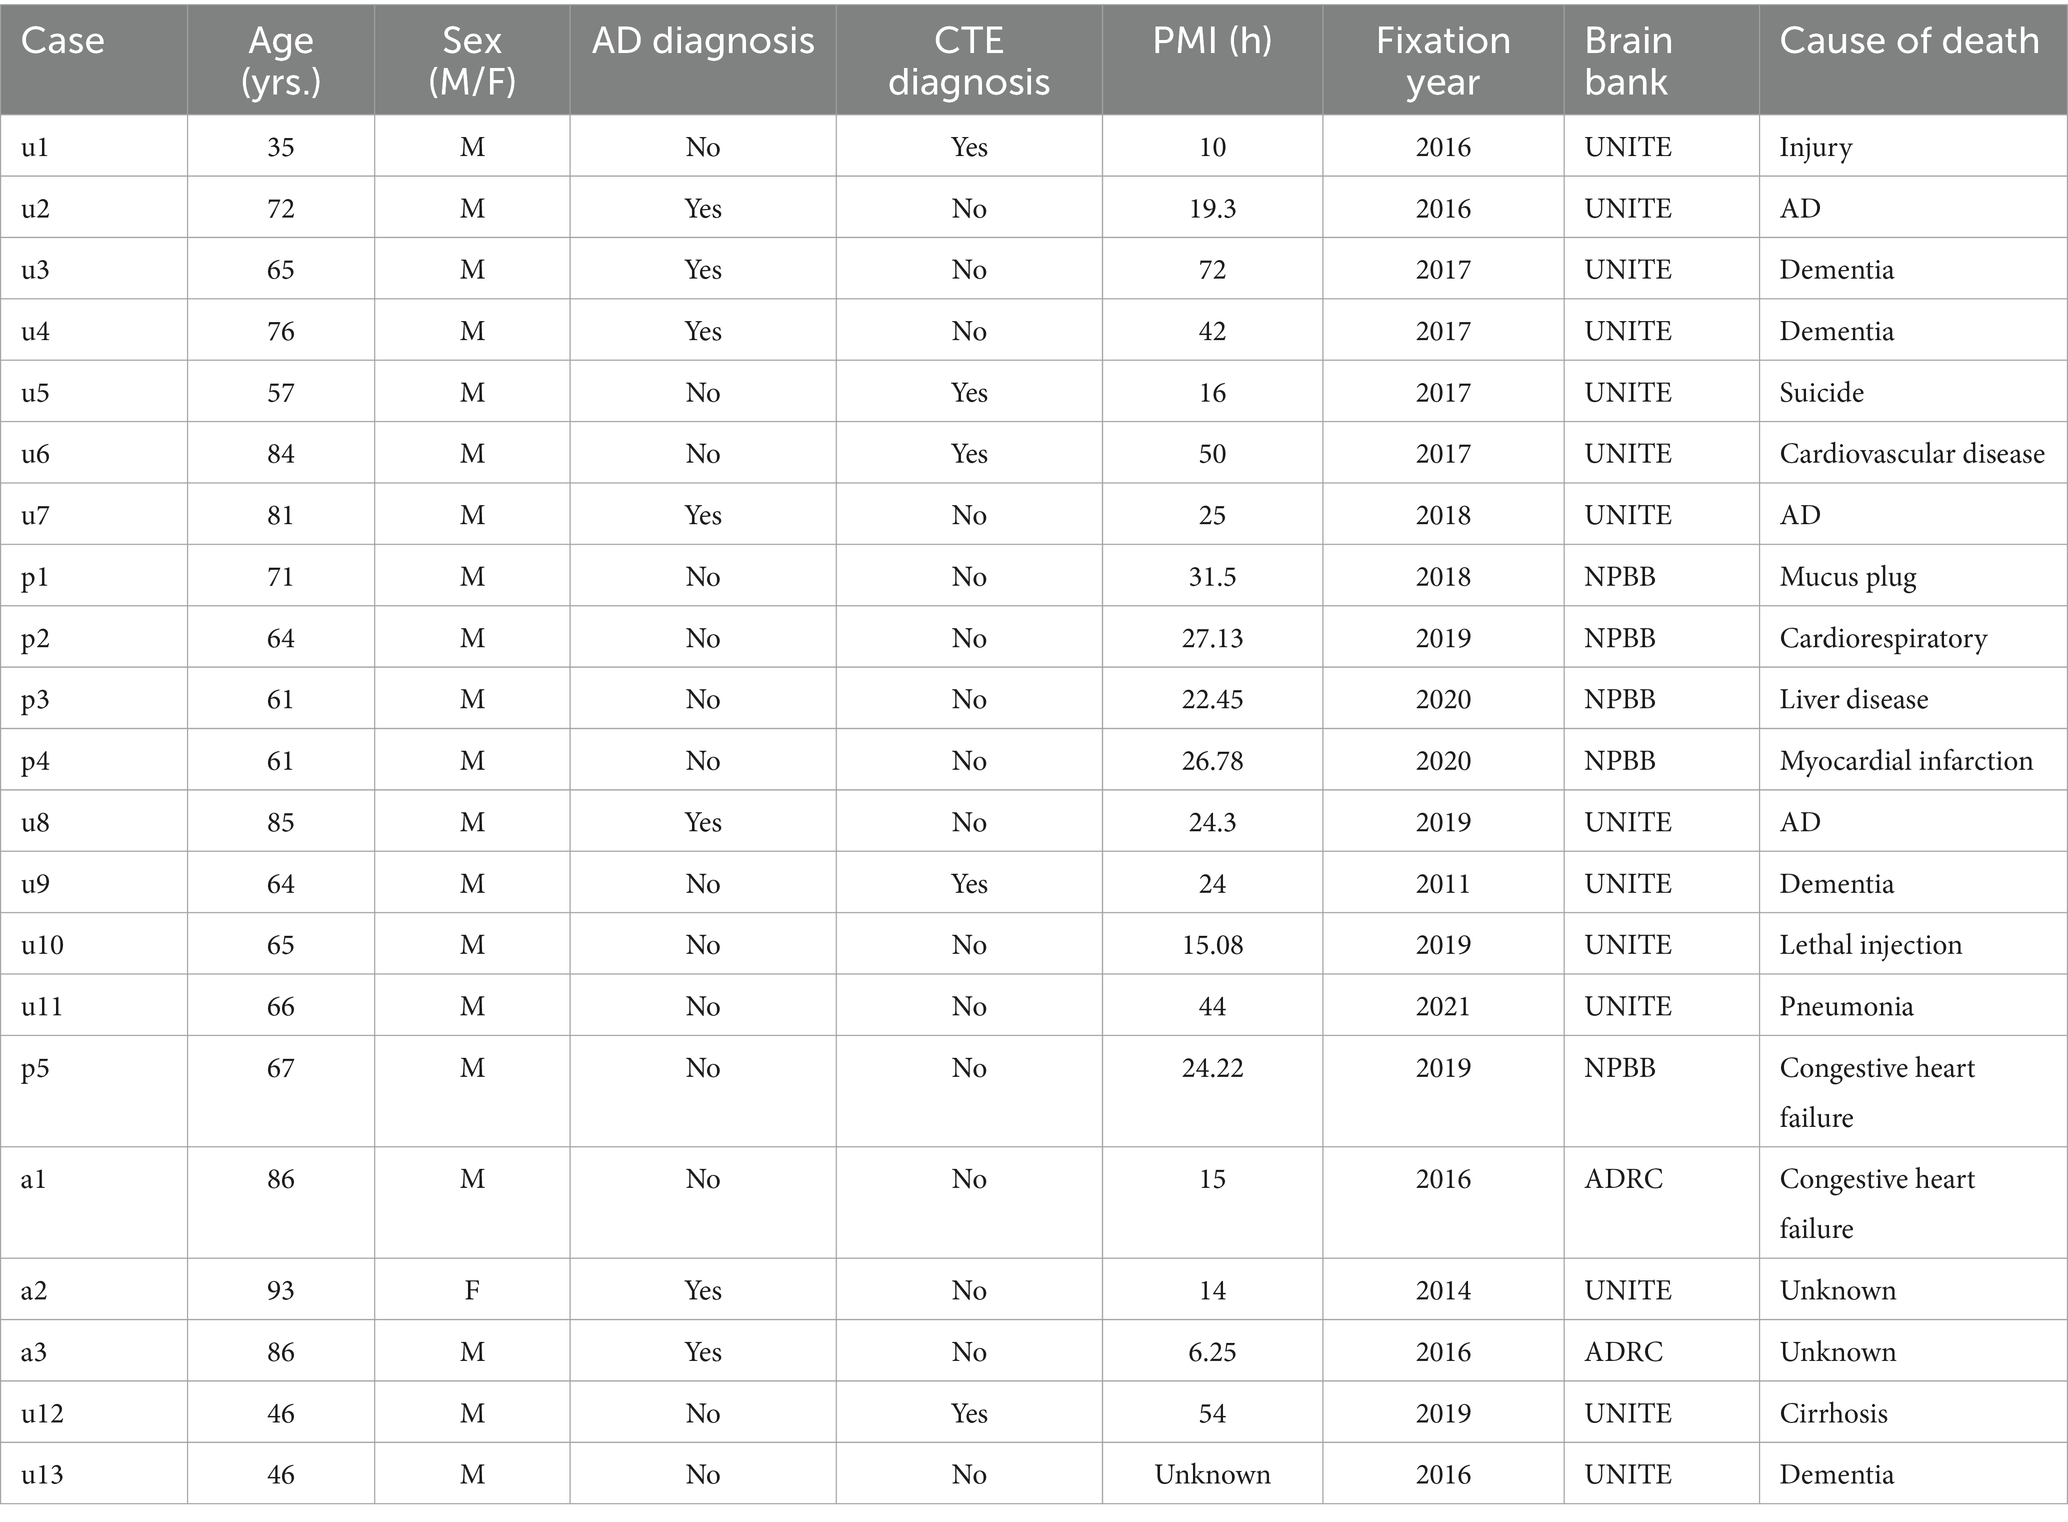
Table 2. Demographics and neuropathological diagnoses of the cases studied.
We examined 11 cases for quantification of the effectiveness of the three different treatment conditions and 10 further cases for staining with additional antibodies. Cases u1-7 and p1-4 were used for the quantification of tomato lectin, aquaporin-4, and GFAP staining. The postmortem interval (PMI) of these cases ranged from 10 to 72 h. The PMI here is defined by the difference between the time of death and brain removal. The cases had been stored at 4° C in Periodate-Lysine-Paraformaldehyde (PLP) for up to five years at the time of staining. There was a mix of healthy controls (n = 4), CTE cases (n = 3), and AD cases (n = 4). The 10 cases stained with additional antibodies had PMI values ranging from 6.25 to 54 h and included cases that had been stored in PLP for 1–10 years at the time of staining.
3.2 Clinical assessment and diagnosisDemographic information, medical history, and other antemortem clinical variables were obtained during retrospective clinical evaluation with informants for all brain donors and included a detailed assessment of repetitive head impact exposure and traumatic brain injury history for the UNITE brain bank (Mez et al., 2015; Alosco et al., 2021). Tissue acquisition, processing, diagnostic assessment protocols, ethical considerations, governance, and oversight of the VA National PTSD Brain Bank were previously described (Friedman et al., 2017). Details on the procedures of the BU ADRC brain bank are available in prior publications (Gavett et al., 2012; Alosco et al., 2021). Diagnoses for Alzheimer’s disease were assigned according to the National Institute on Aging-Alzheimer’s Association guidelines (Montine et al., 2012).
3.3 Tissue processing and pathological assessmentPostmortem brain tissue was fixed in periodate-lysine-paraformaldehyde (PLP) for at least 3 months at 4°C. Neuropathological assessment was performed using procedures previously established (Vonsattel et al., 2008; Mez et al., 2015). Neuropathological evaluations were made by board-certified neuropathologists (ACM, TDS, BRH) according to published diagnostic criteria and were kept blinded to antemortem clinical information (Mez et al., 2015).
3.4 SHIELD post-fixationPLP-fixed dorsolateral prefrontal cortex (DLF, Brodmann area 46) tissue blocks were harvested with a 16 × 16 mm2 leather punch with a thickness of 3 mm. Tissue harvesting was based on a standardized blocking scheme that is used in all cases. The 16 × 16 × 3 mm tissue sections were incubated in SHIELD OFF solution (LifeCanvas SHIELD-buffer solution, LifeCanvas SHIELD-Epoxy solution, and deionized water) for 3 days with shaking at 4°C (LifeCanvas, Cambridge, MA). Sections were transferred to LifeCanvas SHIELD ON buffer and incubated for 24 h. with shaking at 37°C and stored in phosphate-buffered saline (PBS) with 0.02% sodium azide for up to several weeks. SHIELD-preserved sections were embedded in 2% agarose gel and cut into 200 μm slices using a vibratome (VF-700-0Z Microtome, Precisionary Instruments, Inc., Natick, MA). Slices were stored in PBS with 0.02% sodium azide for up to a few months.
3.5 Tissue clearing and antigen retrievalA summary of the three tissue treatment conditions quantified can be found in Table 3.
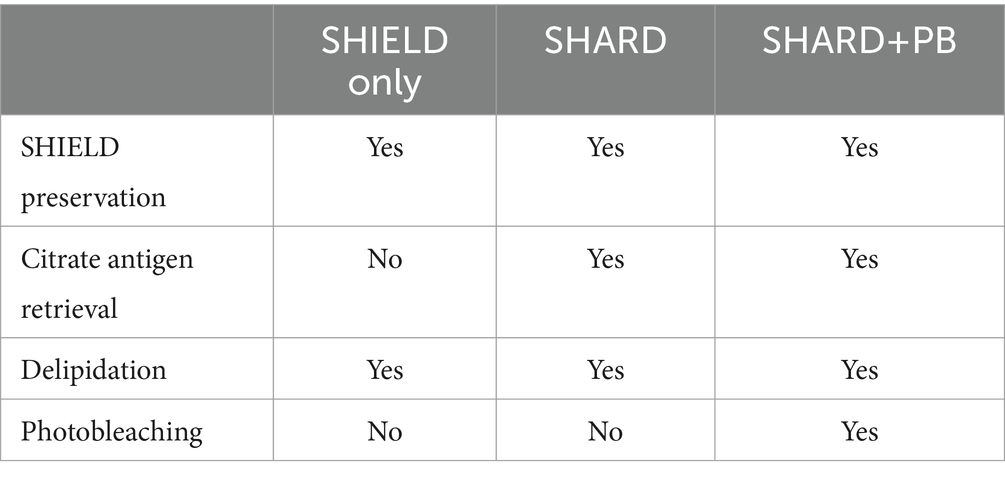
Table 3. Summary of tissue treatment conditions.
3.5.1 SHIELD only conditionFor tissue subjected to the “SHIELD only” treatment, the delipidation step was started immediately after the SHIELD treatment. Delipidation consists of overnight incubation at 37°C with light shaking in a passive clearing buffer. Slices were subsequently washed twice with PBST at room temperature (RT) with light shaking to wash out the SDS.
3.5.2 SHARD conditionTissue slices that underwent antigen retrieval were incubated with 10 mM citrate buffer overnight at 4°C. The next day, slices were incubated in 10 mM citrate buffer at 95°C for 15 min before transferring to 30% sucrose in PBS at 4°C, where they remained for a few hours or overnight until they sank in the solution. Slices were then delipidated overnight as described above. The “SHARD” condition refers to tissue slices that were stained immediately after this point.
3.5.3 SHARD+PB conditionAfter antigen retrieval with citrate and delipidation, sections were photobleached with white light LEDs. Sections that were photobleached were done so for 5 days in PBST, as previously described (Ku et al., 2020). This treatment is referred to as “SHARD+PB” throughout the paper.
In summary, these three conditions will be called “SHIELD only” (delipidation without antigen retrieval or photobleaching), “SHARD” (SHIELD and antigen retrieval), and “SHARD+PB” (SHIELD, antigen retrieval, and photobleaching). These conditions are compared qualitatively and quantitatively in Figures 1–5.
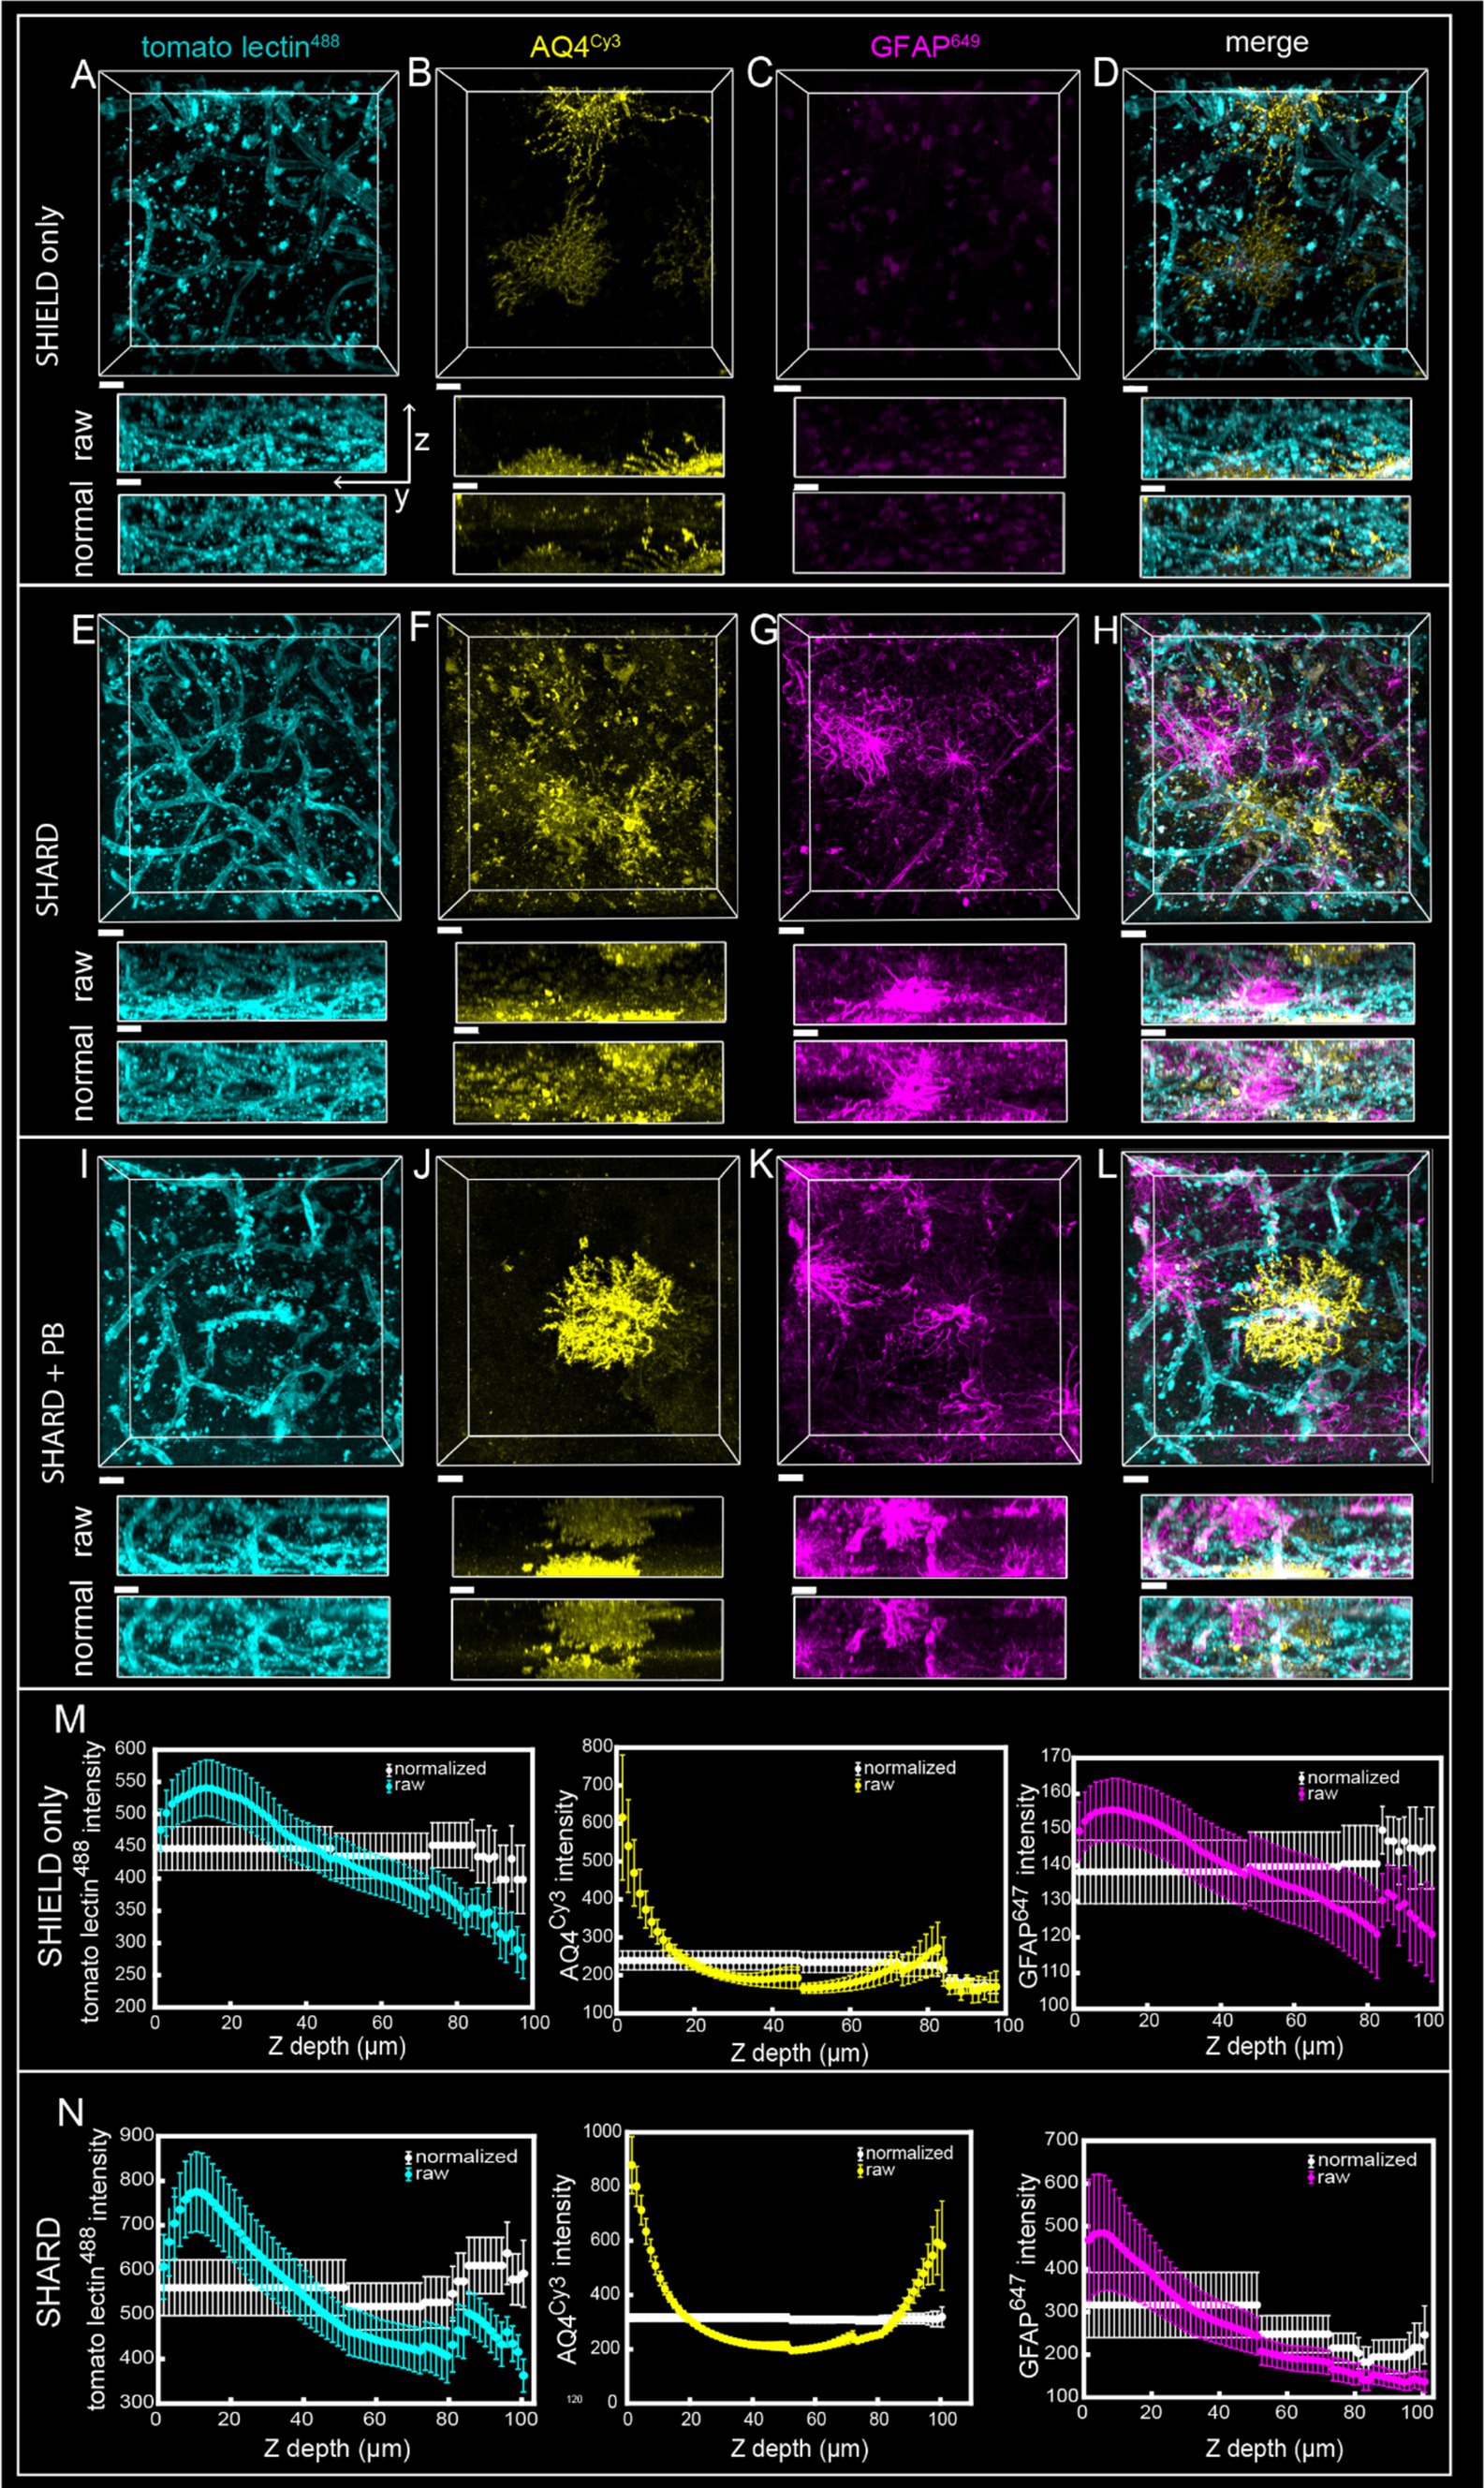
Figure 1. Comparison of SHIELD only, SHARD, and SHARD+PB conditions in the gray matter. 3D image stacks of immunofluorescent stains in the DLF gray matter resulting from the three experimental conditions: (A–D) SHIELD only, (E–H) SHARD, (I–L) SHARD+PB. The three stains shown are tomato lectin488(A,E,I), anti-AQ4Cy3(B,F,J), and anti-GFAP647(C,G,K). The overlay of all three is shown in (D,H,L). All images are from the same 64-year-old case with no neurodegenerative disease. Scale bar = 20 μm, 72 μm Z-stacks. Display parameters for the dynamic range were held constant for each stain between conditions. (M,N) Intensity vs. imaging depth plots averaged over the 11 quantified cases for tomato lectin488 (left), AQ4Cy3 (middle), and GFAP647 (right). Raw pixel intensity (colored) and normalized pixel intensities (white) are both plotted for SHIELD-only tissue treatment (M) and SHARD tissue treatment (N).
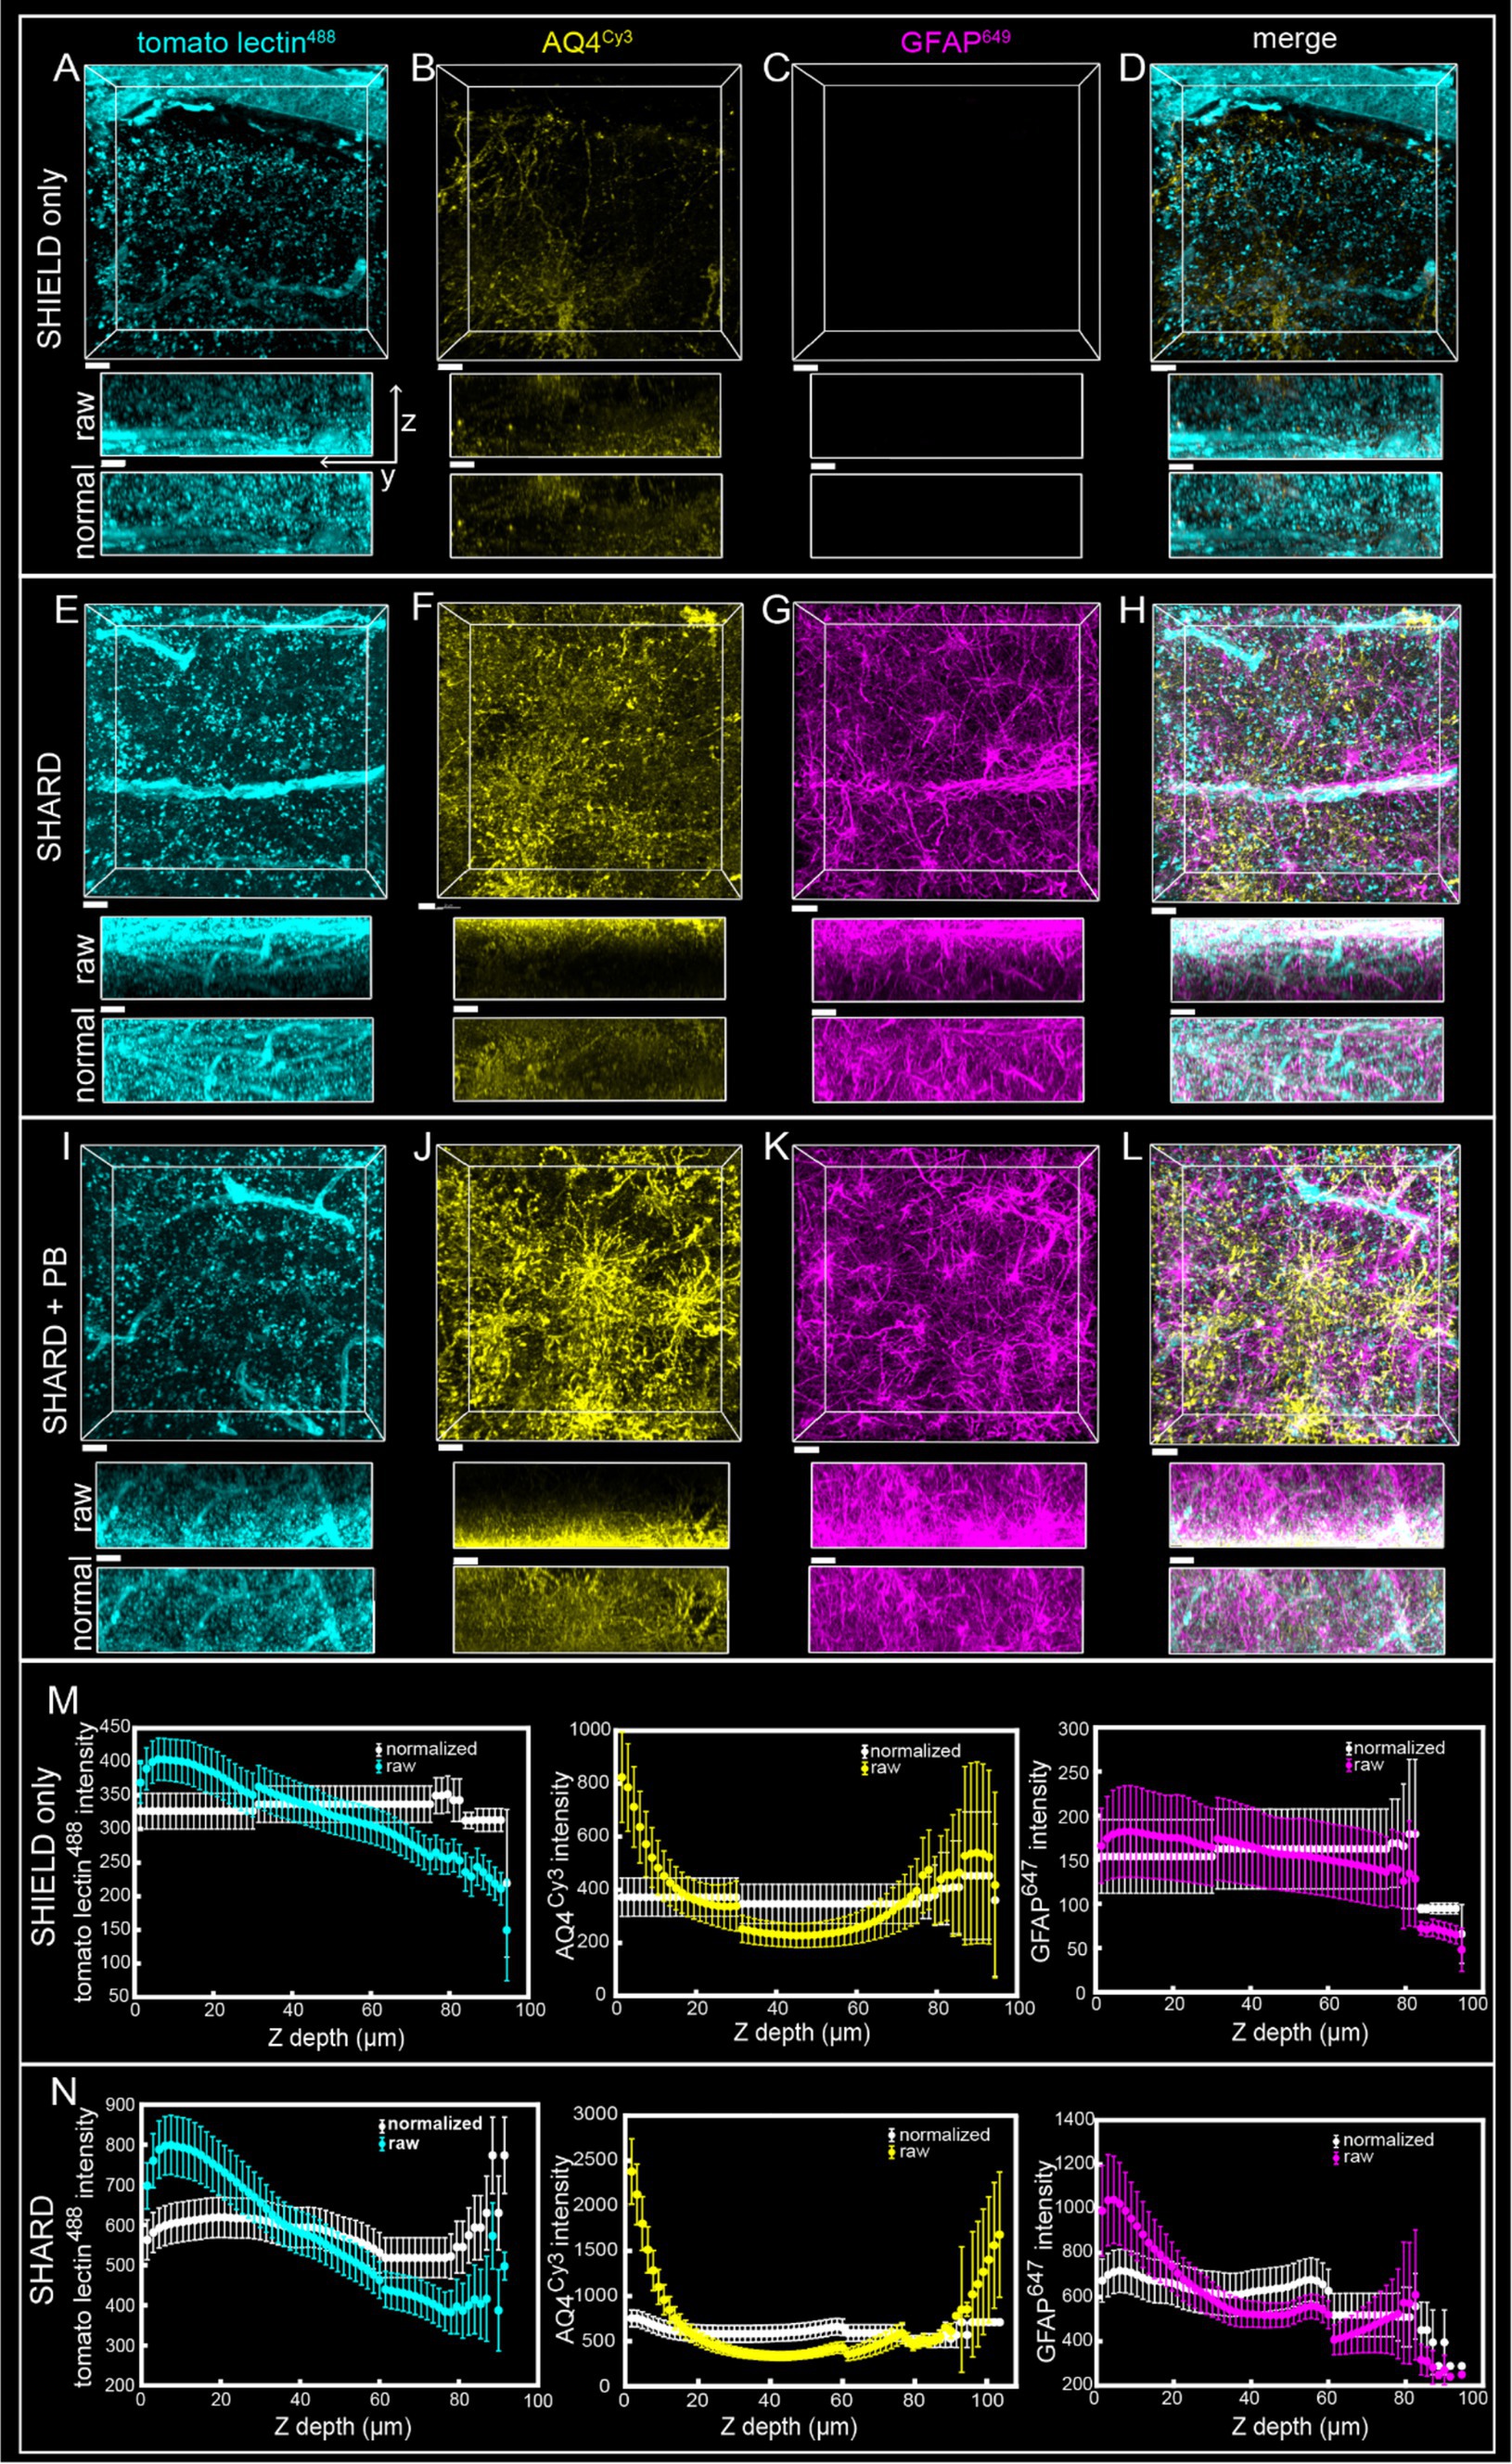
Figure 2. Comparison of SHIELD only, SHARD, and SHARD+PB conditions in the white matter. 3D image stacks of immunofluorescent stains in the DLF white matter resulting from the three experimental conditions: (A–D) SHIELD only, (E–H) SHARD, and (I–L) SHARD+PB. For each image, the views displayed are xy (top) and yz (middle and bottom). The middle yz view shows raw pixel intensity, whereas the bottom yz view shows pixel intensity after running normalized layers preprocessing in Imaris. The three stains shown are tomato lectin488(A,E,I), anti-AQ4Cy3(B,F,J), and anti-GFAP647(C,G,K). The overlay of all three is shown in (D,H,L). Images are taken using tissue donated by the same individual as Figure 1. Scale bar = 20 μm, 72 μm Z-stacks. Display parameters for the dynamic range were held constant for each stain between conditions. (M,N) Intensity vs. imaging depth plots averaged over the 11 quantified cases for tomato lectin488 (left), AQ4Cy3 (middle), and GFAP647 (right). Raw pixel intensity (colored) and normalized pixel intensities (white) are both plotted for SHIELD-only tissue treatment (M) and SHARD tissue treatment (N).
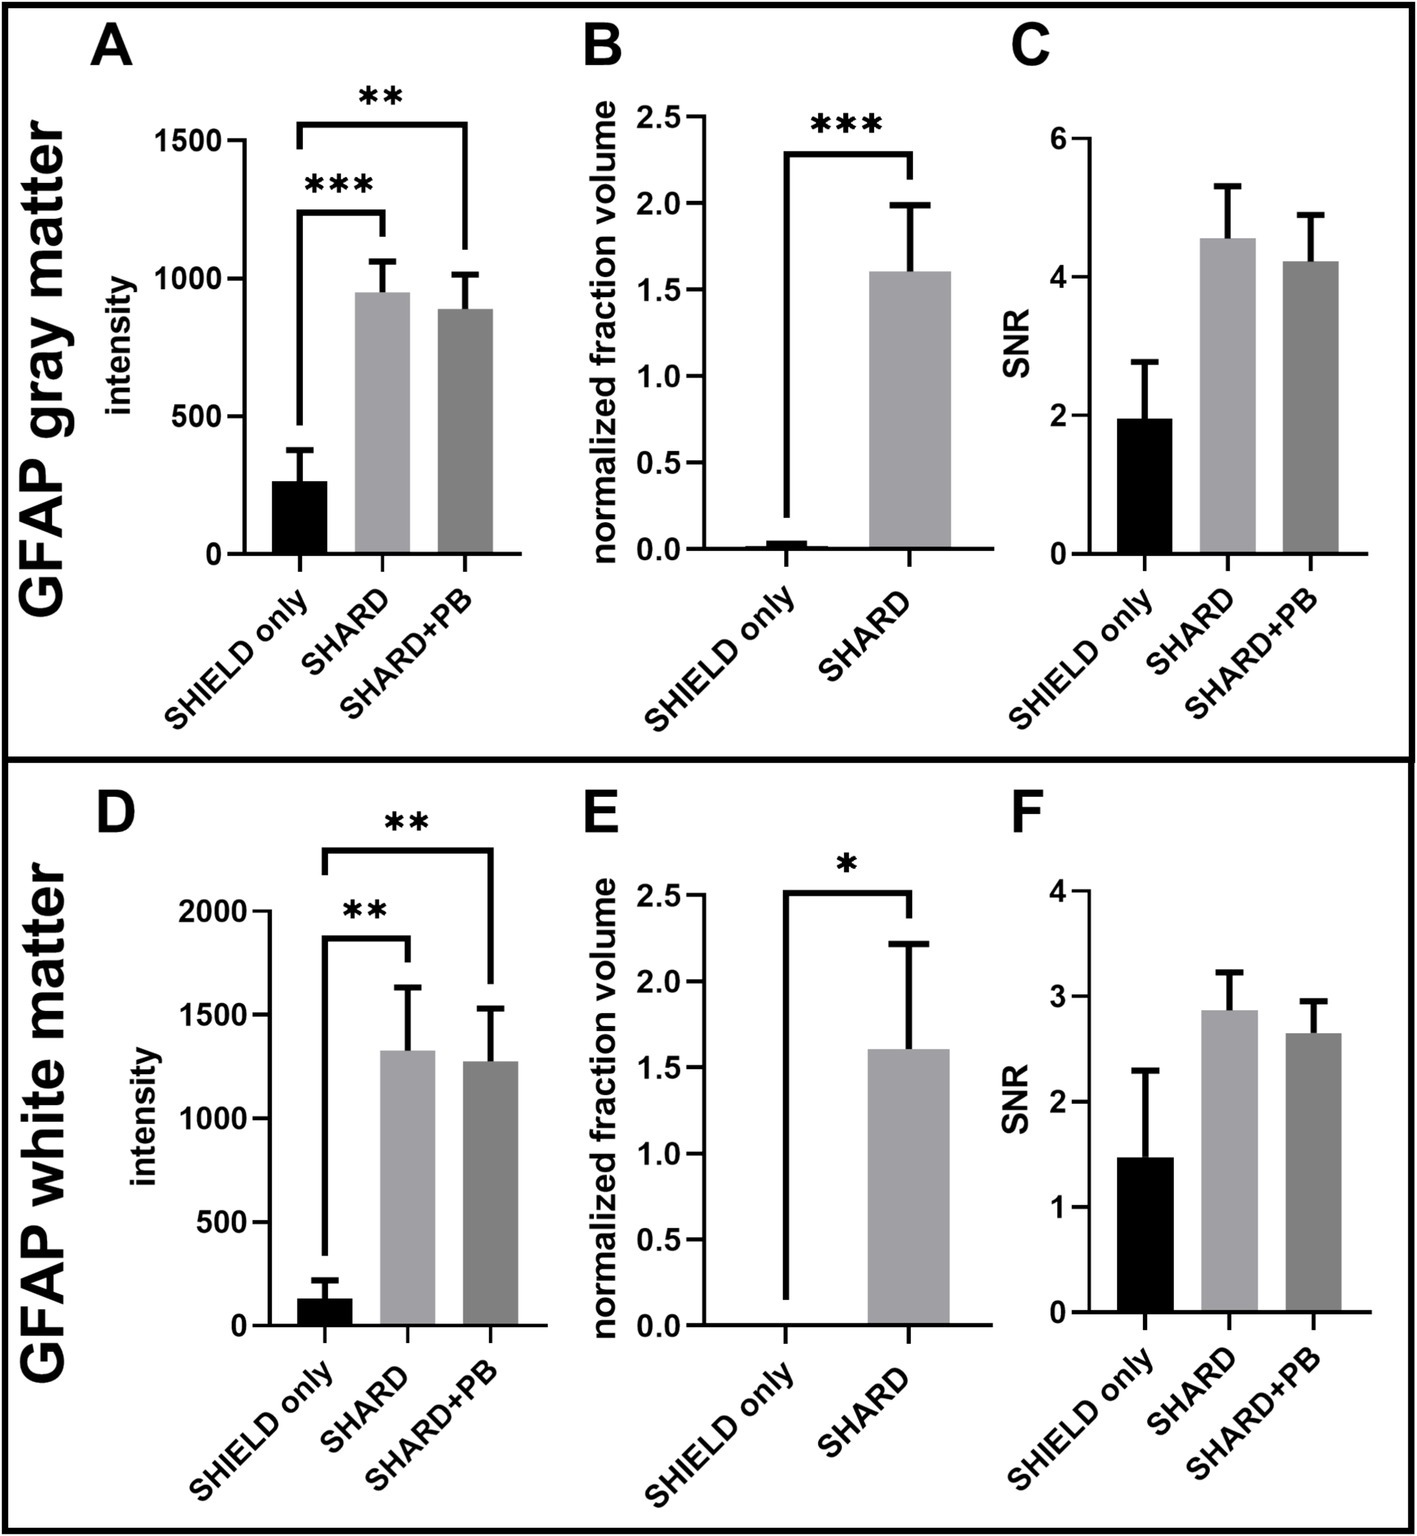
Figure 3. Quantification of GFAP647 staining across the three experimental conditions in DLF tissue. (A) GFAP647 signal intensity in the gray matter, (B) GFAP647 normalized detected fraction volume in the gray matter, (C) GFAP647 signal-to-noise ratio in the gray matter, (D) GFAP647 signal intensity in the white matter, (E) GFAP647 normalized detected fraction volume in the white matter, and (F) GFAP647 signal-to-noise ratio in the white matter. *p < 0.05, **p < 0.01, ***p < 0.001.
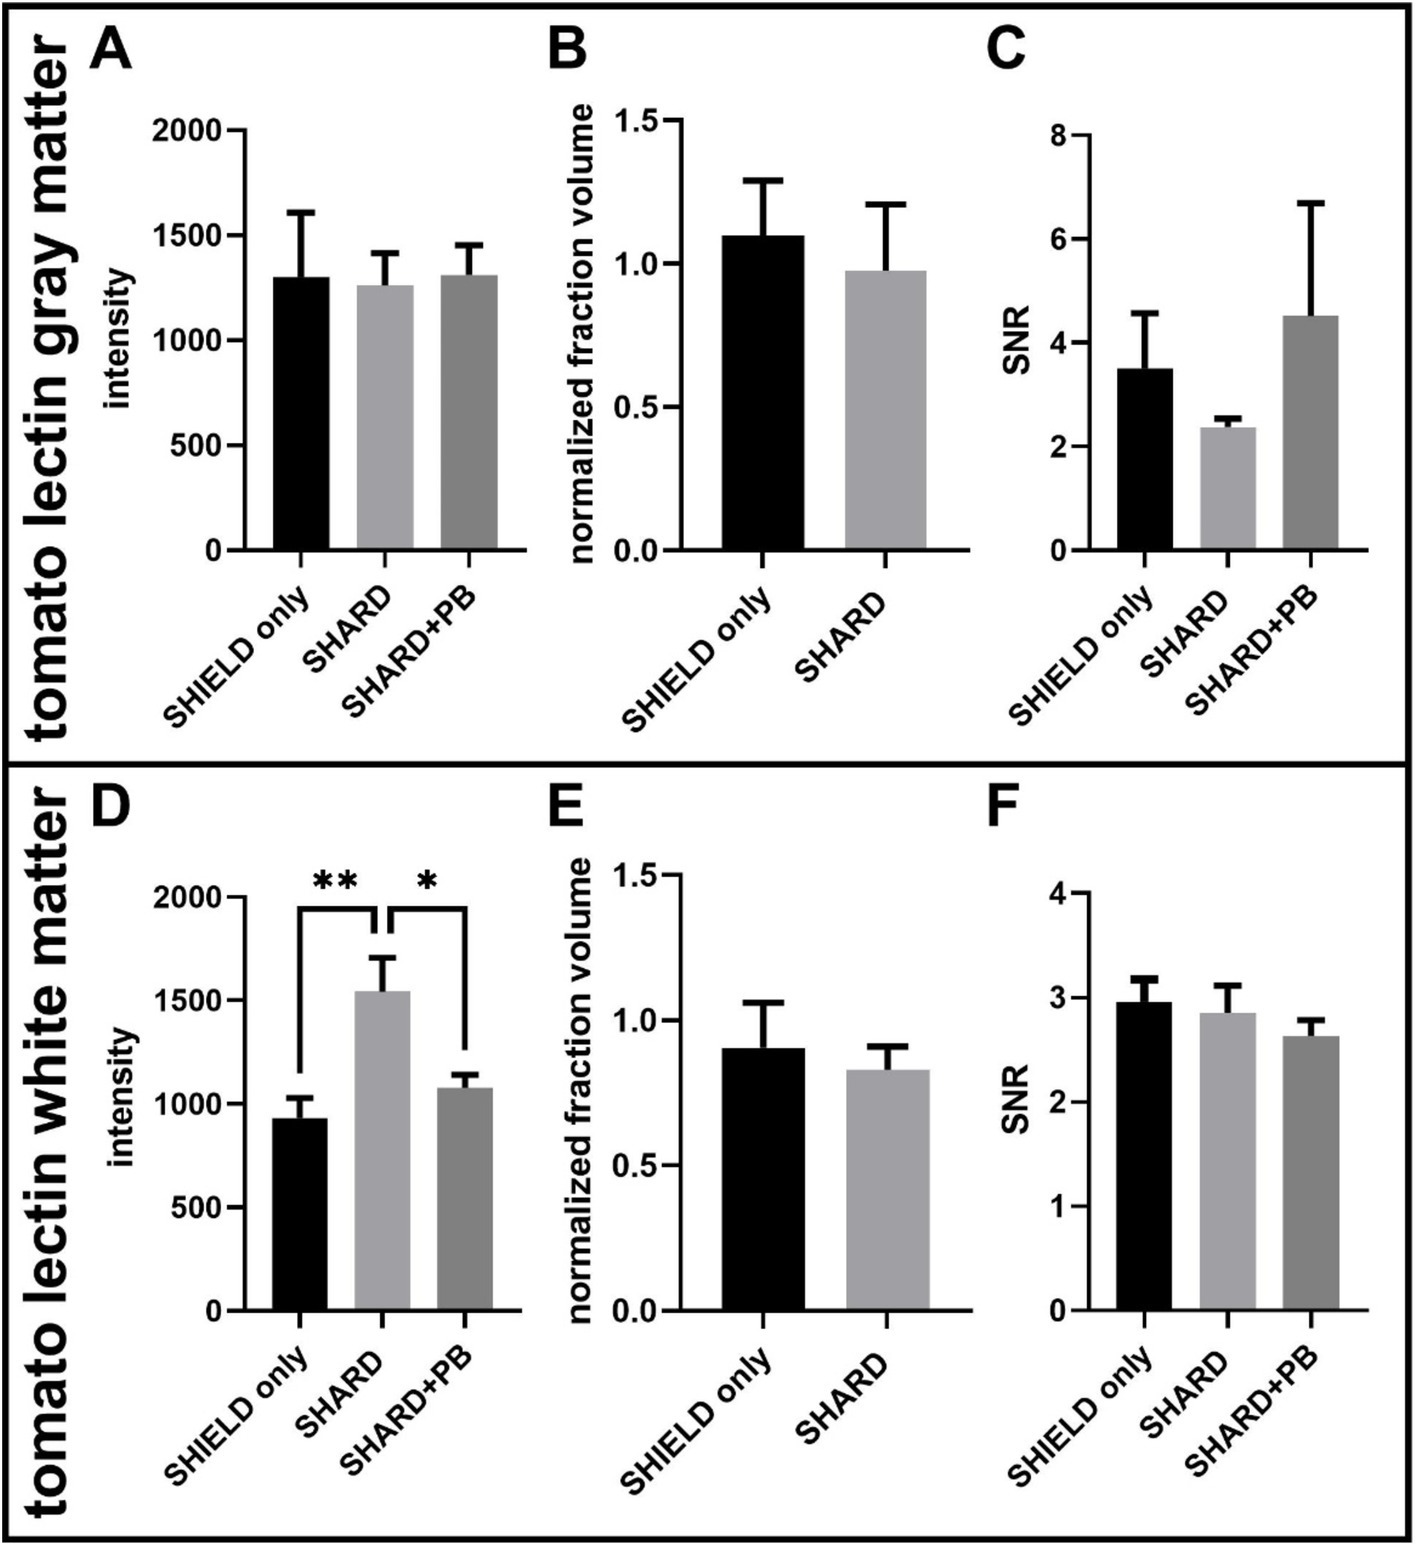
Figure 4. Quantification of tomato lectin488 staining across the three experimental conditions in DLF tissue. (A) Tomato lectin488 signal intensity in the gray matter, (B) tomato lectin488 normalized detected fraction volume in the gray matter, (C) tomato lectin488 signal to noise ratio in the gray matter, (D) tomato lectin488 signal intensity in the white matter, (E) tomato lectin488 normalized detected fraction volume in the white matter, and (F) tomato lectin488 signal to noise ratio in the white matter. *p < 0.05, **p < 0.01. For each condition, the number of cases was 11 cases.
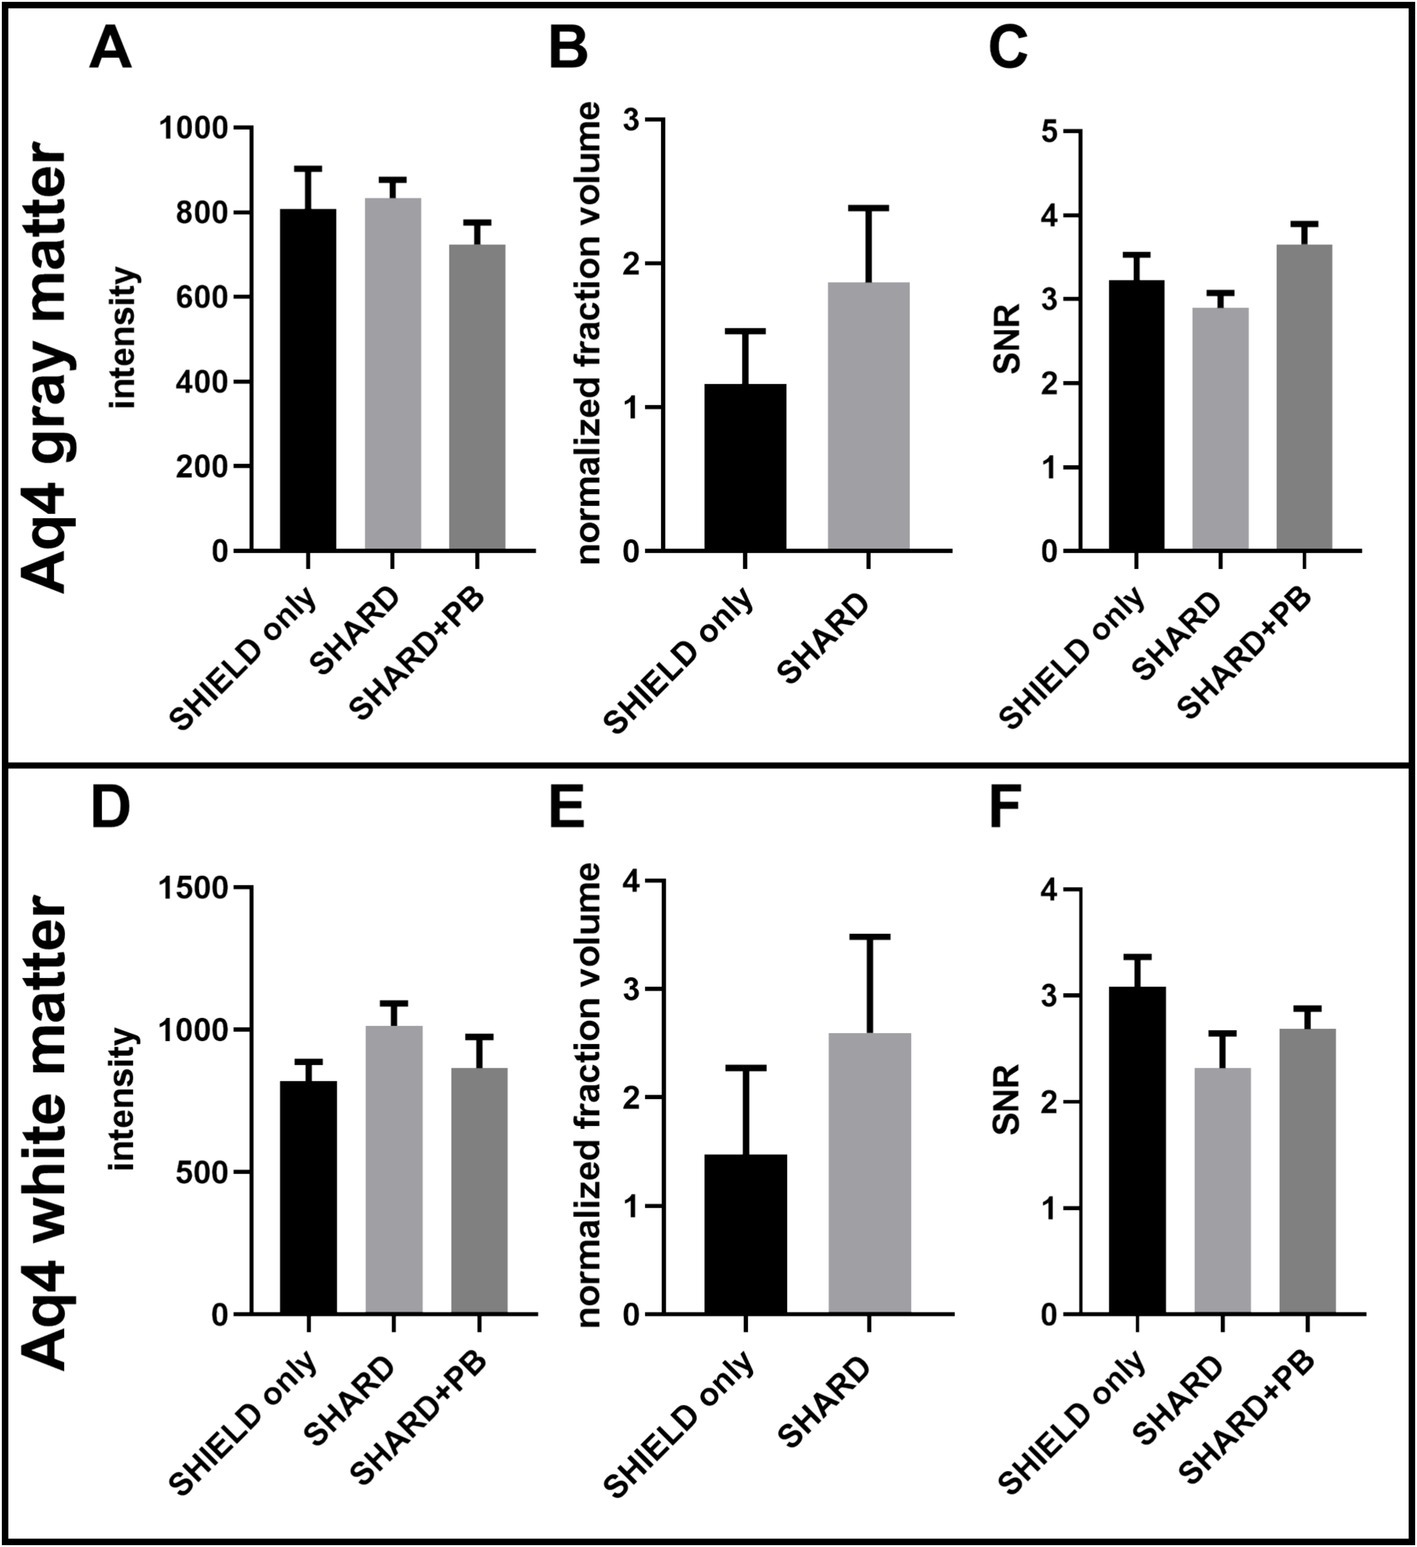
Figure 5. Quantification of Aq4Cy3 staining across the three experimental conditions in DLF tissue. (A) AQ4 Cy3 signal intensity in the gray matter, (B) AQ4 Cy3 normalized detected fraction volume in the gray matter, (C) AQ4 Cy3 signal to noise ratio in the gray matter, (D) AQ4 Cy3 signal intensity in the white matter, (E) AQ4 Cy3 normalized detected fraction volume in the white matter, and (F) AQ4Cy3 signal to noise ratio in the white matter. For each condition, n = 11 cases.
3.6 Alkaline decolorization treatmentA side-by-side comparison was completed on case u11 DLF tissue using the SHARD+PB condition and a previously published alkaline decolorization treatment (Scardigli et al., 2021). Briefly, before SHIELD processing, the section was treated with 30% (vol/vol) H2O2 diluted in deionized (DI) water for 1 h at RT and then washed three times in PBS for 10 min each. The sample was incubated in an alkaline antigen retrieval solution for 10 min at 95°C. The specimen was then cooled at RT for 30 min and washed in DI water for 5 min before incubating for 1 h in PBS. The section was immediately stained. This comparison is shown in Figure 6.
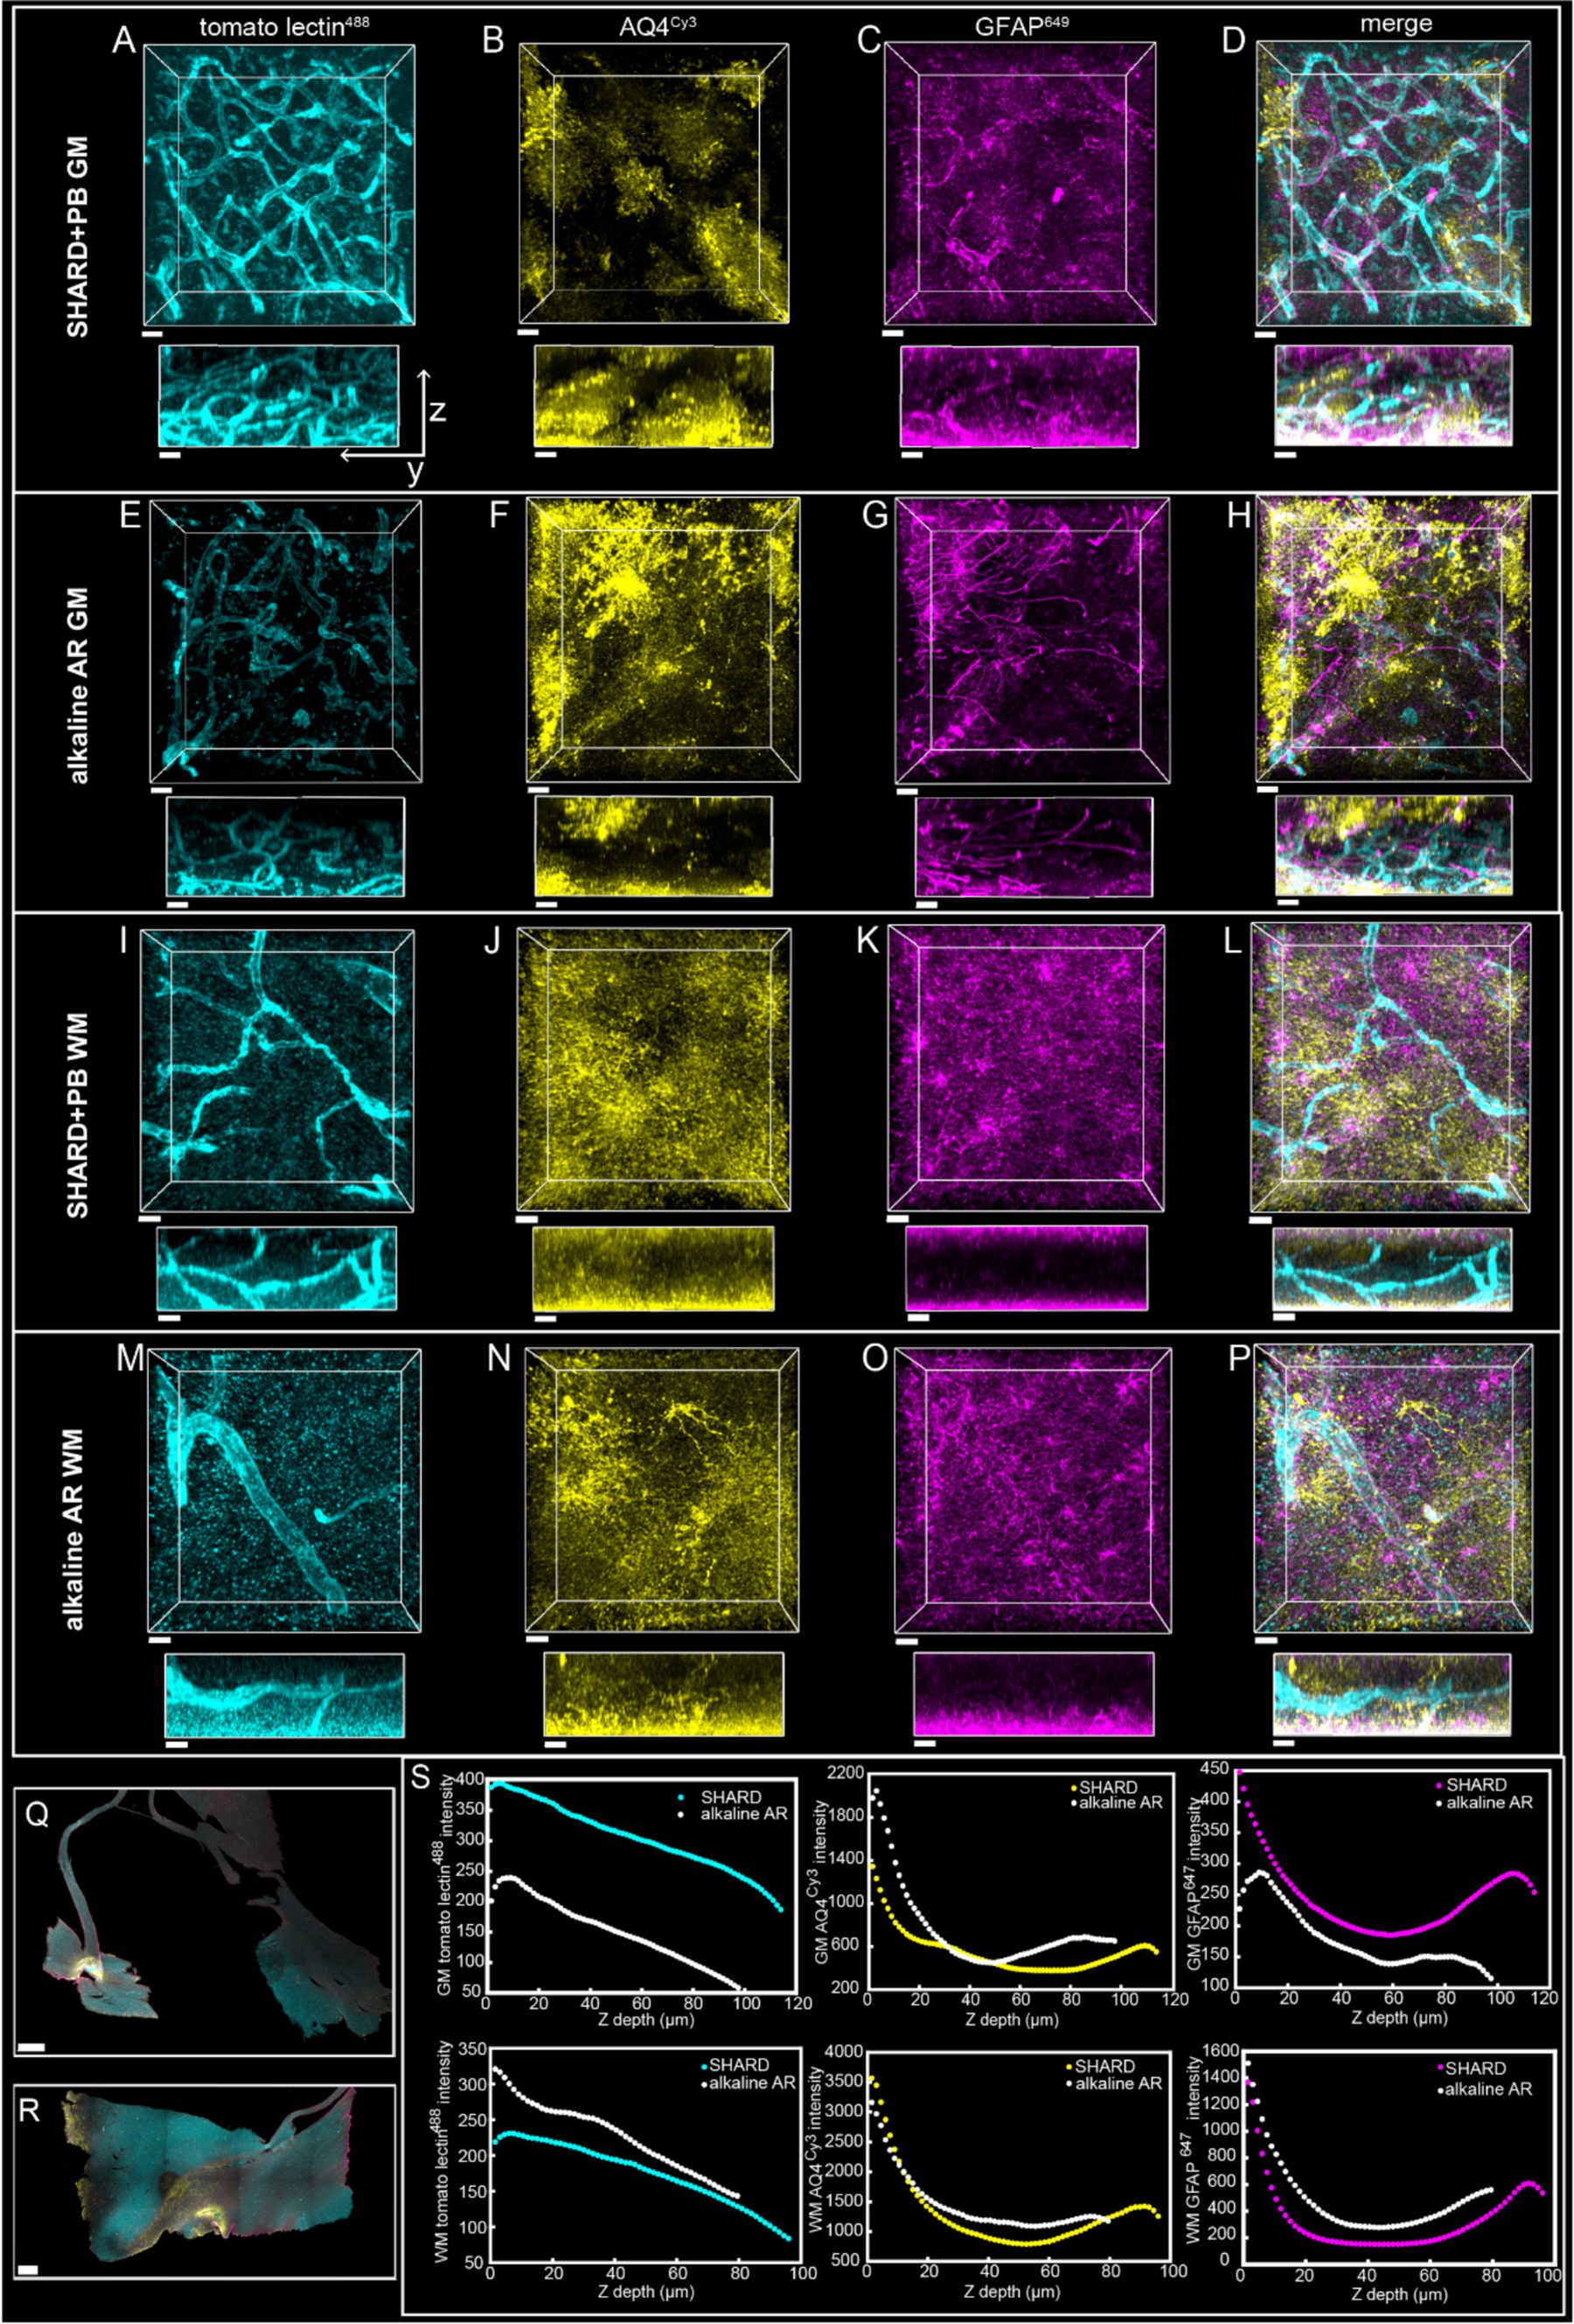
Figure 6. Qualitative Comparison of SHARD+PB vs. an alkaline antigen retrieval treatment. 3D renderings of immunofluorescent stains in the DLF of case u11 following treatment with the SHARD+PB condition (A–D,I–L) and the alkaline AR protocol (E–H,M–P) in the gray matter (A–H, 97.5 μm Z-stacks) and the white matter (I–P, 79.5 μm Z-stacks). The three stains shown are tomato lectin488(A,E,I,M), anti-AQ4Cy3(B,F,J,N), and anti-GFAP647(C,G,K,O). The overlay of all three is shown in (D,H,L, P). All stains are shown as xy views (top) and yz views (bottom), both of which are raw data. Scale bar = 20 μm. (Q) Whole sample scans at 4x of u11 treated with the alkaline AR protocol (Q) and the SHARD+PB condition (R), with a scale bar of 1 mm for both. (S) Plots of stain intensity vs. tissue Z depth in the gray matter (top row) and white matter (bottom row). Stain intensities in the tissue treated with alkaline antigen retrieval are plotted in white, and intensities in tissue treated with SHARD are plotted in the same colors in which they are displayed (A–P).
3.7 StainingSections were incubated for 2 h in a blocking solution of PBST with 5% normal donkey serum immediately before staining. Staining was conducted over two 24-h RT incubations with gentle shaking. For the sections used to compare different experimental conditions, each slice was incubated with a 10 μg anti-GFAP antibody cocktail (BioLegend, cat# 837602, San Diego, CA) and 12 μg anti-Aquaporin-4 (Abcam Ab 3,594, Boston, MA) in 1% normal donkey serum in PBST for a total volume of 1 mL. On the 2nd day, each slice was incubated with 40 μg tomato lectin488 (Vector Laboratories, Newark, CA), as previously described (Rosen et al., 2023), 6.7 μg Cy3-conjugated donkey anti-Rabbit secondary antibody, and 10 μg Alexa Fluor®488 (AF488)-conjugated donkey anti-mouse secondary (Jackson ImmunoResearch, 711–165-152 and 715–605-150, respectively, West Grove, PA) in PBST for a total volume of 1 mL. These immunofluorescence stains will be abbreviated as AQ4Cy3 and GFAP647.
Samples shown in Figure 7 were prepared with SHARD and stained with primary antibodies listed in Table 1. After 24 h of incubation with the primary antibody, sections were washed three times in PBST. Unless the stain was a small-molecule dye or conjugated primary, sections were incubated in the appropriate secondary antibody from Jackson ImmunoResearch such that the ratio of secondary to primary antibody was 2:1.
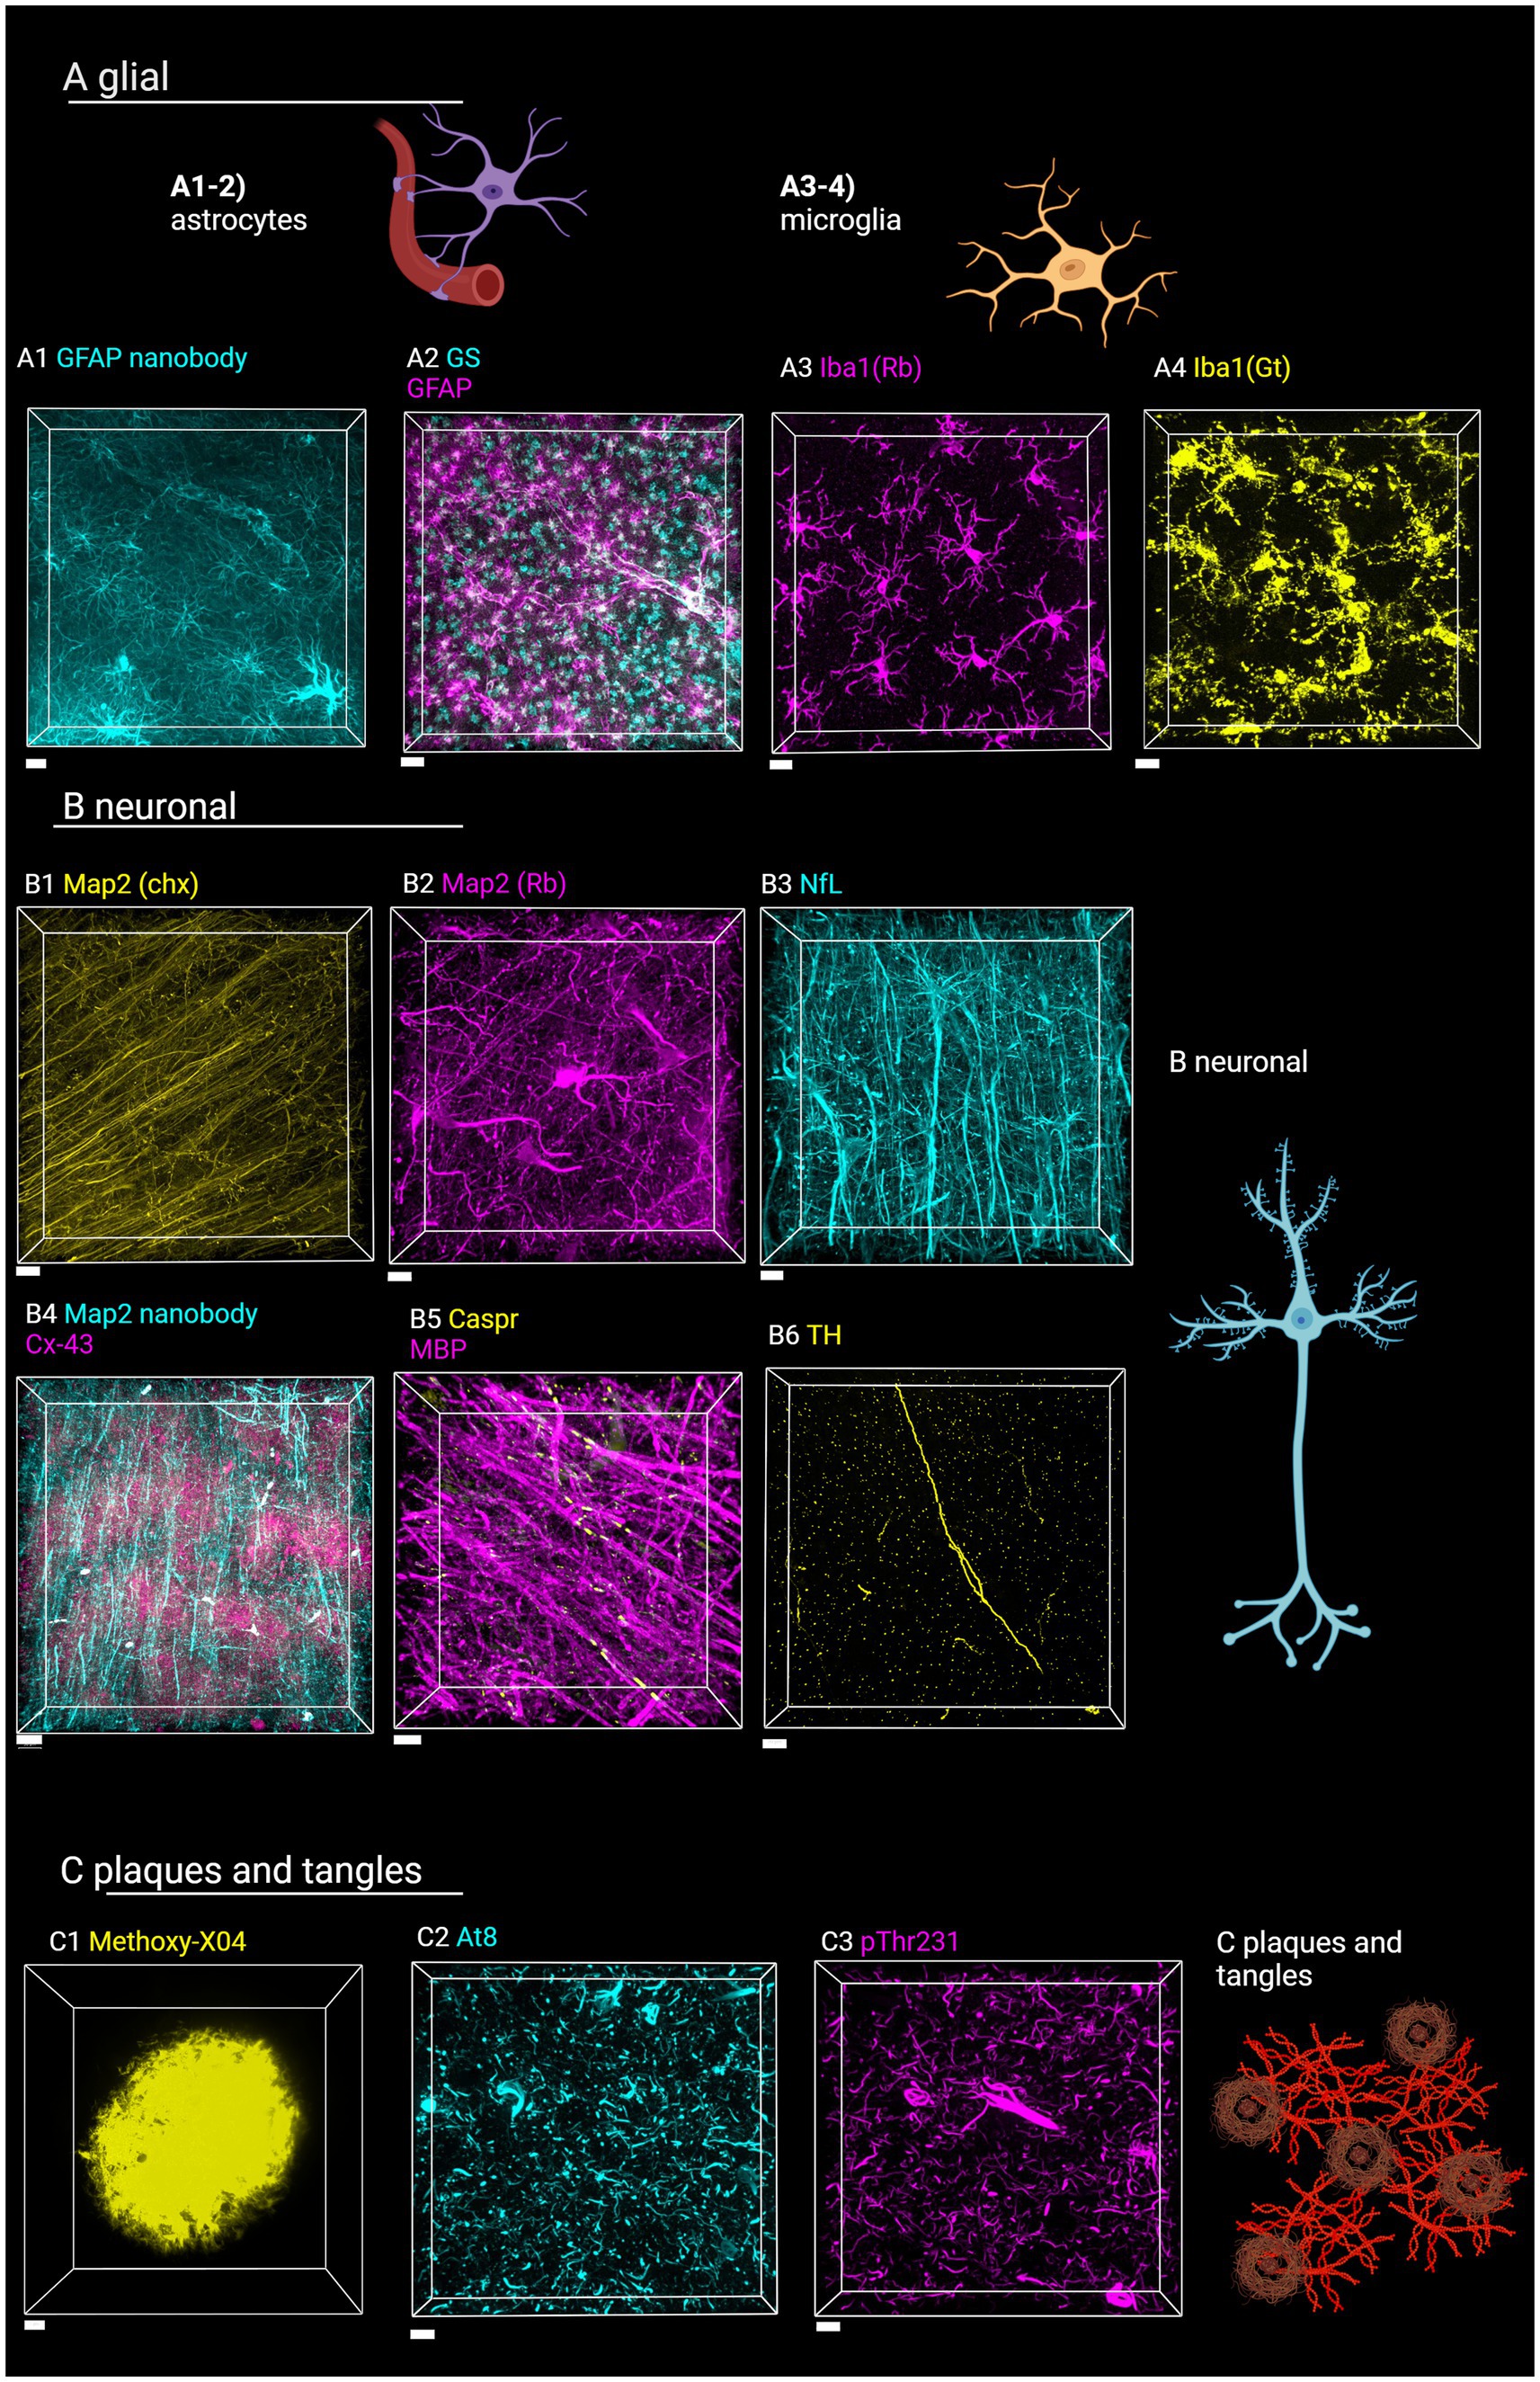
Figure 7. Staining of various targets of interest in the human brain with SHARD. Antibodies and stains are defined in Table 1. Images are taken in the DLF unless otherwise indicated. (A) Astrocytes and microglia. (A1) AF647-conjugated camelid anti-GFAP fluorescence in case u8, taken at 60x, 31.5 μm Z-stack, scale bar 10 μm. (A2) anti-GSCy3 and anti-GFAP647 fluorescence in case u9 taken at 20x, 90 μm Z-stack, scale bar 30 μm. (A3) anti-Iba1647 (rabbit host species) fluorescence in case u10 taken at 60x, 45 μm Z-stack, scale bar 15 μm. (A4) Anti-Iba1Cy3 (goat host species) fluorescence in case u11 taken at 40x, 45 μm Z-stack, scale bar 15 μm. (B) Neuronal stains (B1) Anti-Map2Cy3 (chicken host species) fluorescence in case a3 parietal lobe taken at 40x, 10 μm scale bar, 94 μm Z-stack. (B2) Anti-Map2 (rabbit host species) fluorescence in case u13 taken at 60x, 68 μm Z-stack, 15 μm scale bar. (B3) Anti-neurofilament647 fluorescence in case u12 taken at 40x, 103 μm Z-stack, 20 μm scale bar (B4) anti-Map2555 nanobody and anti-Cx43647 fluorescence in case p4 taken at 40x, 103 μm Z-stack, 30 μm scale bar. (B5) Anti-MBP647 and anti-caspr488 fluorescence in case p5 entorhinal cortex taken at 60x, 48 μm Z-stack, 10 μm scale bar. (B6) Anti-TH647 fluorescence in case a1 taken at 40x, 53 μm Z-stack, 20 μm scale bar. (C1) Methoxy-X04 fluorescence in case u3, taken at 100x, 36 μm Z-stack, 5 μm scale bar. (C2) Anti-AT8647 fluorescence in case u9 taken at 20x, 34 μm Z-stack, 15 μm sale bar. (C3) Anti-pThr231488 fluorescence in case u9 taken at 20x, 46 μm Z-stack, 15 μm scale bar. Created in BioRender (Rosen, 2024), BioRender.com/f02b703.
After the staining procedure, the samples were washed three times with PBST for 30 min each wash and incubated overnight in 4% PFA to post-fix the dye and antibodies to the tissue. The next day, the samples were washed three times, 2 h per wash, in PBS. Samples were incubated overnight in EasyIndex (LifeCanvas) before mounting onto a 25 × 75 × 1.0 mm glass slide (Fisher, Pittsburgh, PA) and covered with a No. 1.5, 22 × 30 mm glass coverslip (Corning GlassWorks, Corning, NY). EasyIndex (LifeCanvas, Cambridge, MA) was used for mounting media.
3.8 Imaging of cleared tissueTo quantify the three conditions, tissue slides were imaged on a Zeiss 880 confocal using a PLAN APO 20x/0.8 NA objective with Zen Black software (Zeiss, White Plains, NY). DyLight488, Cy3, and Alexa 647 were excited with 488 nm, 561 nm, and 633 nm wavelengths, respectively. Z-stacks of the available working distance were taken with optical sections spaced 1.5 μm apart, with a zoom of 1.8 and 4 line averaging. Pixel size was 0.115 × 0.115 × 1.5 μm and 16-bit. Pixel dwell was 2.05 μs. Emitted light was sent to the Airyscan detector, and 3D Airyscan processing was completed in Zen Black prior to image analysis. The pinhole radius was 266 μm for the tomato lectin488 channel, 449 μm for the Aq4Cy3 channel, and 598 μm for the GFAP647 channel. All image stacks were taken in the cortical gyri of the DLF, defined as the top third of the distance between the gyral crest and sulcus.
Images in Figure 7 were taken using either a Nikon Ti2 Eclipse Crest V2 spinning disc microscope or a Nikon AX-R microscope (Nikon, Melville, NY). The pinhole was set to 1 AU with a zoom size of 1.0 and pixel dwell time of 0.24 μs for all images acquired with the AX-R. The spinning disc has 70 μm pinholes. Nikon AX-R images were all taken with unidirectional scanning. Figures 7A1,A3,B2,B5 were taken with a CFI PLAN APO λ 60x/1.42 NA oil immersion objective with the Nikon spinning disc microscope. Figures 7A2,C2,C3 were taken with a CFI PLAN APO λ 20x/0.8 NA air objective on the Nikon spinning disc microscope. Figure 7C1 was taken with a CFI PLAN APO λ 100X/1.45 NA oil immersion objective with the Nikon spinning disc microscope. Figures 7A4,B1,B3,B6 were taken with a CFI PLAN APO 40x/1.25 NA silicone oil lens on the Nikon AX-R microscope using unidirectional scanning. Figures 7B4–5 was taken with a CFI PLAN APO λ 60x/1.42 NA oil immersion objective with the Nikon AX-R microscope.
Images in Figures 8, 9 were acquired with a Nikon AX-R confocal microscope with two tunable gallium arsenide phosphide (GaAsP) detectors, a multi-alkaloid detector with emission filters, and a fixed GaAsP detector with emission filters. The pinhole was set to 1 AU for all channels with a zoom size of 1.0, unidirectional scanning, 4 line averaging, and pixel size of Parameters for the optical configurations used for the 7-color multiplex shown in Figures 8, 9 are displayed in Table 4. Imaging was done with a CFI PLAN APO 40x/1.25 NA silicone oil lens and unidirectional scanning. Data from the fluorophores was divided into two optical configurations: one with methoxy-X04, AlexaFluor488, autofluorescence, and AlexaFluor594, and the other with Cy3, AlexaFluor647, and AlexaFluor750. In this way, both optical configurations had two dyes that used both the tunable GaAsP detectors. Z-resolution was 0.4 μm. Images on a single plane were taken with both optical configurations before moving in Z onto the next plane.
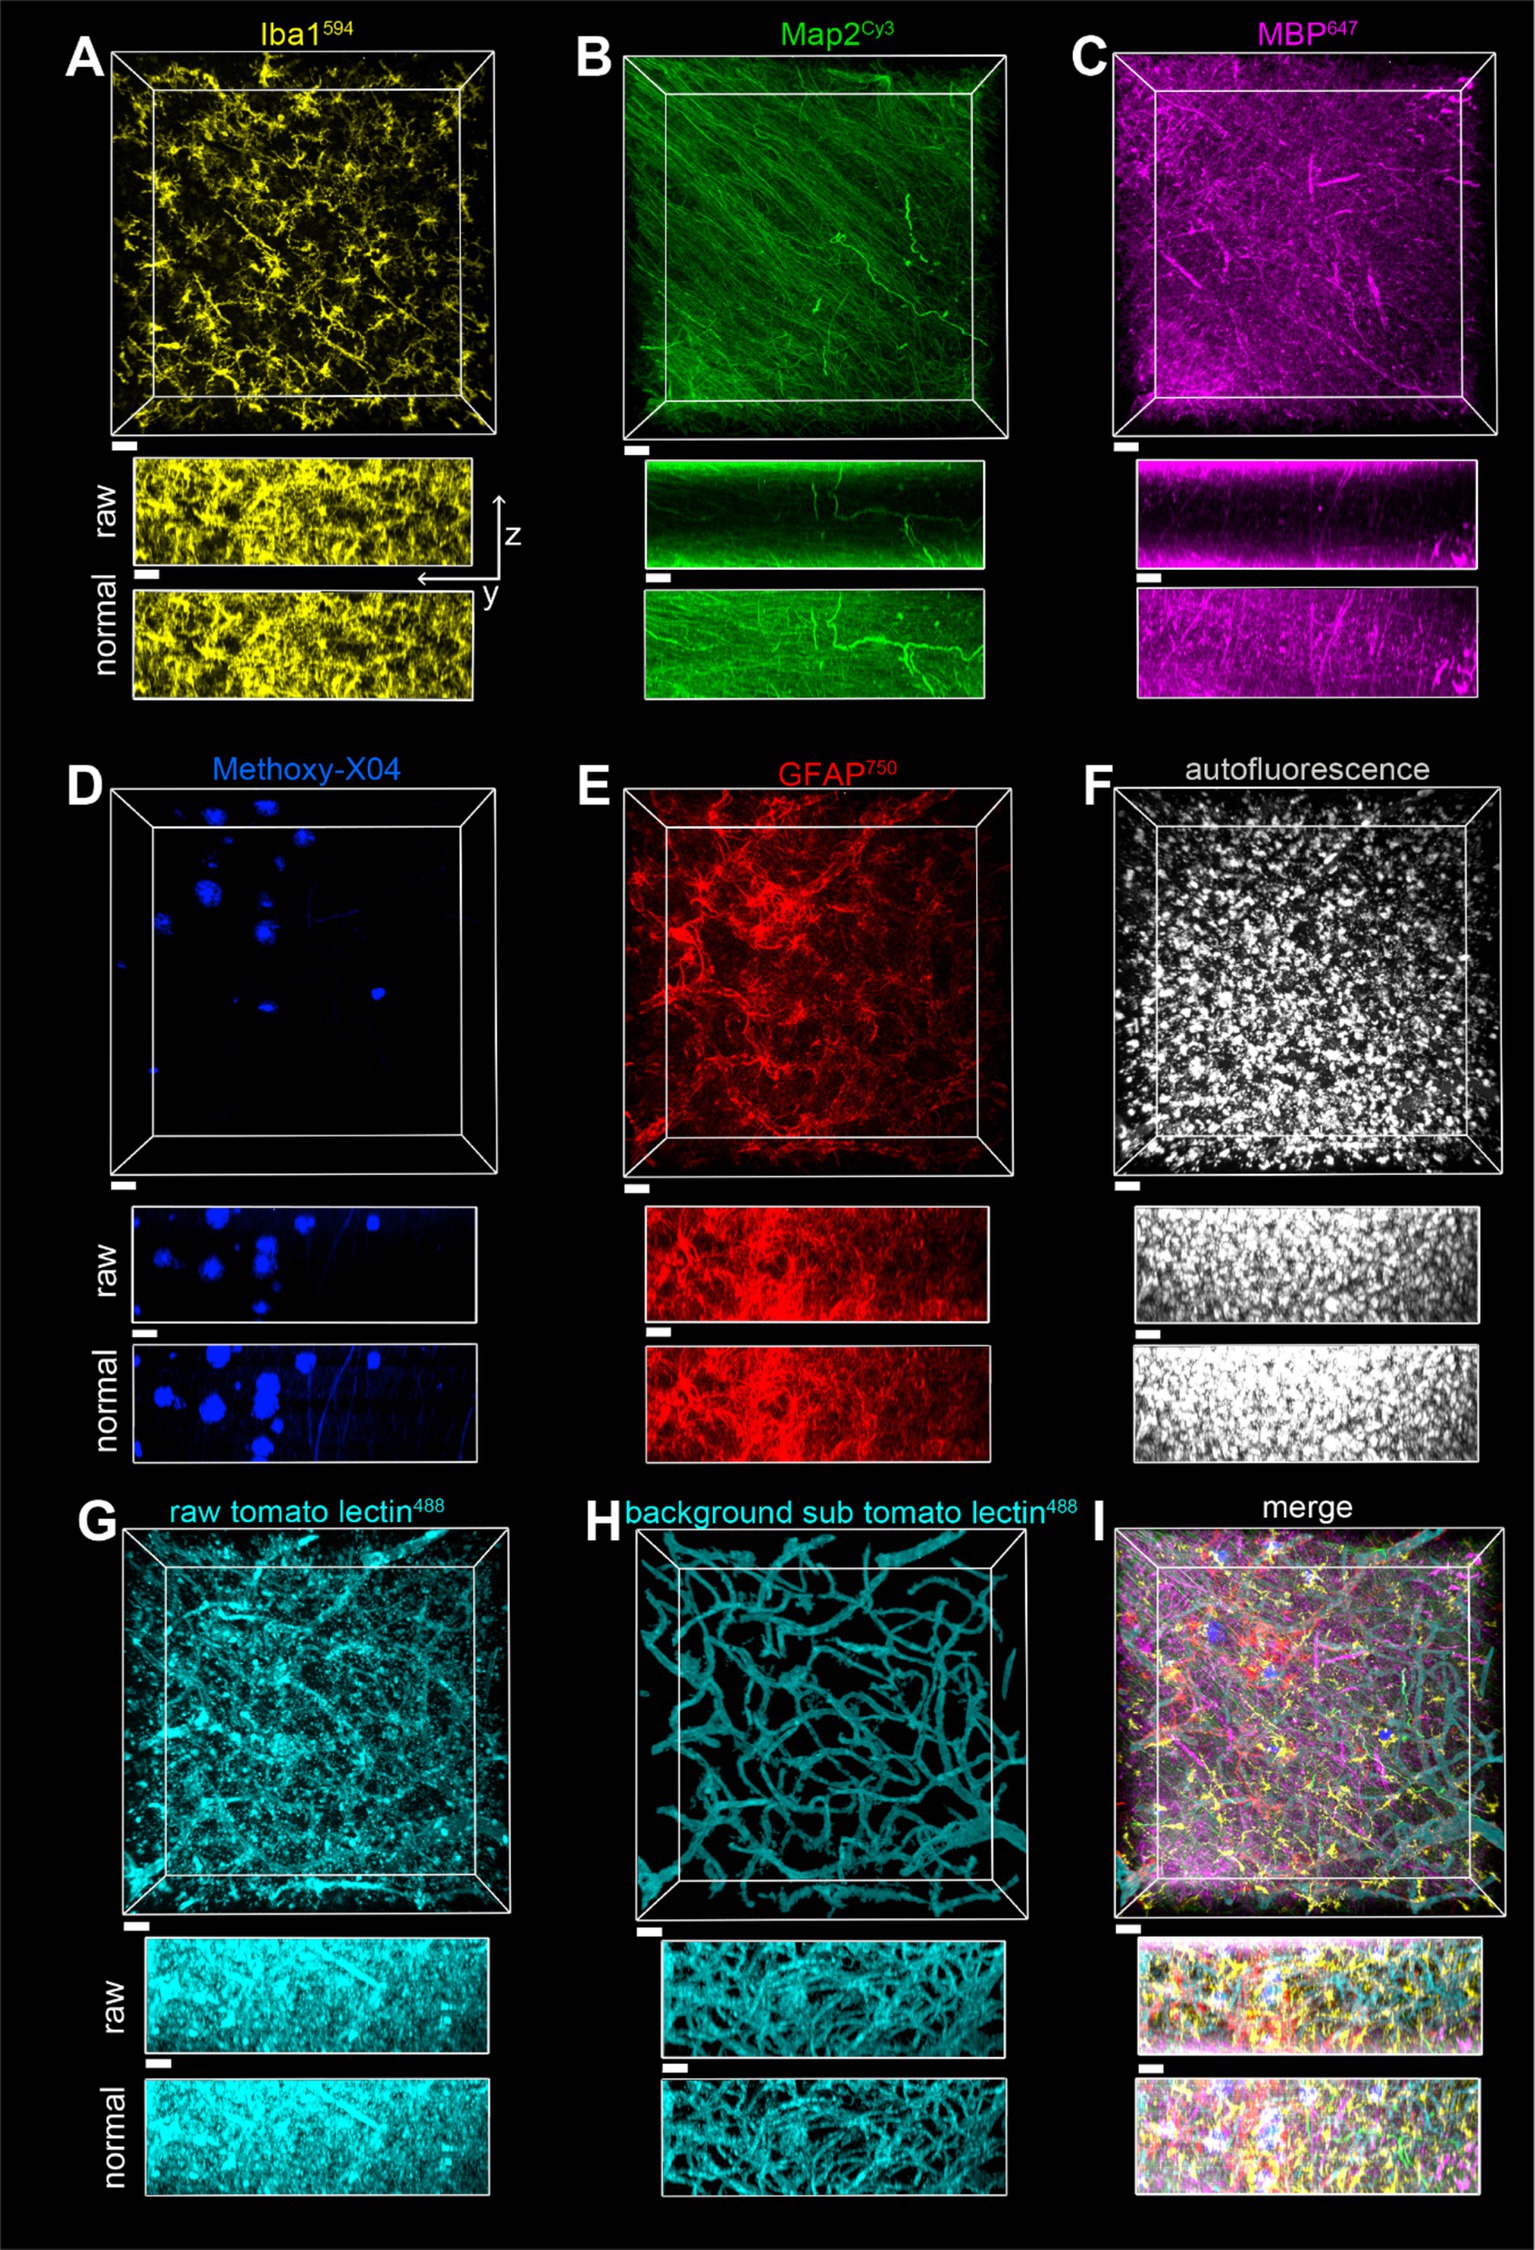
Figure 8. Imaging of a seven-color multiplex in the gray matter of the parietal lobe in case of a2, all in the same field of view. The scale bar is 30 μm for all. (A) Iba1594, (B) Map2Cy3, (C) MBP647, (D) Methoxy-X04, (E) GFAP750, (F) autofluorescence, (G) tomato lectin488, (H) tomato lectin488 after autofluorescence subtraction and image segmentation, (I) Overlay of stains shown in (A–E,H). The z-stack is 148 μm, with a Z-step of 0.5 μm. yz view of image stacks is shown with both raw pixel intensities and pixel intensities after layer normalization preprocessing.
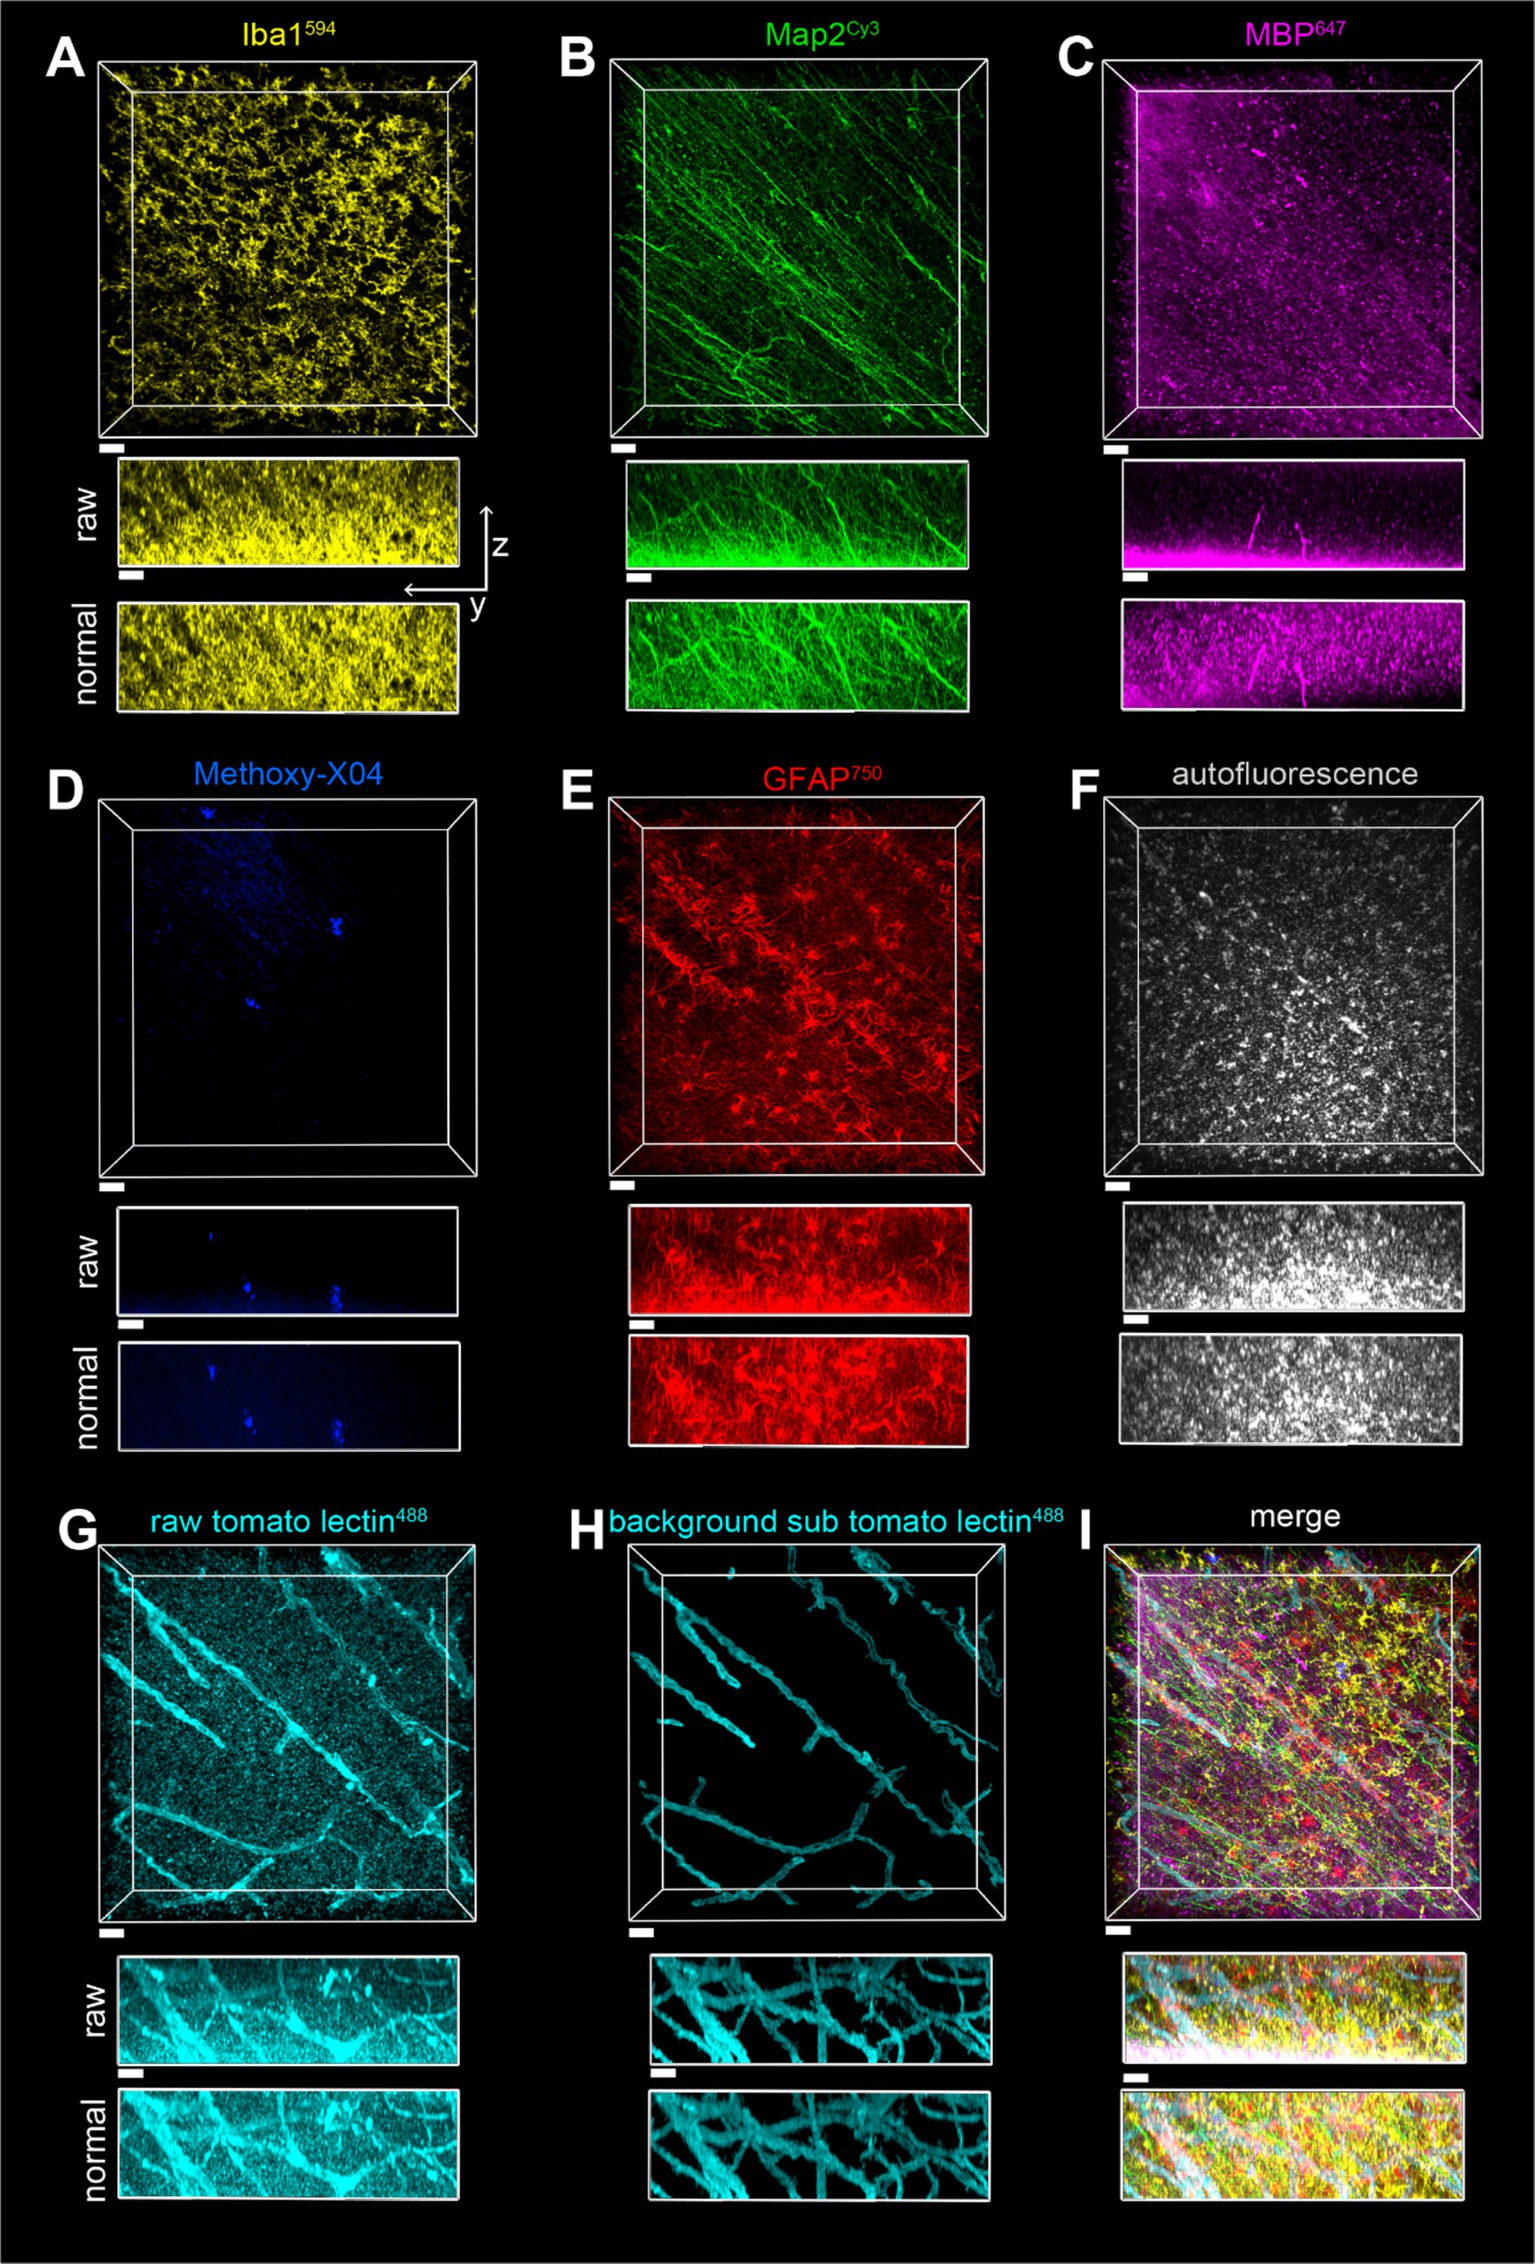
Figure 9. Imaging of a seven-color multiplex in the white matter of the parietal lobe in case of a2, all in the same field of view. The scale bar is 30 μm for all. (A) Iba1594, (B) Map2Cy3, (C) MBP647, (D) Methoxy-X04, (E) GFAP750, (F) autofluorescence, (G) tomato lectin488, (H) tomato lectin488 after autofluorescence subtraction and image segmentation, (I) Overlay of stains shown in (A–E,H). The z-stack is 116 μm with a Z-step of 0.5 μm. yz view of image stacks is shown with both raw pixel intensities and pixel intensities after layer normalization preprocessing.
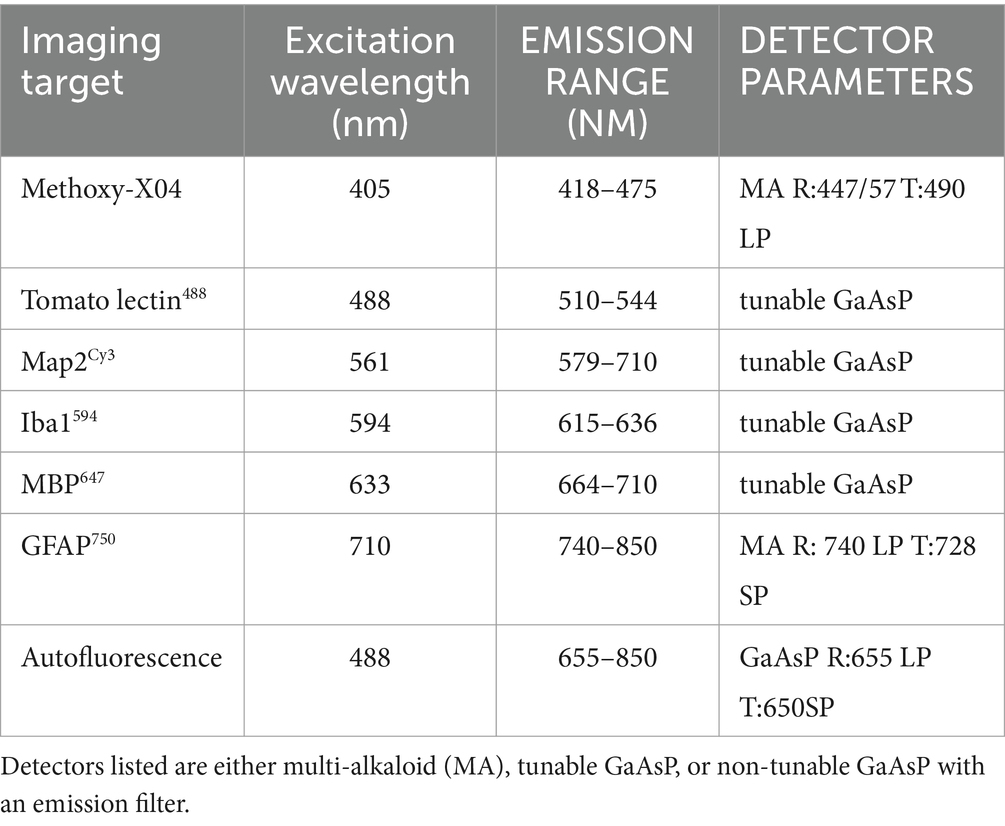
Table 4. Nikon AX-R optical configuration parameters for immunofluorescent 7-plex in cleared postmortem human brain tissue.
A surface for the autofluorescence was created in Imaris 10 with segmentation based on pixel intensity and then thresholded to a volume of segmentation greater than 100 pixels. The intensity threshold was manually set to encompass all of the signals, as the purpose of this channel was to capture the low-intensity signals that appear in all channels. To subtract autofluorescence from the tomato lectin488 channel, pixels inside of the autofluorescent surface in the tomato lectin488 channel were set to zero, and the tomato lectin488 staining was also segmented based on pixel intensity and volume. Pixels outside of the resulting segmentation were set to zero, resulting in the background-subtracted tomato lectin488 images. The rationale for removing autofluorescence before segmentation is that in the fluorophore channels, there is no way to distinguish between autofluorescent pixel intensity and pixel intensity coming from fluorophores. It is easier to create an additional background subtracted channel and segment than to manually edit segmented surfaces individually to remove autofluorescence, which is a time-consuming process in Imaris. All images displayed are after a layer-normalizing preprocessing step that accounts for the effects of photobleaching.
3.9 QuantificationSegmentation was completed using Imaris (v10.0, Bitplane, Belfast, United Kingdom). Surface creation for each channel (GFAP647, AQ4Cy3, and tomato lectin488) was based on background-subtracted pixel intensity and segment volume. Only these two parameters were used for the segmentation of GRAP647 and AQ4 Cy3. For the tomato lectin488 channel, an additional filter was used for sphericity, removing sphere-shaped objects as blood vessels have tubular morphology. For each case, parameters for segmentation were created based on the SHARD+PB condition white matter and gray matter images, giving a total of six parameter sets (one gray matter, one white matter, for each channel). These parameters were then applied to the image sets from conditions 1 and 2 for all six channels, gray matter and white matter. The average pixel intensity in the created surface was the “signal” measurement used in the signal-to-noise ratio calculation. The average intensity of pixels outside of the surface was the “noise” intensity measurement. The signal-to-noise ratio (SNR) was calculated as the mean signal intensity divided by the mean noise intensity.
The fraction volume for each stain in each image stack was calculated as the total volume of the segmented surface divided by the total volume of the image stack. To account for any biological difference in fraction volume on a case-by-case basis, we normalized the fraction volume of the SHIELD only and SHARD conditions to the fraction volume of the SHARD+PB condition. Therefore, the normalized fraction volume of the SHARD+PB condition was always 1.
To quantify stain penetration depth and assess the utility of the normalized layer function in Imaris, we imported raw and normalized data into Arivis Pro for quantification. The mean pixel intensity was calculated for each plane in each of the raw and normalized channels. This was done for each of the 22 Z-stacks of each tissue treatment condition from 11 cases, as each case had two Z-stacks per condition, one in the white matter and one in the gray matter. For each condition and stain, standard errors were calculated for each Z position using the number of cases that had corresponding images at each Z position.
3.10 Statistical analysesThe fluorescence microscopy data were analyzed using SPSS (v. 27, IBM, Inc., Armonk, NY) and GraphPad Prism (v. 9.0.0, GraphPad Software, La Jolla, CA). An analysis of variance (ANOVA) was used to obtain means of signal intensity and SNR for tomato lectin, aquaporin, and GFAP stains in each experimental group. Because fraction volume was normalized based on the SHARD+PB condition, normalized fraction volume in the SHARD+PB condition had a standard error of zero and was not included in statistical comparisons. An unpaired t-test was used to compare the normalized fraction volume of the SHIELD-only condition versus the SHARD condition. Associations among measured image quality quantifiers were measured with linear regression models with age of death or PMI as the independent variable and signal intensity, noise intensity, normalized fraction volume, and SNR as the dependent variables. The significance level was set a priori to 5%.
4 Results 4.1 Antigen retrieval results in robust fluorescent microscopy images on cleared postmortem human brain tissueSHIELD tissue treatment, passive delipidation, and staining were successful in visualizing blood vessels and astrocytes in three dimensions. Cases u1-7 and p1-4 were each subjected to SHIELD only, SHARD, and SHARD+PB conditions. Figure 1 shows tomato lectin488, AQ4Cy3, and GFAP647 fluorescence in the gray matter, and Figure 2 shows tomato lectin488, AQ4Cy3, and GFAP647 fluorescence in the white matter. Fluorescence was distinctive in the gray and white matter for all three stains. Tomato lectin488 fluorescence shows many branching curving vessels in the gray matter and more linear vessels in the white matter with fewer branches (Figures 1A,E,I compared to Figures 2A,E,I). Astrocyte density was generally greater in the white matter compared to the gray matter, as white matter showed more AQ4Cy3 and GFAP647 fluorescence density (Figures 2B,C,F,G,J,K) than the gray matter (Figures 2B,C,F,G,J,K). Staining quality appeared comparable among the three experimental conditions for tomato lectin488 (Figures 1, 2A vs. Figure 2E vs. Figure 2I) and AQ4Cy3 (Figures 1, 2B vs. Figure 2F vs. Figure 2J). However, the SHIELD-only condition produced minimal, if any, staining for GFAP647 (Figures 1, 2C) compared to the SHARD or SHARD+PB conditions (Figures 1, 2G,K).
Both photobleaching during confocal imaging and stain penetration into the tissue can be quantified by stain intensity vs. depth plots. Plots of raw data intensity vs. depth showed an initial decrease in staining intensity with increasing depth for all three stains (Figures 1, 2M,N, colored plots). The normalized layer function in Arivis, which standardizes the mean intensity of each channel it is applied to in each Z-slice, can be used to effectively eliminate the decrease of intensity through Z (Figures 1, 2M,N, white plots). Qualitatively, the normalized layer function creates uniformity of intensity in each Z slice, as seen in the yz views in Figures 1, 2A–L. Intensity vs. depth curves were U-shape
留言 (0)