Participants
The present study employed a nationwide online survey conducted in South Korea to gather data. Participants were selected from six stratified districts in South Korea, including Seoul, Kyeonggi, Kangwon, Gyeongsang, among others, based on their estimated proportions in the national population. A total of 881 adolescents and their parents voluntarily provided online consent to participate in the study. Inclusion criteria required participants to have reported non-suicidal self-injury (NSSI) at least once in the past 12 months and be in grades six to nine. Once the inclusion criteria were met, the adolescents were invited to complete a series of self-reported questionnaires via a survey webpage accessed through a provided URL. The sample comprised 227 (25.8%) 6th-grade students, 221 (25.85%) 7th-grade, 226 (25.7%) 8th-grade, and 207 (23.5%) 9th-grade students. Among the participants, 487 (55.3%) identified as male, while 394 (44.7%) identified as female. The overall mean age of the participants was 13.91 years (SD = 0.81), with ages ranging from 11 to 16 years. The study received approval from the Institutional Review Board (IRB) of Seoul National University Hospital (IRB Number H- 1904–093-1027) and Kangwon National University (IRB Number KWNUIRB-2020–01-012) to ensure ethical compliance and participant protection. Demographics information is described in Appendix A.
MeasuresCenter for Epidemiological Studies Depression Scale for Children (CES-DC)
The Center for Epidemiological Studies Depression Scale for Children (CES-DC) was developed by Weissman to assess levels of depression among children and adolescents [50]. CES-DC consists of 20 items with possible scores ranging from 0 to 60. Each item uses a 4-point Likert scale (0–3). Higher CES-DC scores indicate increasing levels of depression. The internal consistency of the scale was 0.936 in this study. Of the 20 items, ten (2, 5, 6, 10, 11, 15, 17, 18, 19, & 20) with high factor loadings were selected and adapted for the depression concept.
Automatic Thoughts Questionnaire (ATQ-N)
Automatic Thoughts Questionnaire (ATQ-N) was developed by Hollon and Kendall [25] to measure automatic negative thoughts. ATQ-N consists of 30 items with possible scores ranging from 30 to 150. Each item uses a 5-point Likert scale (1–5). High ATQ-N scores indicate a high tendency to think negatively. In this study, we used the Korean version of the ATQ-N translated and validated by [53]. The internal consistency of the scale was 0.981 in this study. Among the 30 items, 14 items with the low item-total correlation and low factor loading below 0.3, as well as high cross-loading between factors, were removed from the scale [20]. Finally, 16 items (1, 2, 4, 10, 11, 17, 18, 19, 20, 21, 22, 25, 27, 28, 29, and 30) were selected and utilized to measure the concept of negative thinking.
Ruminative Response Scale (RRS)
The ruminative Response Scale (RRS) was developed to evaluate ruminative response by Nolen-Hoeksema and Morrow [38]. The Korean version of the Ruminative Response Scale (K-RRS) was validated by Kim et al. [28]. It consists of three subscales (reflection, brooding and depressive rumination) and 22 items with possible scores ranging from 22 to 88. Each item describes the level of thoughts or actions using a 4-point Likert scale (1–4). A higher K-RRS score indicates a higher tendency for ruminative response. The internal consistency of the scale was 0.966 in this study. We used ten items (1, 2, 3, 5, 8, 9, 10, 15, 19, and 22) out of the 22 items. Four items (5, 9, 10, 15) were used for brooding factor, while the other 6 (1, 2, 3, 8, 19, and 22) were used for depressive rumination concept.
Difficulties in Emotion Regulation Scale– 16 item version (DERS-16)
DERS-16 is developed by Bjureberg et al. [3] as a brief version of DERS [19]. This brief scale consists of five subscales (lack of emotional clarity, difficulties engaging in goal-directed behavior, impulse control difficulties, limited access to effective emotion regulation strategies, and nonacceptance of emotional response) and a total of 16 items with possible ranging from 16–80. Each item describes difficulties in emotion regulation using a 5-point Likert scale (1–5). A higher DERS-16 score indicates greater difficulties in emotion regulation [3]. The internal consistency of the scale was 0.973 in this study. Thirteen items (1, 2, 3, 4, 5, 8, 9, 11, 12, 13, 14, 15, and 16) were selected and adapted for the difficulties in emotion regulation concept.
Toronto Alexithymia Scale (TAS-20)
TAS-20 was developed by Bagby to measure a participant’s inability to identify and describe their own emotions. TAS-20 includes three subscales (difficulty identifying feelings, difficulty describing feelings, and externally oriented thinking). Each item is scored on a 5-point (1–5), Likert-type scale and five reverse-scored items. Total scores ranged from 20 to 100, with higher scores indicating greater impairment [2]. We used TAS-20 K, a Korean version of the TAS-20 developed by Chung et al. [8]. The internal consistency of the scale was 0.900 in this study. Four items (1, 2, 6, and 8) were selected and used for the alexithymia concept.
The short form of the Buss-Perry Aggression Questionnaire (BPAQ-SF)
BPAQ-SF was a short form of Buss and Perry’s aggression questionnaire (BPAQ). This short-form scale was developed by Bryant and Smith [6] to measure aggression. BPAQ-SF includes four subscales (physical aggression, verbal aggression, anger, and hostility). A total of 12 items with possible ranging from 12 to 60. Each item uses a 5-point Likert scale (1–5). Higher BPAQ-SF scores indicate higher aggression. The internal consistency of the scale was 0.922 in this study. We used 7 items (2, 3, 6, 14, 17, 18, and 26) for the aggression concept.
The Body Investment Scale (BIS)
The body investment scale (BIS) was developed by Orbach and Mikulincer [41] to measure suicidal tendencies and body investment. BIS consists of four subscales (body image feelings & attitudes, comfort in touch, body care, and body protection). A total of 24 items with possible ranging from 24 to 120. Each item uses a 5-point Likert scale (1–5), and seven are reverse-scored. A higher BIS score indicates a higher body investment tendency. The internal consistency of the scale was 0.836 in this study. Five items (3, 5, 13, 17, and 21) were used for the body attitude concept.
The Perceived Stress Scale (PSS-10)
The perceived stress scale (PSS-10) was developed by Cohen and Williamson [11]. This scale measures the stress which is perceived as a situation in life. PSS-10 ask about how unpredictable, uncontrollable, and excessive burden is felt in everyday life. A total of 10 items with possible ranging from 0 to 40. Each item uses a 5-point Likert scale (0–4), and four items are reverse-scored. A higher PSS-10 score indicates a higher level of perceived stress. The internal consistency of the scale was 0.762 in this study. Among the ten items, six items (1, 2, 3, 6, 9, and 10) were used for the perceived stress concept.
Peer-Victimization Scale & Bullying Behavior Scale (PVS & BBS)
Peer-Victimization Scale & Bullying Behavior Scale (PVS & BBS) was developed by Austin and Joseph [1]. It consists of two subscales (peer-victimization and bullying behavior). Each subscale is consisted of six items and is used by the total score. Each item uses a 4-point Likert scale (1–4), and eight items are reverse-scored. Higher PVS; BBS score indicates having a greater extent and frequency of bully/victim problems. The internal consistency of the scale was 0.924 in this study. We selected five items (1, 3, 4, 5, 6) from the peer-victimization subscale to use for the peer-victimization concept in this study.
Family Adaptability and Cohesion Evaluation Scales-IV (FACES-IV)
Family adaptability and cohesion evaluation scale-IV (FACES-IV) was developed by Olson and Gorall [40] and consist of two subscales (adaptability and cohesion). Each subscale is consisted of 10 items and is used by the total score. Each item uses a 5-point Likert scale (0–4). A higher FACES-IV score indicates a good balance between family adaptability and cohesion. The internal consistency of the scale was 0.928 in this study. We used ten items (1, 2, 3, 4, 7, 9, 11, 12, 17, 19) for the family adaptability concept.
Table 1 The set of items for conducting LPA (Total number of items = 86)The Self-Harm Screening Inventory (SHSI)
The Self-Harm Screening Inventory (SHSI) is a concise and self-administered tool designed to assess self-harm behaviors among adolescents. The SHSI was developed and used in the previous studies [29, 45]. This inventory consists of twenty binary items, where respondents answer with a straightforward "yes" or "no." These items aim to inquire about an individual's involvement in self-harming behaviors within the past year. To ensure clarity regarding the assessment of non-suicidal self-injury (NSSI) among adolescents, the SHSI includes a definition of NSSI within the instructions. NSSI is explicitly defined as deliberate self-harming actions carried out without any intent to cause one's own death. Respondents are instructed to select "yes" if they have engaged in self-harm at least once during their lifetime, and "no" if they have not.
Procedures
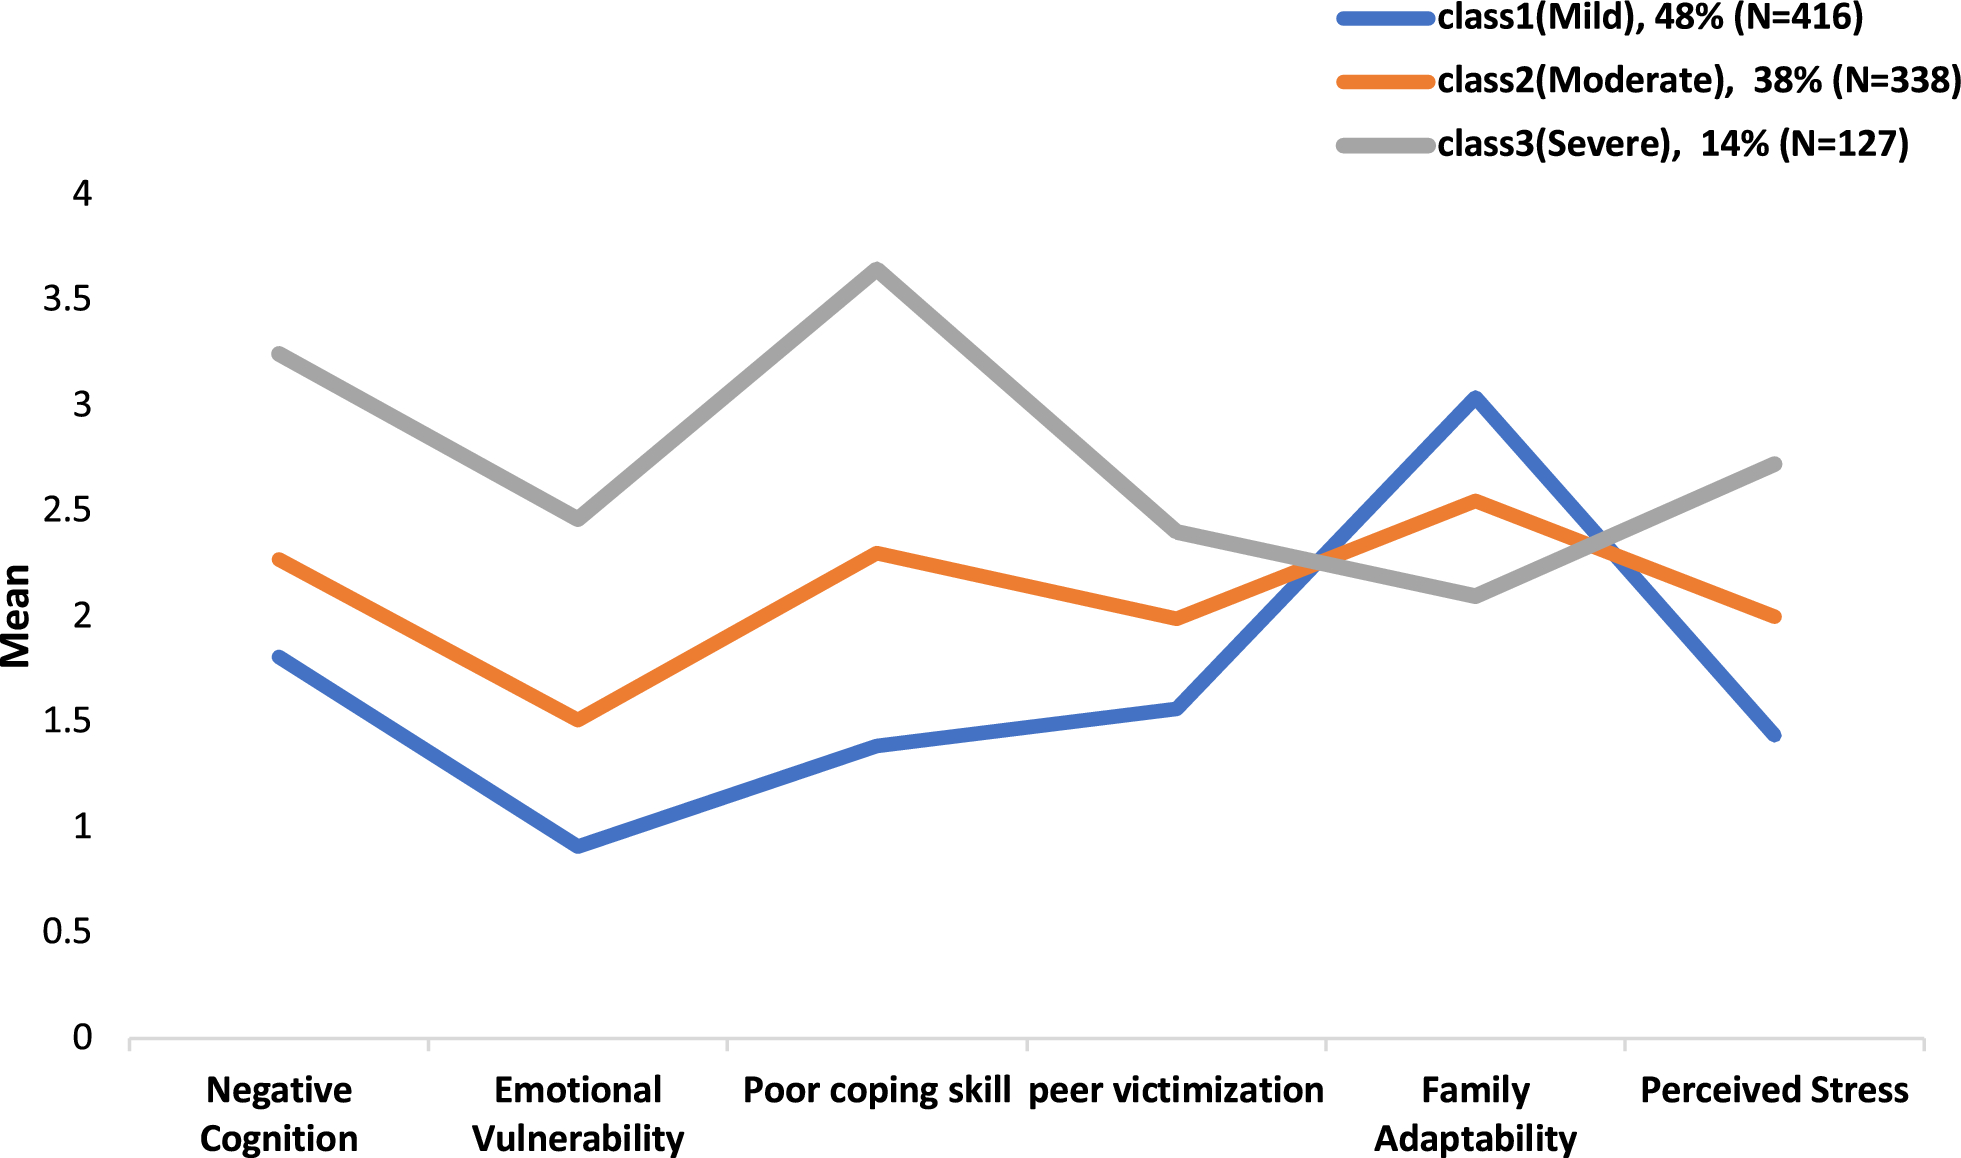
The selection of measurements for this study was guided by their strong psychometric properties, ensuring reliable and valid assessment (see Measures for detailed information). These measures were carefully chosen to capture both intrapersonal and interpersonal risk factors associated with self-harm among adolescents. The decision-making procedure regarding the scale items was informed by a thorough review of existing literature and consultation with psychiatrists and clinical psychologists within the research team. In consultation with these expert, scales that were not statistically and content-wise appropriate were revised or deleted to take account Korean culture. The intrapersonal factor was further divided into three sub-factors: negative cognition, emotional vulnerability, and coping skills. These sub-factors were considered essential in understanding the intrapersonal aspects relevant to self-harm behaviors. Likewise, the interpersonal factor comprised three sub-factors: peer victimization, family adaptability, and perceived stress. These sub-factors aimed to encompass significant elements of interpersonal relationships and external stressors contributing to self-harm behaviors in adolescents. At this stage, the items were initially selected based on the intercorrelations of total scores for each of the 11 psychological scales. Subsequently, any items that did not have respondents who rated them as "Strongly Disagree" (= 1) or "Strongly Agree" (= 5) were further eliminated after examining the response distributions for each item [39]. To finalize the selection of the items, we assessed whether any items exhibited factor loadings below 0.30 or demonstrated high factor loadings across multiple factors, suggesting potential variable complexity (Guadagnoli and Velicer, 1988). To comprehensively assess these factors, a total of 87 items were selected for inclusion in the measures, allowing for the conduct of latent profile analysis (LPA). The final set of items for each sub-factor can be found in Table 1.
Statistical analysis
The mean score of each factor was considered as continuous indicator variables. Table 2 presents descriptive statistics of each indicator variable. Based on six factors, LPA was conducted to identify latent classes that shows similarity among self-harming behavior factor patterns. All statistical analyses were conducted using Mplus Version 8.4 [33], and the analyses used maximum likelihood parameter estimates with standard errors (MLR). This process used 1,000 random starting values to ensure the validity of each class solution. The number of latent classes was established with a single latent class, and then additional classes were added in sequence, until satisfying an optimal selection criterian. In this study, the optimal number of classes was determined by using Akaike Information Criterion (AIC), Bayesian Information Criterion (BIC), Adjusted BIC (ABIC), the Lo-Mendell-Rubin adjusted Likelihood Ratio Test (LMR-LRT), Bootstrapped Likelihood Ratio Test (BLRT). Lower AIC, BIC and ABIC values indicate a better model fit. The LMR-LRT and BLRT compared a model with k classes with a model with k—1 classes. If model comparison is statistically significant, it means that a model with k classes is better than a model with k—1 classes. Whereas a non-significance indicates that a model with k classes is not improvement over a model with k—1 model. Entropy index is generally useful for providing a summary of classification accuracy. Entropy index varies from 0 to 1, with values closer to 1 indicating less classification errors.
Table 2 Descriptive statistics of each indicator variable (sample = 881) 


留言 (0)