
記住我


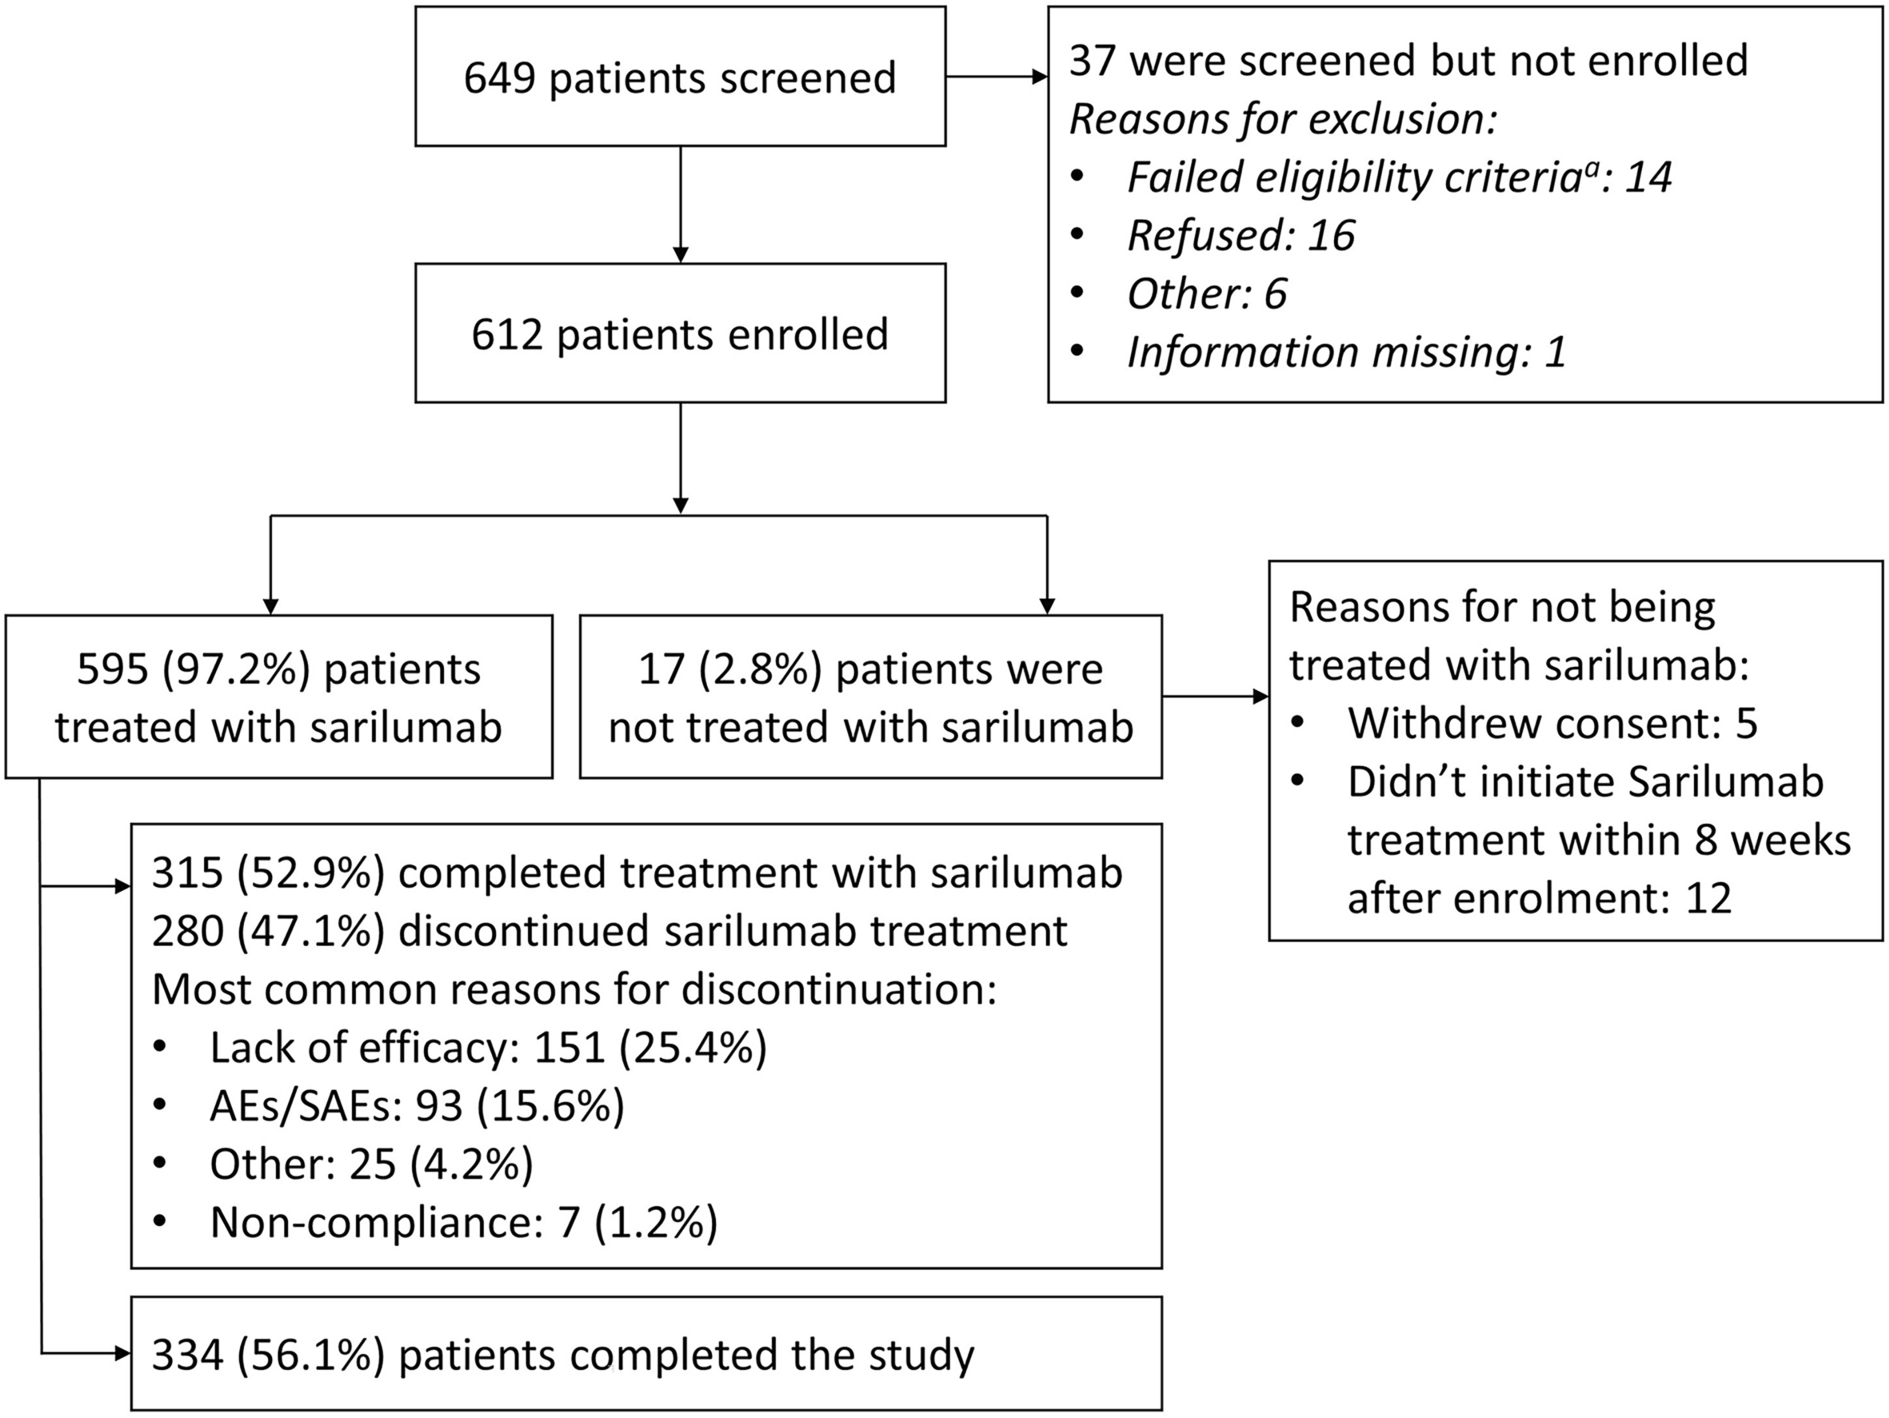


Due to the COVID-19 pandemic, patient recruitment slowed, and the enrollment stopped before reaching the planned 1000 patients. Of the 649 patients screened, 612 patients were enrolled by May 15, 2020, and met all eligibility criteria to participate in the study (Fig. 1).
Fig. 1
Patient disposition. AEs adverse events, SAEs serious adverse events. aA patient might have two or multiple failed eligibility criteria
In total, 595 patients received at least one dose of sarilumab and were included in the analyses, with 223 (37.5%) patients receiving sarilumab monotherapy and 372 (62.5%) patients receiving combination therapy; 315 (52.9%) completed treatment with sarilumab and 280 (47.1%) discontinued treatment early. The most commonly observed reasons for treatment discontinuation were lack of efficacy (151 [25.4%]), AEs/SAEs (93 [15.7%]), and others (25 [4.2%]).
The mean (SD) age of the treated population was 57.6 (11.8) years. Three-quarters of the treated population were female (n = 448, 75.3%), and most patients were Caucasian (n = 503, 84.5%). Overall, two-thirds of patients were overweight (defined as body mass index [BMI] ≥ 25 and < 30 kg/m2: n = 173/548, 31.6%) or obese (BMI ≥ 30 kg/m2: 198/548, 36.1%).
Most baseline demographic and disease characteristics were similar among patients from both treatment groups except for patients on monotherapy who had a slightly longer mean duration of disease than patients on combination therapy (11.2 vs. 9.3 years; Table 1). The mean disease activity scores, including CDAI, SDAI, swollen joint count (SJC) 28, tender joint count (TJC) 28, DAS28-CRP, and DAS28-ESR, at baseline were similar between patients on sarilumab as monotherapy or combination therapy.
Table 1 Baseline demographics and disease characteristicsIn total, 588 (98.8%) patients were treated with RA medications that had been discontinued before or were ongoing at the time of sarilumab initiation. There were 331 (55.6%) patients previously treated with bDMARDs (monotherapy group: 133 [59.6%]; combination therapy group: 198 [53.2%]) and 95 (16.0%) patients had received tsDMARDs (monotherapy group: 48 [21.5%]; combination therapy group: 47 [12.6%]). A higher proportion of patients on sarilumab monotherapy were previously on ≥ 3 b/tsDMARDs before sarilumab initiation compared with the combination therapy group (23.8 vs. 15.6%). Overall, about one-third of patients (monotherapy: 61 [27.4%]; combination therapy: 123 [33.1%]) received additional concomitant medication for RA after initiation of sarilumab (Table 1).
Sarilumab ExposureThe total cumulative exposure to sarilumab during the study period was 443.4 years among a total of 595 patients, of which 165.9 and 277.4 patient-years were accumulated for monotherapy and combination therapy groups, respectively (Supplementary Material Table S1). The mean (SD) sarilumab treatment duration was 38.9 (20.0) weeks and was comparable between monotherapy and combination therapy (38.8 [21.3] vs. 38.9 [19.2], respectively). The proportion of patients persistent with sarilumab therapy for the duration of the study was 52.9% (n = 315), while 24.4% (n = 145) switched to another bDMARD or tsDMARD. The rate of sarilumab treatment discontinuation was relatively steady through the first 18 weeks and then decreased slightly for both the treatment groups (Supplementary Material Fig. S2).
Effectiveness OutcomesCDAICDAI Remission (CDAI ≤ 2.8)In the ITT population, 8.2% of patients were observed responders at week 12 and 10.3% at week 52; 25.0% of patients stayed on sarilumab treatment without a CDAI assessment (missing data) at week 12 and 18.2% at week 52. The proportion of patients in each of these two categories were stable across the study visits (Fig. 2a).
Fig. 2

Observed remission/LDA and missing data in ITT population, and observed mean change from baseline in patients with data available. a CDAI remission (CDAI ≤ 2.8) observed and missing data. b CDAI LDA (CDAI ≤ 10) observed and missing data. c Observed CDAI mean score change from baseline. d DAS28-CRP remission (DAS28-CRP < 2.6) observed and missing data. e DAS28-CRP LDA (DAS28-CRP < 3.2) observed and missing data. f Observed DAS28-CRP mean score change from baseline. g DAS28-ESR remission (DAS28-ESR < 2.6) observed and missing data. h DAS28-ESR LDA (DAS28-ESR < 3.2) observed and missing data. i Observed DAS28-ESR mean score change from baseline. j Observed SDAI mean score change from baseline. CDAI Clinical Disease Activity Index, CRP C-reactive protein, DAS28 disease activity score in 28 joints, ESR erythrocyte sedimentation rate, LDA low disease activity, MMRM mixed-effect model for repeated measures, Rx treatment, SDAI Simplified Disease Activity Index, SE, standard error. In each figure of the observed mean change from baseline, the mean and SE at each visit were calculated based on the observed data at the visit; the p values for a comparison between monotherapy and combination therapy were calculated using an MMRM approach that included the initial treatment regimen, visit, and initial treatment regimen-by-visit interaction as fixed effects and the baseline value as a covariate
The proportion of patients who were observed as non-remission decreased from 45.7% at week 12 to 26.2% at week 52. However, the proportion of patients who discontinued sarilumab treatment increased from 21.0% at week 12 to 45.4% at week 52. This change was consistent with the scenario that the non-responders tended to discontinue treatment (Fig. 2a).
With the specified imputation, the estimated CDAI remission rate in the ITT population was 12.1% at week 12 and 15.4% at week 52. The proportions were stable across the study visits. The estimated remission rates were similar between the two cohorts of monotherapy and combination therapy (Fig. 2a and Supplementary Material Fig. S3).
CDAI LDA (CDAI ≤ 10.0)In the ITT population, 25.0% and 24.4% of patients were observed achieving CDAI LDA at week 12 and week 52, respectively, and the proportions were stable across the study visits. With the specified imputation, the estimated CDAI LDA rate was 36.7% at week 12 and 36.5% at week 52, and the proportions were stable across the study visits. These proportions were similar between the cohorts of monotherapy and combination therapy (Fig. 2b and Supplementary Material Fig. S3).
CDAI Change from Baseline over 52 weeksAmong patients (n = 533/595) with available scores in the ITT population, the mean (SD) CDAI score was 26.7 (13.4) at baseline. Upon initiation of sarilumab, an improvement in the mean (SD) CDAI score (14.4 [12.5]) was observed at week 12 with a mean (SD) reduction of −11.7 (13.6). The observed mean (SD) CDAI score decreased to 11.4 (10.3) at week 24, 10.9 (11.0) at week 36, and 10.0 (10.5) at week 52, resulting in a mean (SD) reduction of −14.9 (12.7), −14.7 (13.0), and −14.4 (12.9), respectively from baseline.
Similarly, a reduction in the CDAI at week 12 was also observed for sarilumab either as monotherapy or combination therapy (mean [SD] change from baseline: −12.1 [14.0] vs. −11.5 [13.3], respectively); further an additional moderate reduction was observed at week 24 (−15.7 [12.9] vs. −14.4 [12.6]) and was observed through week 52 (−14.6 [12.4] vs. −14.3 [13.3], respectively; Fig. 2c).
Under the assumption of data MAR, the data were analyzed based on MMRM model, and the results showed a data pattern similar to Fig. 2c.
The sensitivity analysis showed a pattern of CDAI change from baseline similar to the observed CDAI, except for a smaller mean reduction from baseline. This was expected because of imputation by the worst value, especially with a sizable number of patients being imputed with zero reduction from baseline due to no post-baseline assessments. Additionally, the mean reduction from baseline was stable from weeks 12–52 because of the additional moderate reduction at weeks 24–52, which was offset by additional missing data being imputed by the worst value due to treatment discontinuation. The mean CDAI changes from baseline were similar across monotherapy and combination therapy (data not shown).
A pattern similar to that of CDAI was observed for all other effectiveness endpoints (DAS-28 CRP, DAS-28 ESR, and SDAI) (Fig. 2d-j and Supplementary Material Fig. S3).
Routine Assessment of Patient Index Data 3 and PRO scoresIn the ITT population, the observed proportion of patients achieving the MCID of RAPID3 was 29.4% at week 12 and 21.2% at week 52. The estimated proportions achieving the MCID of RAPID3 with the specified imputation were 42.3% at week 12 and 31.4% at week 52. A consistent improvement in the as observed population and a slight decrease in patients achieving MCID over time were reported for RAPID3 (Fig. 3a-b and Supplementary Material Fig. S4j).
Fig. 3
Observed RAPID3 MCID response and missing data in ITT population, and observed mean change from baseline in patients with data available. a RAPID3 change from baseline ≤ −3.8 (MCID) observed and missing data. b Observed RAPID3 mean score change from baseline. MMRM mixed-effect model for repeated measures, RAPID3 routine assessment of patient index data 3, Rx treatment, SE standard error. The mean and SE at each visit were calculated based on the observed data at the visit; the p values for a comparison between monotherapy and combination therapy were calculated using an MMRM approach that included the initial treatment regimen, visit, and initial treatment regimen-by-visit interaction as fixed effects and the baseline value as a covariate
A similar pattern was observed for all other PROs (HAQ-DI, FACIT-Fatigue, Pain-VAS, and morning stiffness; Supplementary Material Fig. S4a–k).
Subgroup Analyses: Clinical Disease Activity Index Change from Baseline by SubgroupsWhen adjusted for baseline values, noticeable differences (p < 0.05) in the CDAI mean change from baseline was observed through week 52 between countries and among patients with/without prior tsDMARDs (Supplementary Material Fig. S5). Also, a noticeable difference (p < 0.05) in the CDAI mean change from baseline was observed among patients with/without prior bDMARDs and on the number of prior bDMARDs through week 36 and with/without prior tumor necrosis factor inhibitor (TNFi) and in the number of prior TNFis through week 24.
In the post hoc analysis, the p values adjusted for a false discovery rate were less than 0.05 for the differences in the CDAI mean change from baseline at weeks 12, 24, and 36 between countries; at weeks 36 and 52 among patients with/without prior tsDMARDs; at weeks 12 and 24 among patients with/without prior bDMARDs, on the number of prior bDMARDs, and with/without prior TNFi; and among patients on the number of prior TNFis at week 24 (data not shown).
However, without adjustment for the CDAI baseline value, overall, the mean change from baseline in the CDAI score was similar among patients (Supplementary Material Fig. S6a–d). The incidence of sarilumab discontinuations increased with the number of prior bDMARDs (Supplementary Material Fig. S7).
Safety OutcomesThe proportions of patients reporting any TEAE (monotherapy: 65.0% [145/223]; combination therapy: 66.9% [249/372]) or treatment emergent SAEs (monotherapy: 5.4% [12/223]; combination therapy: 6.2% [23/372]) were similar between both treatment groups (Table 2). Two patients died of TEAEs during the study: one patient on monotherapy died of renal failure and another patient with cardiac and pulmonary comorbidities receiving combination therapy died of acute respiratory failure. Overall, 15.6% of patients discontinued sarilumab treatment due to TEAEs.
The most commonly reported TEAEs of interest were neutropenia (14.1%), followed by injection site reactions (9.6%), elevation in lipids (7.9%), hypersensitivity (7.2%), and thrombocytopenia and potential risk of bleeding (6.6%). In approximately half (46.7%) of the patients with neutropenia, the dose was not changed. In the other half of the patients, action taken for neutropenia included dose reduction (21.5%), drug interruption (16.3%), and drug withdrawal (14.1%). A lower proportion of patients receiving monotherapy vs. combination therapy reported neutropenia (10.8 vs. 16.1%), thrombocytopenia and potential risk of bleeding (5.4 vs. 7.3%), and hepatic disorder (3.6 vs. 6.2%) as AEs of interest. Whereas a similar proportion of patients on monotherapy vs. combination therapy reported herpes zoster infection (2.7 vs. 2.2%), elevated lipids (8.1 vs. 7.8%), hypersensitivity (8.5 vs. 6.5%), and injection site reactions (10.3 vs. 9.1%). At the end of the study (week 52), the overall observed alanine aminotransferase (ALT) elevation between 1 and 3× upper limit of normal (ULN) was 16.8% (monotherapy: 15.3% (13/85); combination therapy: 17.6% [27/153]); no ALT elevations (> 5× ULN) were observed.
留言 (0)