
記住我


The demographic information and basic clinical features of the patients are summarized in Table 1. Sixty-eight patients (75 eyes) were diagnosed with ARN. Seven patients (8 eyes) were excluded because they either refused treatment or did not complete the 6-month follow-up. Two patients (2 eyes) with ophthalmic comorbidities, such as choroidal retinitis or ocular trauma history, were also excluded.
Therefore, the analysis included 59 patients (male:39; female:20) with 65 eyes. The mean age at diagnosis by eye was 46.71 ± 14.52 (12–70 years old). The mean follow-up period was 48.88 ± 25.79 months (6-108 months). Five patients (8.5%) had immunodeficiency, including post-bone marrow transplantation (2 cases) and AIDS (3 cases). According to the aqueous or vitreous PCR results, the 65 eyes’ viral etiology included VZV in 61 eyes (93.8%) and HSV in 4 eyes (6.2%). The median and interquartile range of initial viral load before treatment was 2.69 × 10⁵ (1.86 × 10³, 6.16 × 10⁵) copies/ml, and the initial IL8 content was 121.40 (57.60, 398.70) pg/ml. During the treatment and follow-up period, RD occurred in 34 eyes (52.3%), of which ten eyes were late-onset RD.
Table 1 Demographic characteristics and basic clinical data of patients with acute retinal necrosisTreatment managementAll patients received systemic antiviral therapy and IAI. Our protocol for systemic antiviral therapy is as follows: Acyclovir is administered at a dosage of 10–15 mg/kg intravenously over 1 h, three times a day. This intravenous medication is continued for 10 days to 3 weeks, followed by oral medication. The oral dosing regimen is 400–800 mg five times a day for 4–6 weeks. Alternative medications such as ganciclovir and foscarnet are considered in cases where acyclovir treatment proves to be ineffective. Local IAI medications include ganciclovir or foscarnet, with an average of 3 [2, 5] injections. The average interval from symptom onset to primary IAI is 20 [15, 22] days. After starting antiviral therapy, 15 patients (25.9%) received oral corticosteroid therapy, 43 patients (66.2%) received oral aspirin therapy, and four patients (6.9%) received prophylactic laser therapy. PPV was performed in all 34 eyes with RD and one with severe vitritis before RD.
Treatment outcomes: RD and VAWithin three months after the initial diagnosis of ARN, 31 eyes developed RD and required PPV. Seven eyes had recurrent RD after surgery. For the remaining 34 eyes that showed no signs of RD at presentation, three eyes developed late-onset RD at least three months after the diagnosis of ARN. Therefore, a total of 10 eyes developed late-onset RD. The median and interquartile range of final follow-up VA was 1.2 (0.5,2.6) logMAR, which was significantly lower than the initial VA of 0.9 (0.6,1.1) logMAR (P < 0.05). Final vision loss was observed in 35 eyes (53.8%). In the early-onset RD group, the final follow-up VA was 2.0 (1.1, 2.6) logMAR, which was significantly worse than the initial VA of 1.5 (0.9, 2.5) logMAR (P < 0.05). In the late-onset RD group, the final follow-up VA was 2.6 (1.1, 2.9) logMAR, which was significantly worse than the initial VA of 1.0 (0.8, 2.7) logMAR (P < 0.05).
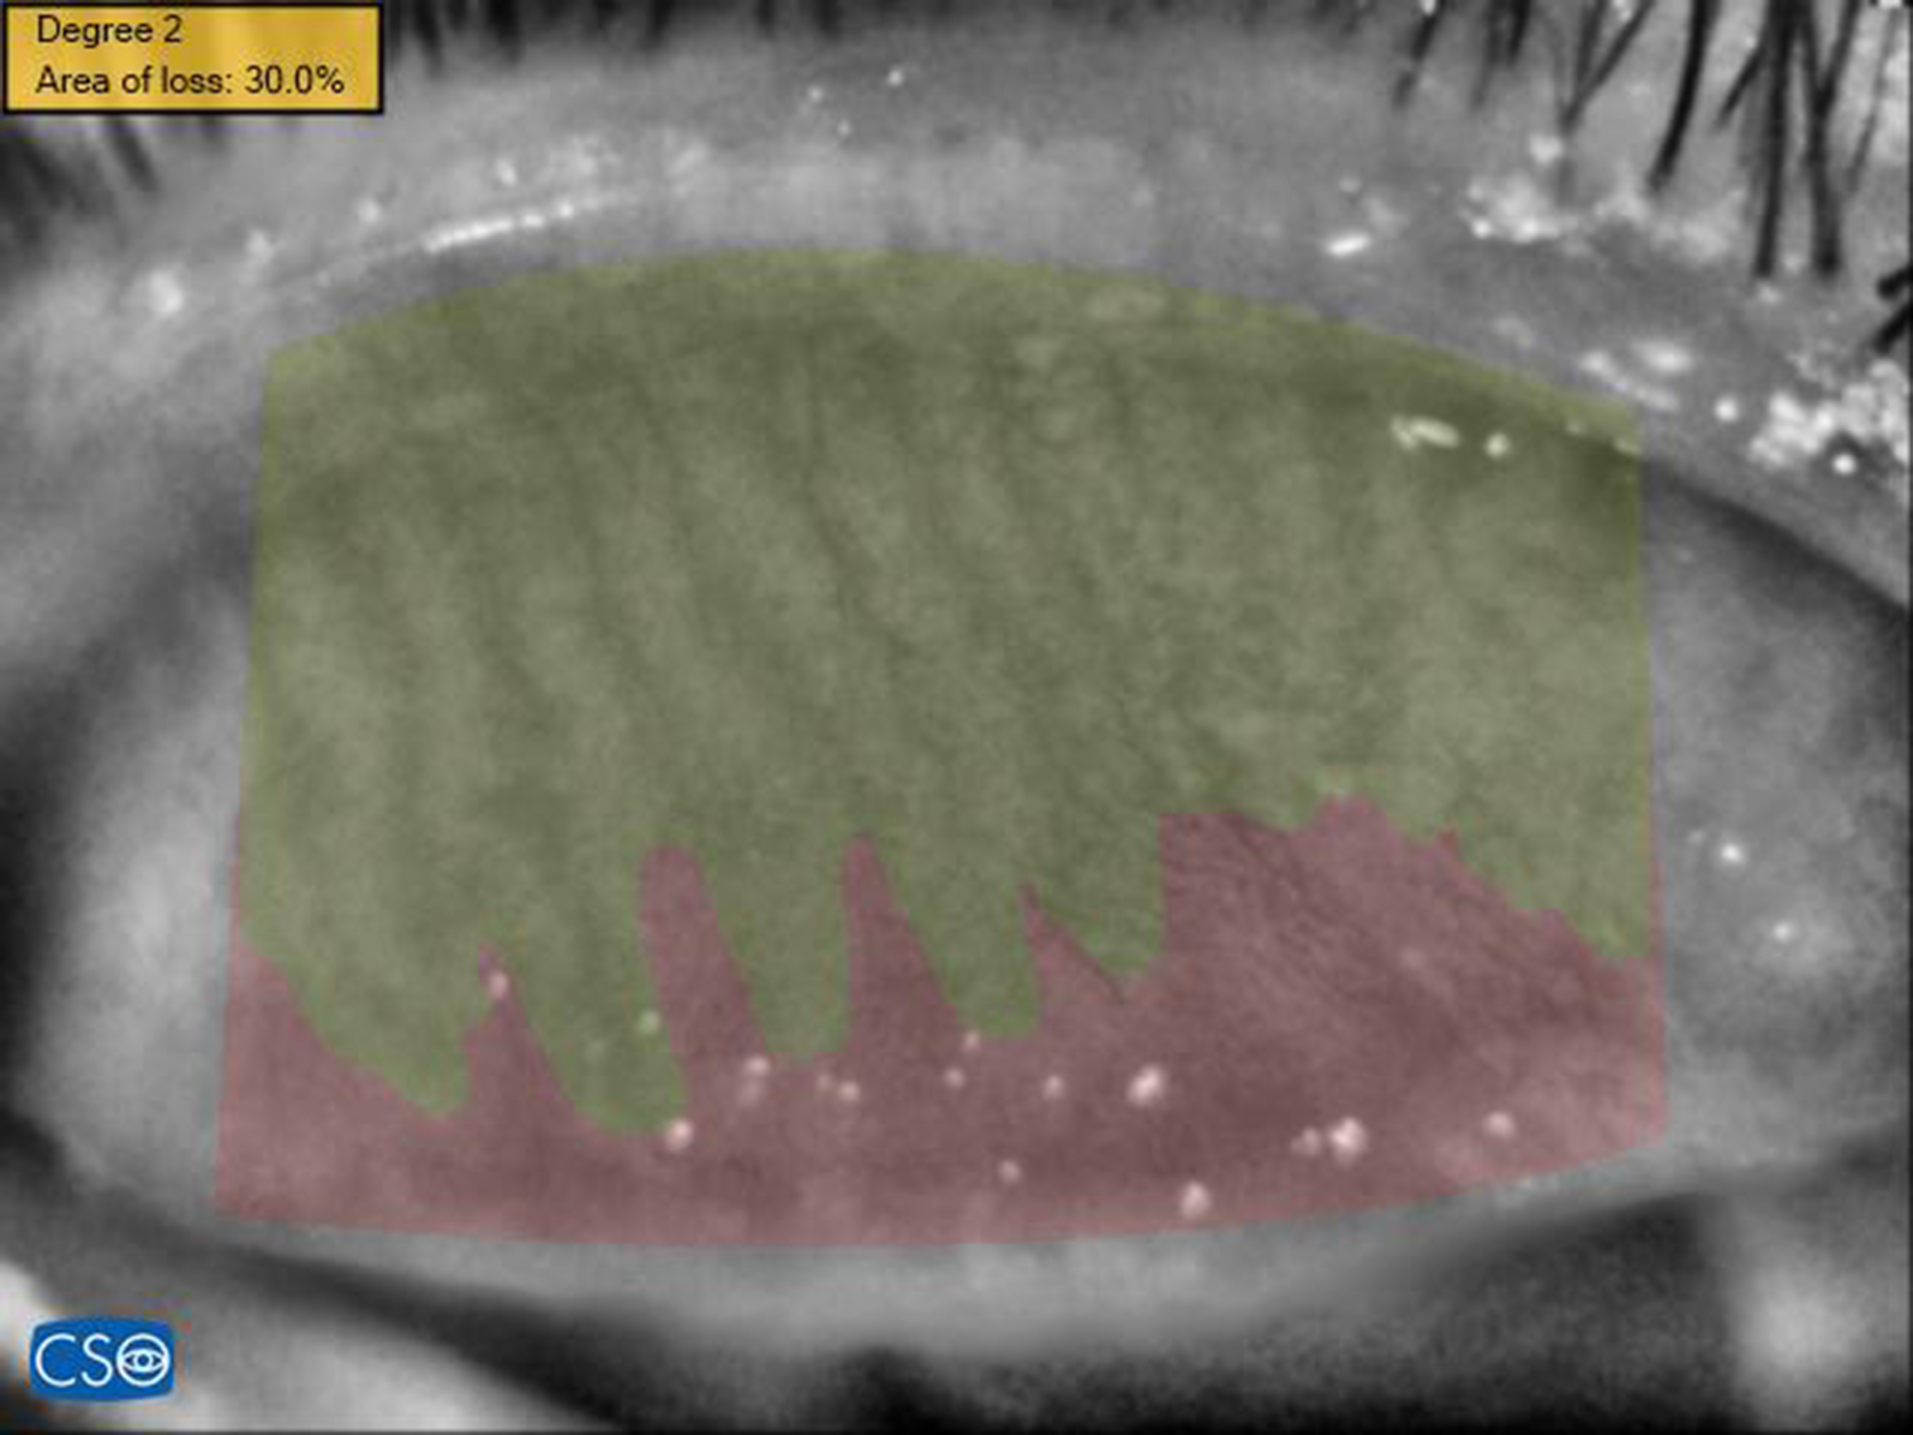
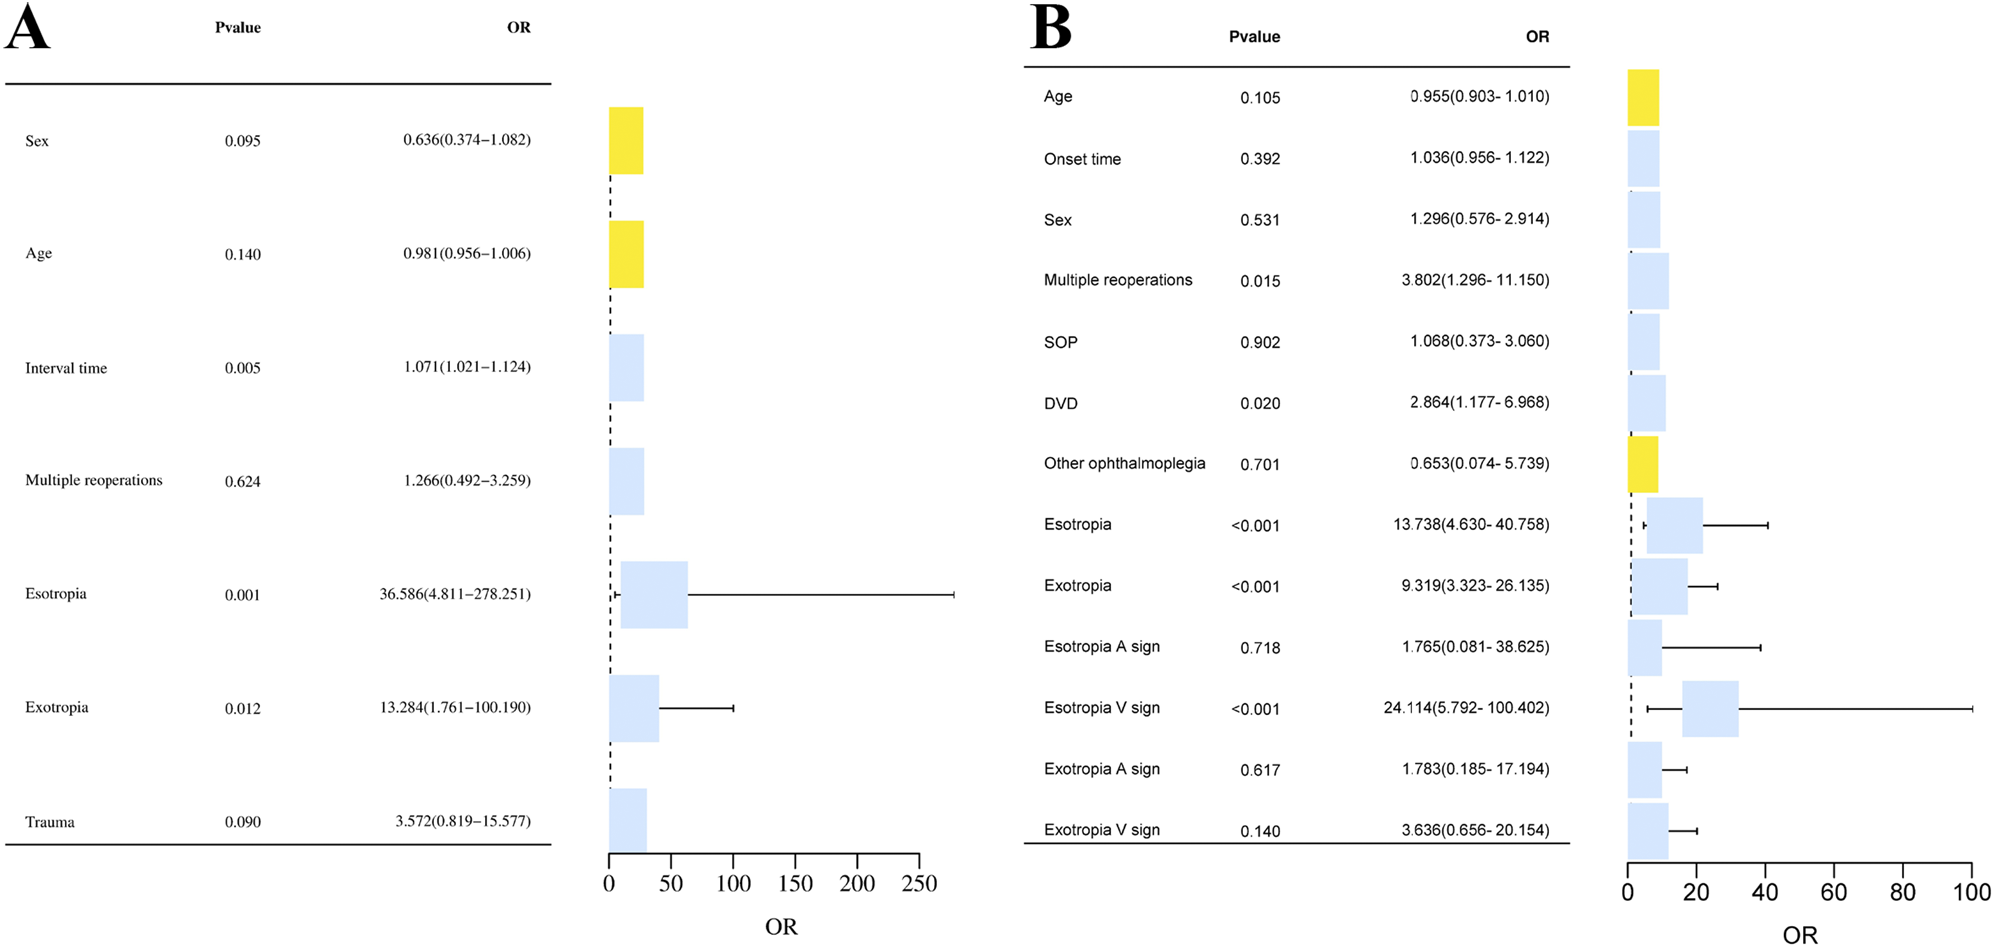
Risk factors for RDDemographic and clinical characteristics were evaluated by RD (Table 2). We assessed the risk factors for RD by univariate and multivariate analysis (Table 3). Compared with eyes that did not experience RD with a mean VA of 0.75 (0.53, 1.08) logMAR, eyes that experienced RD during follow-up had significantly worse mean VA of 1.00 (0.83, 2.00) logMAR at presentation (P < 0.05). Eyes that experienced RD had necrotizing retinitis involving more than 75% of quadrants in 27 eyes (79.4%), which was significantly higher than eyes that did not experience RD in 6 eyes (19.4%) (P < 0.001). Eighteen (52.9%) eyes that experienced RD had anterior chamber flare levels greater than or equal to grade 2, which was significantly higher than eight eyes (25.9%) that did not experience RD (P < 0.05). Eyes that experienced RD had a mean aqueous or vitreous log10(viral load) of 6.60 (5.83, 7.16), which was significantly higher than eyes that did not experience RD with a mean of 5.24 (3.93, 5.99) (P < 0.05). The median and interquartile range of IL-8 content before treatment in RD patients was 826.39 (376.62, 3,939.50) pg/ml, which was higher than 428.25 (199.53, 1,191.92) in no RD-developed eyes. However, the difference was not statistically significant. We created a multivariate logistic regression model using the variables related with RD (P < 0.20) in the univariate analysis (Table 3). In this model, the OR value for the more considerable extent of necrotizing retinitis was 4.181 (95% CI, 1.950-10.834) (P < 0.001), and the OR value for the enormous viral load was 1.721 (95% CI, 1.07–3.083) (P < 0.05).
Table 2 Clinical characteristics related with retinal detachment in eyes with acute retinal necrosisTable 3 Univariate and Multivariate regression analysis for eyes with acute retinal necrosis: estimation of risk factors for retinal detachmentPrognostic factors associated with late-onset RDWe grouped the cohort according to late-onset RD occurrence and compared the groups’ baseline characteristics and treatment factors (Table 4). We assessed the prognostic factors for late-onset RD by univariate and multivariate analysis (Table 5). Late-onset RD eyes had a worse initial VA of 0.95 (0.80, 2.45) logMAR (while the initial VA of no late-onset RD developed eyes was 0.90 (0.60, 1.10) logMAR). Moreover, all late-onset RD involved more than 75% retinal quadrants of necrotizing retinitis at presentation. In the multivariate model, only the interval between symptom onset and primary IAI (OR, 1.204; 95% CI, 1.040–1.480; P < 0.05) showed a statistically significant increased risk of late-onset RD. We performed ROC curve analysis with the interval between symptom onset and primary IAI as the test variable and late-onset RD as the status variable to evaluate its predictive performance. The model AUC value was 0.786 (0.615–0.957), the optimal cutoff value was 20 days, the sensitivity was 100%, the specificity was 58.3%, the positive predictive value (PPV) was 41.2%, the negative predictive value (NPV) was 100% (Fig. 1).
Fig. 1
Receiver operating characteristic (ROC) curve of the interval between ARN symptoms appear and primary IAI for late-onset RDeristic (ROC) curve of Initial visual acuity (logMAR) for final visual loss. AUC: area under the curve; sens: sensitivity; spec: specificity; PPV: positive predictive value; NPV: negative predictive value
Table 4 Basic clinical data and treatment factors related with late-onset retinal detachment in eyes with acute retinal necrosisTable 5 Univariate and Multivariate regression analysis for eyes with acute retinal necrosis: estimation of prognostic factors associated with late-onset retinal detachmentPrognostic factors associated with final vision lossWe also grouped the cohort according to the final vision outcome and compared the groups’ baseline characteristics and treatment factors (Table 6). We assessed the prognostic factors for final vision loss by univariate and multivariate analysis (Table 7). Lower initial VA (the no final vision loss group had 0.70 (0.53, 1.00) logMAR, while the final vision loss group had 1.00 (0.90, 2.53) loMAR, P = 0.001), RD at initial presentation of ARN (6.7% and 22.9%, respectively, p = 0.011) and late-onset RD (P = 0.089) increased the risk of final vision loss. Regarding treatment factors, no clear correlation was found between treatment modality and final vision loss. The multivariate logistic regression model confirmed that worse initial VA (OR, 3.895; 95% CI, 1.551–13.662; P = 0.013), RD at initial presentation of ARN (OR, 10.84; 95% CI, 1.62–72.41; p = 0.014) and late-onset RD (OR, 6.735; 95% CI, 1.876–27.282; P = 0.005) were statistically significant factors on final vision loss. We performed ROC curve analysis with initial VA as the test variable and final vision loss as the outcome variable to evaluate its predictive performance. The model AUC value was 0.846 (0.754, 0.938), the optimal Cutoff value was 0.656 logMAR; sensitivity was 76.5%, specificity was 80.0%, PPV was 81.2%, and NPV was 75.0% (Fig. 2).
Fig. 2
Receiver operating characteristic (ROC) curve of Initial visual acuity (logMAR) for final visual loss. AUC: area under the curve; sens: sensitivity; spec: specificity; PPV: positive predictive value; NPV: negative predictive value
Table 6 Basic clinical data and treatment factors related with final vision outcomes in eyes with acute retinal necrosisTable 7 Univariate and Multivariate regression analysis for eyes with acute retinal necrosis: estimation of prognostic factors associated with final vision loss (<20/200)Correlation of early viral load and initial inflammatory indicatorsTable 8 shows the correlation between the early viral load and initial inflammatory indicators. We used the changing amplitude of viral load to measure how much it decreased relatively to its initial value after the first IAI. This ratio was strongly related to initial IL8 content (Spearman correlation coefficient=-0.741, P = 0.000) and moderately related to the initial degree of aqueous flare (Spearman correlation coefficient=-0.508, P = 0.010).
Table 8 Spearman correlation analysis between the early viral load and initial inflammatory indicators
留言 (0)