
記住我
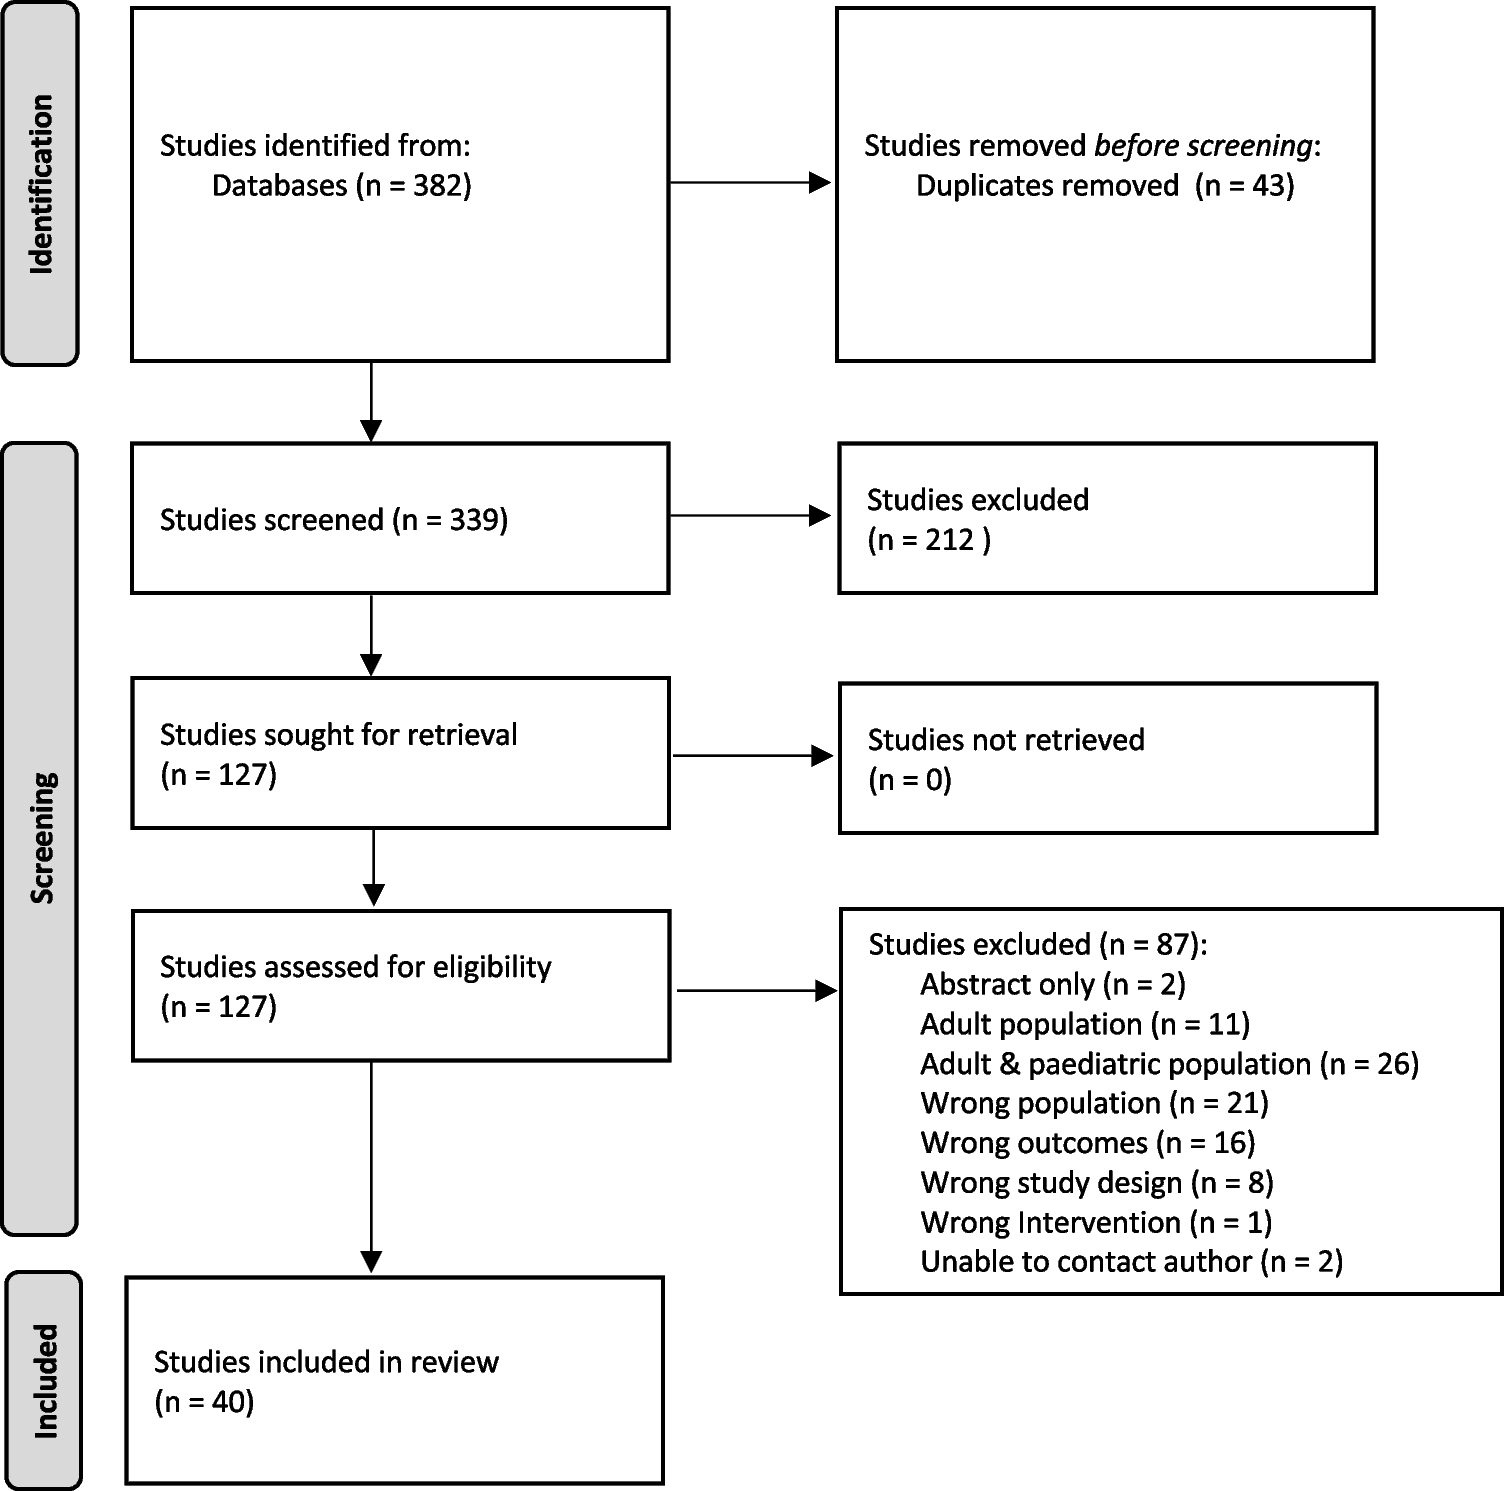

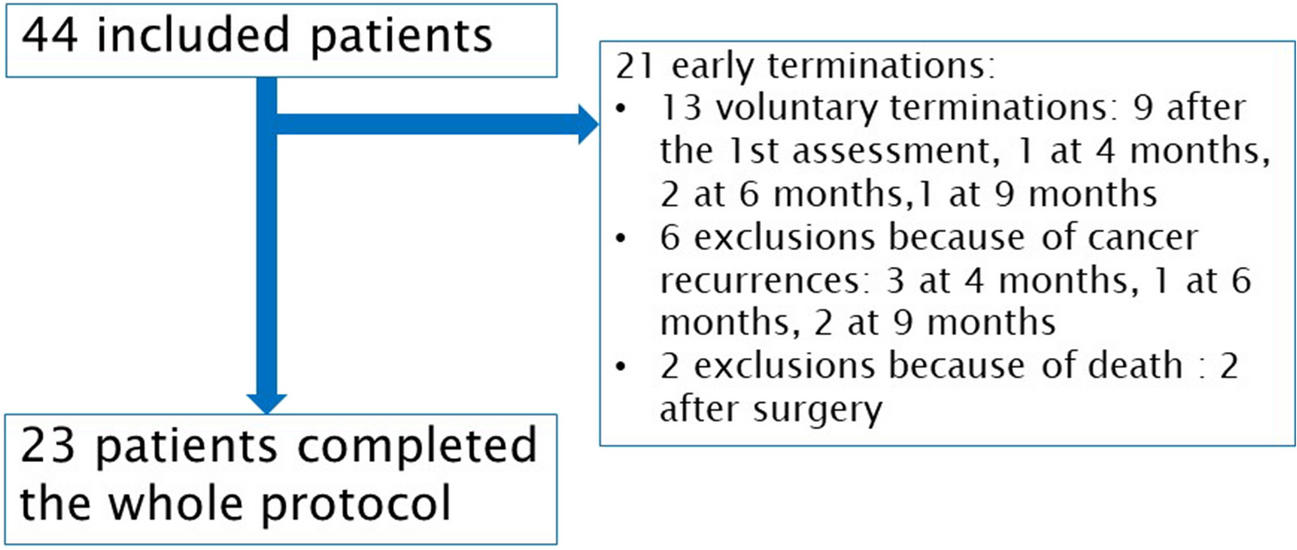

Figure 1 demonstrates the study selection process in accordance with the PRISMA guidelines [8]. A total of 382 studies were identified in the initial screening, and 40 studies met the inclusion criteria.
Fig. 1
PRISMA flow diagram of study identification and selection
Characteristics of included studiesStudy characteristics are summarized in Table 1.. Of the 40 studies included, there were 29 (72.5%) retrospective cohort (RC) studies, 7 (17.5%) prospective cohort (PC) studies, 1 (2.5%) retrospective case–control (RCC) study, and 3 (7.5%) randomized control trials (RCT, control arm only). Fourteen (35%) studies included hematological malignancy only [24,25,26,27,28,29,30,31,32,33,34,35,36], 1 (2.5%) study included solid tumor malignancy only [37], and the remaining 25 (62.5%) studies included all malignancies [5, 24, 38,39,40,41,42,43,44,45,46,47,48,49,50,51,52,53,54,55,56,57,58,59,60]. Studies were conducted across Asia and Pacific [40, 43, 45, 48, 51], North America [28, 30, 34, 38, 47, 53, 58, 61, 62], South America [46], Africa [60], and Europe [5, 24,25,26, 29, 31,32,33, 36, 37, 39, 41, 42, 44, 49, 50, 52, 54,55,56,57, 59, 63].
Table 1. Study characteristicsStudy qualityThe MMAT tool [23] was used to assess the quality of the studies, and overall, the quality of the studies included was mixed, as summarized in Table 2. There were several studies that did not provide adequate definitions for outcomes. Redkar et al. [43] were contacted and able to provide a definition for CLABSI but not for other complications; therefore, only data for CLABSI were included in the analysis. Only device failure data was able to be included for both Buonpane et al. [53] and Mangum et al. [47] as other definitions were unable to be clarified by the authors. Three studies grouped CLABSI and local infection together, and as these were not able to be clarified, data from these outcomes were not included [24, 36, 38]. One study did not meet the criteria for CLABSI and was excluded [25]. Several studies were unable to clarify if patients with CVAD-associated VTE were symptomatic and thus were excluded [5, 34, 35, 38, 48].
Table 2 Study quality assessmentOutcomesTable 3 reports the pooled proportions and IRs of CVAD-associated complications.
Table 3 Subgroup analyses: proportion and incidence rates of CVAD-associated complications by device typeOverall complicationsOverall, 31.4% (95% CI 22.5–41.1; 33 studies, 6920 devices) of pediatric CVADs experienced a complication, with an IR of 2.3 per 1000 catheter days (95% CI 1.6–3.2; 14 studies; 840,688 catheter days; Table 3). There was a high degree of heterogeneity observed in the pooled data for both proportion (I2 = 99%; Chi2 = 2399, df = 32, p = < 0.01, prediction interval [0.0–88.9]) and IR (I2 = 98%; Chi2 = 680.8, df = 13, p = < 0.01, prediction interval [0.2–6.8]). Tunneled CVADs had the highest pooled proportion of overall complications (TCVC 33.1% [95% CI 23.0–44.0], 1092 CVADs; TCCVC 37.5% [95% CI 32.0–43.4]; 293 CVADs) and the highest pooled IR per 1000 catheter days (1.8 [95% CI 1.5–2.1], 137,890 catheter days). PICCs had the lowest pooled proportion of overall complications (22.7% [95% CI 2.9–52.6]; 358 CVADs), whereas TIVADs had the lowest pooled IR per 1000 catheter days (1.3 [95% CI 0.9–1.8]; 267,898 catheter days). Funnel plots for both proportions and rates were visually symmetrical (Egger’s test: p = 0.19 and 0.12, respectively).
CVAD failureOverall, 14.8% (95% CI 10.2–20.1; 24 studies; 11,762 devices; I2 = 98%; Chi2 = 943, df = 23, p = < 0.01, prediction interval [0.0–48.8]) of CVADs failed prior to completion of planned therapy, with an IR of 0.5 per 1000 catheter days (95% CI 0.3–0.8; 12 studies; 798,000 catheter days (I2 = 96%; Chi2 = 290, df = 11, p = < 0.01, prediction interval [0.0–2.2]; Table 3). Tunneled CVADs had the highest pooled proportion of device failure (TCVC 21.2% [95% CI 4.1–46.2], 1136 CVADs; TCCVC 30.4% [95% CI 25.2–36.0]; 293 CVADs). TIVADs had the highest pooled IR per 1000 catheter days of device failure (0.2 [95% CI 0.0–0.8]; 260,635 catheter days). Funnel plot for proportion was asymmetrical on visual inspection (p = 0.04), but symmetrical for rates (p = 0.59).
CLABSIOverall, 21.2% (95% CI 14.3–28.9; 26 studies; 5052 devices; I2 = 98%; Chi2 = 1031, df = 25, p = < 0.01, prediction interval [0.0–67.7]) of CVADs developed a CLABSI, with an IR of 0.9 per 1000 catheter days (95% CI 0.6–1.3; 12 studies; 798,094 catheter days; I2 = 96%; Chi2 = 267, df = 11, p = < 0.01, prediction interval [0.0–2.7]; Table 3). Figure 2 demonstrates the pooled proportion by device type. TCVCs had the highest pooled proportion of CLABSI (30.4% [95% CI 21.3–40.3]; 785 CVADs) and the highest pooled IR per 1000 catheter days (1.7 [95% CI 1.4–1.9]; 99,681 catheter days). Funnel plot was symmetrical on visual inspection for both proportions and rates (p = 0.13 and 0.55, respectively).
Fig. 2
Pooled proportion of CLABSI by device subgroup. Abbreviations: CLABSI, central line–associated bloodstream infection; TCVC, tunneled central venous catheter; TIVAD, totally implanted venous access device; PICC, peripherally inserted central catheter; TCCVC, tunneled cuffed central venous catheter; CI, confidence interval
CVAD-associated VTEOverall, 5.2% (95% CI 2.2–9.3; 12 studies; 4008 devices; I2 = 95%; Chi2 = 244, df = 11, p = < 0.01, prediction interval [0.0–25.6]) of CVADs developed a VTE. The IR of VTE per 1000 catheter days was 0.0 (95% CI 0.0–0.1; 3 studies, 147,455 catheter days; I2 = 22%; Chi2 = 2.57, df = 2, p = 0.28, prediction interval [0.0–1.3]; Table 3). TIVADs had the highest pooled proportion of VTE (37.2% [95% CI 28.6–46.4]; 121 devices). No studies reported catheter days by device type; therefore, IRs for subgroup analysis could not be determined. Funnel plot was symmetrical on visual inspection for both proportions and rates (p = 0.14 and 0.14, respectively).
Local infectionOverall, 3.9% (95% CI 1.5–7.1; 11 studies; 2497 devices; I2 = 92%; Chi2 = 120, df = 10, p = < 0.01, prediction interval [0.0–20.4]) of CVADs experienced local infection, with an IR of 0.1 per 1000 catheter days (95% CI 0.0–0.3; 9 studies; 737,729 catheter days; I2 = 93%; Chi2 = 108, df = 8, p = < 0.01; prediction interval [0.0–0.8]; Table 3). TIVADs had the highest pooled proportion of local infection (7.3% [95% CI 3.9–11.7); 501 CVADs) and the highest pooled IR per 1000 catheter days (0.1 [95% CI 0.1–0.2]; 260,635 catheter days). Funnel plot was symmetrical on visual inspection for both proportions and rates (p = 0.47 and 0.45, respectively).
OcclusionAs shown in Table 3, overall, 6.3% (95% CI 3.8–9.3; 11 studies; 2562 devices; (I2 = 88%; Chi2 = 83.15, df = 10, p = < 0.01; prediction interval [0.0–20.3]) of CVADs experienced occlusion. The IR of occlusion per 1000 catheter days was 0.8 (95% CI 0.3–1.3; 7 studies, 513,716 catheter days; (I2 = 97%; Chi2 = 202, df = 6, p = < 0.01; prediction interval [0.0–3.5]). PICCs had the highest pooled proportion of occlusion (7.3% [95% CI 4.9–10.6]; 354 CVADs). TCVCs had the
留言 (0)