
記住我
Pulmonary diseases are intricately linked to human life and lead to significant public health challenges on a global scale due to their high incidence or mortality rates (Zhou et al., 2019). In recent years, with the emergence of gut microbiota, metabolomics, and proteomics, this area is receiving increasing attention. The discovery of the gut-lung axis suggests the potential manipulative role of the gut microbiome(gene) in treating pulmonary diseases (Budden et al., 2017). Metabolomics, through the study of metabolites, reveals potential biomarkers that can pave the way for disease prevention (Qiu et al., 2023). Metabolites, serving as the end products or intermediate compounds of metabolism, fulfill essential functions in the human body. The exploration of changes in intermediate metabolites or metabolic pathways provides a profound understanding of the progression of diseases (Johnson et al., 2016). Changes in blood proteins more finely reflect changes in the functioning of the organism. Thus, co-alterations in the gut microbiota, metabolites, and their proteins may play a key role in the etiologic formation of lung-related diseases and the identification of key therapeutic targets.
Sodium-glucose cotransporter 2 (SGLT2) inhibitors constitute a class of oral antidiabetic drugs, which includes dapagliflozin, empagliflozin, and others (Zannad et al., 2020). These inhibitors have been found to affect glycemic control, as well as potentially altering levels of gut microbiota and blood metabolites (particularly amino acids, ketones, and lipids), which can affect disease progression (Kappel et al., 2017; Cowie and Fisher, 2020; Herat et al., 2020; Szekeres et al., 2021). This finding may play a crucial role in improving pulmonary diseases.
Exploring the impact of SGLT2 inhibitors on pulmonary diseases faces significant challenges. Recently, Mendelian randomization (MR) has gained prominence as a widely used research method to assess the causal effects between exposure and outcomes, while minimizing biases arising from confounding factors or reverse causation (Kintu et al., 2023). MR analysis utilizes individual genetic variations as instrumental variables (IVs), simulating a randomized controlled trial (Georgakis and Gill, 2021). We employed this method, leveraging extensive Genome-Wide Association Studies (GWAS) and identified single nucleotide polymorphisms (SNPs) associated with SGLT2 inhibitors, to establish the causal relationship between SGLT2 inhibitors and pulmonary diseases.
The previous studies have applied MR analysis to assess the relationship between SGLT2 inhibitors and atrial fibrillation, coronary artery disease, and fractures, involving circulating metabolites as intermediaries (Xu et al., 2022; Dai et al., 2023; Li et al., 2023). Therefore, to gain a more comprehensive understanding of the association between SGLT2 and pulmonary diseases, building upon these studies, we hypothesize that gut microbiota and circulating metabolites may mediate the impact of SGLT2 inhibition on pulmonary diseases. Therefore, the objective of this article is to implement a two-sample MR approach to: (1) assess the causal effects of SGLT2 inhibitors and pulmonary diseases; (2) investigated the potential causal effects of SGLT2 inhibitors on gut microbiota and circulating metabolites; (3) conducted a two-step MR study to determine the mediating effects of gut microbiota and circulating metabolites on the relationship between SGLT2 inhibitors and pulmonary diseases; (4) analyzed relevant metabolites to gain insights into potential metabolic pathways underlying the association between SGLT2 and pulmonary diseases; (5) fine mapping based on instrumental variables of mediators and proteomic MR analysis to obtain effector genes; and (6) phenome-wide association analyses to determine potential side effects of SGLT2 inhibitors.
2 Materials and methods2.1 Study designFigure 1 presents a schematic overview of the study design. The MR design should meet three necessary assumptions (Figure 1): (A) The genetic variants selected as instrumental variables (IVs) should demonstrate a robust correlation with the exposure (SGLT2 inhibitors, gut microbiota, metabolites); (B) The genetic instruments should exhibit no correlation with the occurrence of pulmonary diseases and should remain independent of potential confounding factors; (C) The genetic variant should show a distinct association with pulmonary diseases, mediated specifically through exposure rather than other pathways.
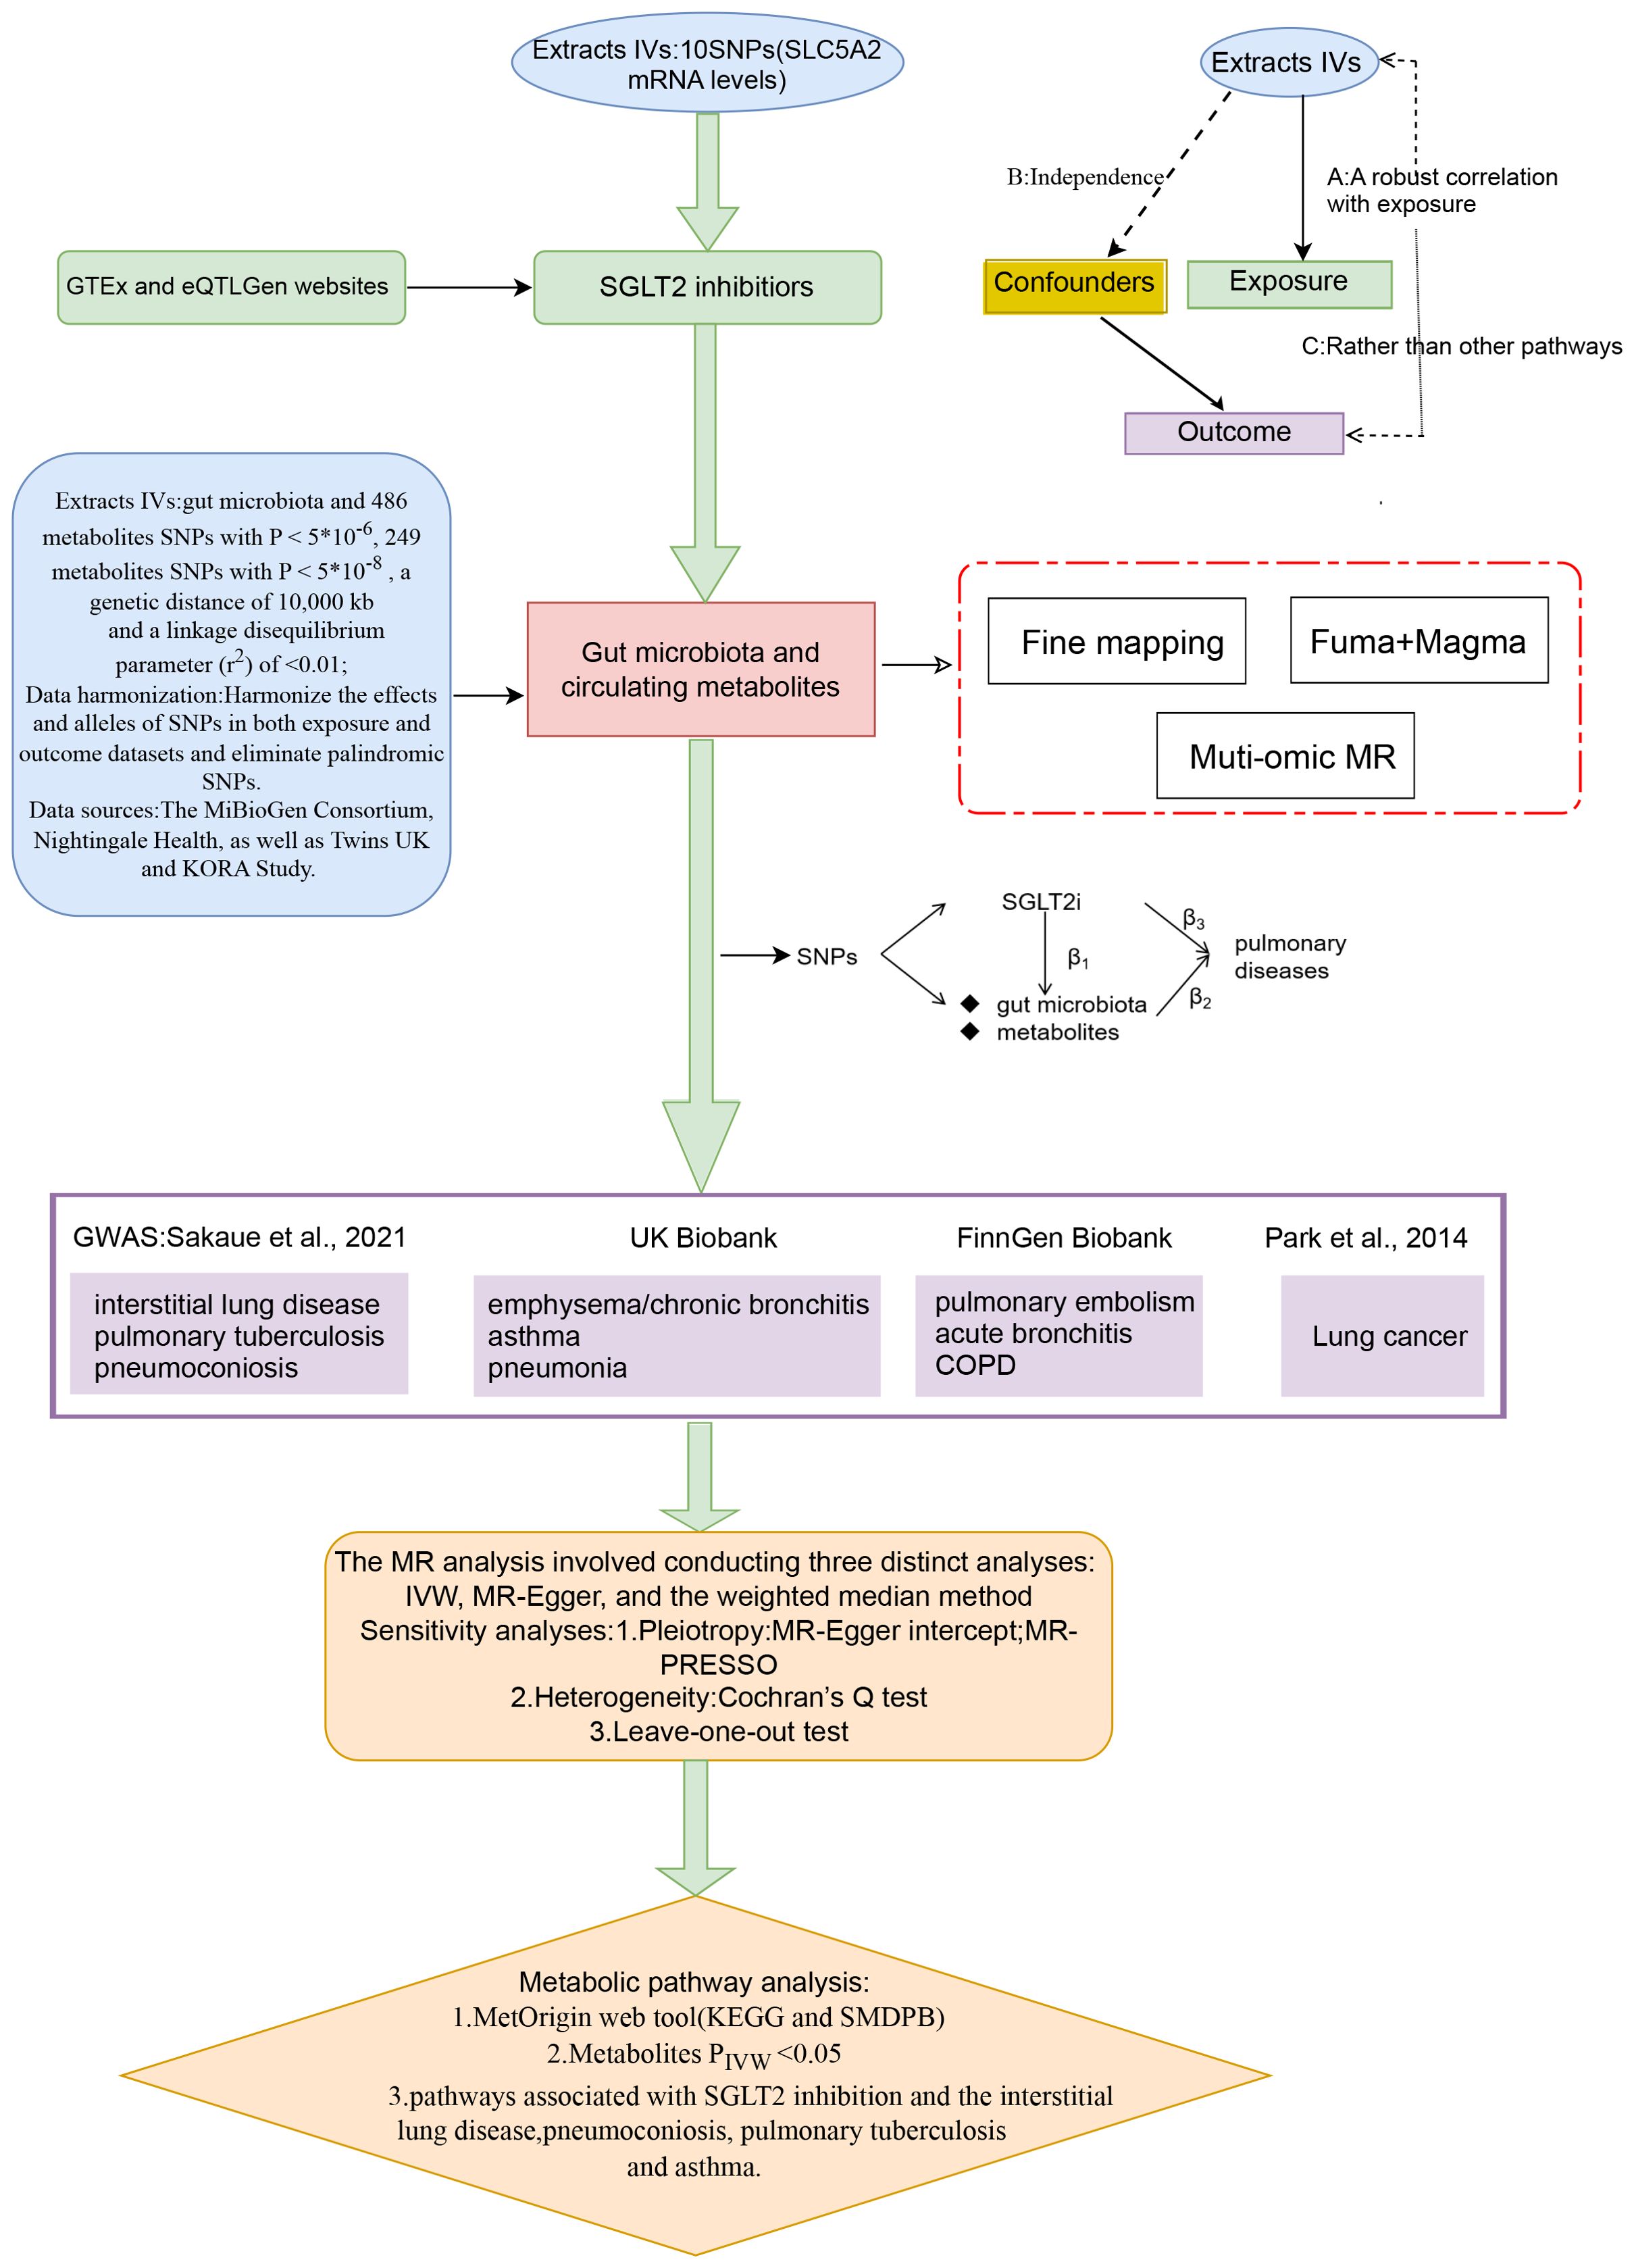
Figure 1. A schematic overview of the study design. We conducted a two-sample, two-step MR study to assess the association between SGLT2 inhibition and 10 pulmonary diseases and to investigate the mediating effects of gut microbiota and metabolite. Gene-fine mapping and annotation of mediators by FUMA and Magma analyses were performed, and causal associations of mapped genes with diseases were assessed by muti-omics MR analyses. IVs, instrumental variables; IVW, inverse-variance weighted; MR, Mendelian randomization; SNPs, single nucleotide polymorphisms.
2.2 IVs for SGLT2 inhibitorsIVs for SGLT2 inhibitors were obtained by the study methodology reported in a previous article (Li et al., 2023). In brief, SNP information concerning SLC5A2 mRNA levels was obtained from blood or whole tissue data available on the Genotype-Tissue Expression (GTEx) (2020) and eQTLGenwebsites (Võsa et al., 2021). The SNPs were evaluated and screened for variants significantly associated with glycated hemoglobin (HbA1c) levels (glucose-lowering target) on the basis of r2 < 0.8 and 250 kb (P< 1×10⁻⁴). Finally, shared variants between the two were confirmed by co-localization analysis.
2.3 Data sources on the gut microbiota and circulating metabolitesThe MiBioGen Consortium provided comprehensive summary statistics on the genetic impact on the human gut microbiota, including genome-wide genotyping data from 14,363 individuals of European ancestry (Kurilshikov et al., 2021). A total of 211 taxonomic groups (16 orders, 35 families, 131 genera, 20 classes, 9 phyla) were included in the relevant analysis of this study. To incorporate a more comprehensive set of metabolites, we selected data from two sources. One dataset comprised 249 circulating metabolites from 121,000 participants of European ancestry, generated by Nightingale Health, primarily covering lipids and lipoprotein particles (81%) (Ritchie et al., 2023). The second dataset involved 486 metabolites from 7,824 participants of European ancestry in the TwinsUK and KORA studies, encompassing eight categories of metabolites: Amino acid, Lipid, Carbohydrate, Nucleotide, Energy, Cofactors and vitamins, Peptide, and Xenobiotics (Shin et al., 2014). For overlapping metabolites from two data sources, we chose to exclude them if the direction of their impact on the outcomes of pulmonary diseases was inconsistent.
2.4 IVs selection for gut microbiota and circulating metabolitesIn the analysis of 249 metabolites, SNPs with p-values below the genome-wide significance threshold (5 × 10⁻⁸) were selected as IVs. In the analysis of 211 gut microbiota and 486 blood metabolites, to enhance sensitivity to IVs and obtain more comprehensive results, SNPs with p-values below the genome-wide significance threshold (5 × 10⁻⁶) were chosen as IVs. Subsequently, all IVs underwent linkage disequilibrium (LD) clumping (r2 = 0.01; distance = 10,000 kb) to alleviate the impact of correlated SNPs. Additionally, we used the PhenoScanner version to prevent the selected SNP from showing significant pleiotropic associations. Furthermore, we calculated the F-statistic (R2 (N–2)/(1–R2)), assessing the strength of each instrument, where R2 represents the proportion of variance explained by the genetic instrument, and N is the effective sample size (Kwok et al., 2020). Finally, we excluded palindromic SNPs from our study.
2.5 IVs selection for pQTLpQTL data for blood proteins were obtained from a study based on the Icelandic (n = 35559) population (Ferkingstad et al., 2021) and were analyzed in the MR analysis using the same SNP screening conditions as previously (P < 5 × 10⁻⁸).
2.6 Data sources on the pulmonary diseasesTen pulmonary diseases are categorized according to clinical criteria outlined by the World Health Organization (WHO) and the tenth edition of the International Classification of Diseases (ICD-10). Data summaries for interstitial lung disease, pulmonary tuberculosis, and pneumoconiosis were extracted from publicly accessible datasets as provided by the GWAS conducted by Sakaue et al (Sakaue et al., 2021). For asthma, pneumonia, and emphysema/chronic bronchitis outcomes, we utilized data from the UK Biobank, a large cohort of UK adult volunteers, to provide detailed information (Bycroft et al., 2018). Summary-level data for pulmonary embolism, acute bronchitis, and chronic obstructive pulmonary disease (COPD) were generated from the FinnGen Biobank (Kurki et al., 2023). Lung cancer was sourced from the Transdisciplinary Research into Cancer of the Lung consortium (Park et al., 2014). All studies within these consortia obtained approval from local research ethics committees and institutional review boards, and participants in each study provided written informed consent. Table 1 outlines the characteristics of the summarized datasets for the ten pulmonary diseases.
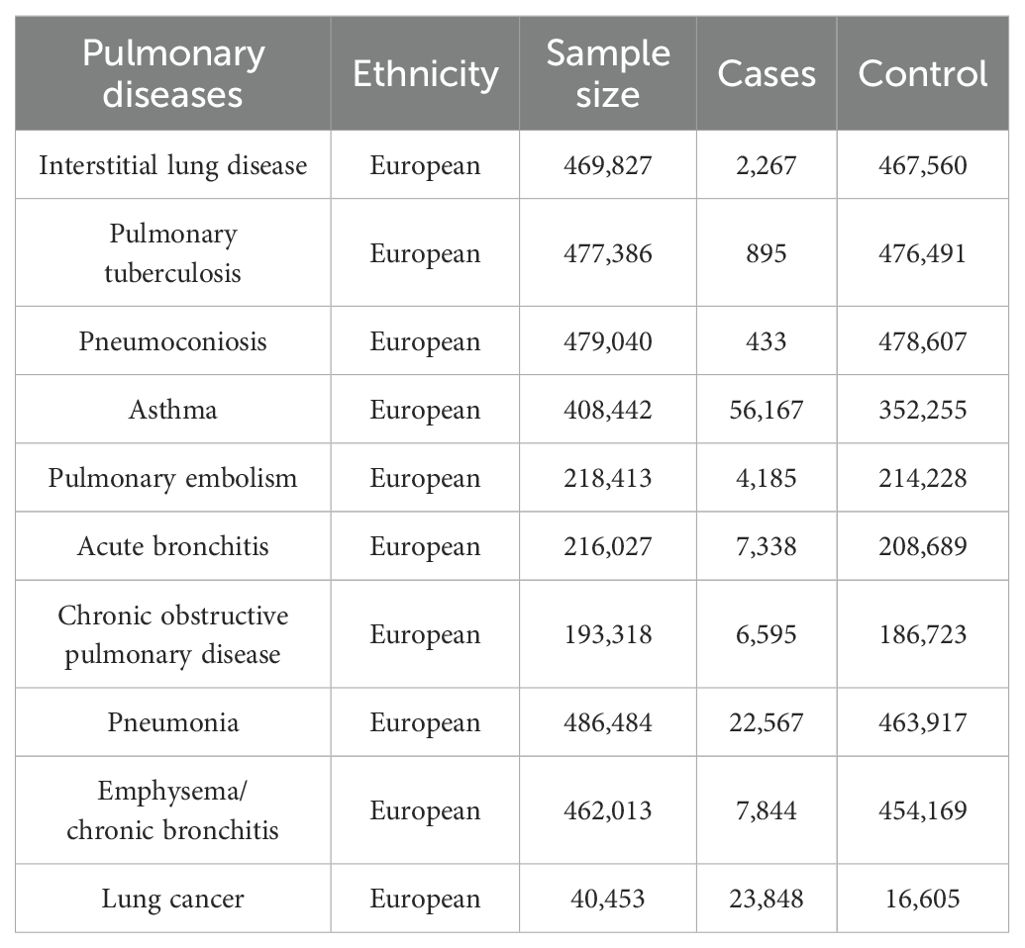
Table 1. The characteristics of the ten pulmonary diseases.
2.7 MR statistical analysisA two-sample MR analysis was employed to assess the causal relationship between SGLT2 inhibition and ten pulmonary diseases as well as T2DM. A two-step MR was performed to estimate the mediating effect of gut microbiota and circulating metabolites on the association between SGLT2 inhibition and positive pulmonary diseases. The first step of the two-step MR involved assessing the impact of SGLT2 inhibition on gut microbiota and circulating metabolites (beta1). In the second step, we evaluated the influence of gut microbiota and metabolites significantly associated with SGLT2 inhibition on the positive pulmonary diseases (beta2). The proportion mediated by gut microbiota and metabolites in the association between SGLT2 inhibition and positive pulmonary diseases was calculated as the product of beta1 and beta2 divided by the total effect of SGLT2 inhibition on positive pulmonary diseases (beta 3). The 95% confidence interval for the mediation proportion was calculated using the product of coefficients method.
The primary analysis employed the IVW method to derive the final effect estimate. To ensure the accuracy of the results, additional sensitivity analyses were performed, including the MR-Egger method, weighted median analysis, and MR pleiotropy residual sum and outlier (MR-PRESSO) test. The MR Egger method, known for accommodating directional horizontal pleiotropic effects, addresses the possibility of SNP effects on target outcomes through alternative biological pathways independent of the investigated exposure (Wu et al., 2020). SNPs were assessed using a weighted median approach, considering precision relative to magnitude, with the median determining the overall MR estimate, and standard errors estimated through bootstrapping (Mohus et al., 2022). The MR-PRESSO test identified potential horizontal pleiotropy, and its impact was addressed by excluding outliers from the analysis (Verbanck et al., 2018). Leave-one-out analyses were conducted to assess pleiotropy associated with individual SNPs. Heterogeneity and outliers were examined using I2 and Cochran Q-derived P-values in the IVW and MR-Egger analyses.
In this study, a p-value less than 0.05 was considered nominally associated. When assessing the impact of SGLT2 inhibition on 10 pulmonary diseases, we employed Bonferroni correction (Sedgwick, 2014) to rigorously control for false positives across multiple tests. Additionally, for the associations of microbiota and metabolites with pulmonary diseases, we applied a slightly more lenient False Discovery Rate (FDR) correction (Storey and Tibshirani, 2003) to control for false positives across multiple tests. To identify additional microbiota and metabolites that may potentially be associated, we expanded the FDR-corrected p-value threshold to 0.2.
Statistical analyses were executed with R software version 4.2.3, and the MR analyses were carried out using the TwoSampleMR package along with the MRPRESSO package.
2.8 Fine mapping to identify target gene affecting diseaseWe used FUMA (https://fuma.ctglab.nl/) for fine mapping of instrumental variables for metabolites and gut microbiota with mediating effects, using a maximum P-value of 1× 10⁻⁵ for lead SNPs for annotation (Watanabe et al., 2017).
2.9 Magma analysisThe genes obtained by fuma are put into the “GENE2FUNC function” to annotate the genes according to the biological background. GTEX V8 was used as the background gene set.
2.10 Muti-omic analysisTwo-sample MR analysis was performed to assess the causal relationship between pQTL of finely mapped acquired genes and lung disease. P-value less than 0.05 was considered nominally associated.
2.11 PheWAS analysisWe conducted a comprehensive whole-phenotype MR analysis to explore the potential side effects associated with SGLT2 inhibitors. In this study, we utilized gene expression data as the exposure variable and disease summary statistics from the UK Biobank cohort, encompassing a substantial sample size of up to 408,961 individuals, as the outcome measure. To ensure robustness in our phenotype-MR analysis, we meticulously selected 783 distinct traits, each with a substantial case count exceeding 500, thereby enhancing the reliability and generalizability of our findings.
2.12 Metabolic pathway analysisWe conducted an analysis of metabolic pathways using the network-based MetOrigin (http://metorigin.met-bioinformatics.cn/) (Yu et al., 2022) for functional enrichment and pathway exploration. This approach aimed to identify potential connections between metabolic pathways, metabolite groups, or biological processes and the impact of SGLT2 inhibitors on pulmonary diseases. The significance threshold for the pathway analysis was set at 0.05. Additionally, our study only focused on analyzing metabolites identified by the IVW method with associations surpassing the recommended threshold (P < 0.05).
3 Results3.1 Selection of IVsTen independent IVs were chosen as genetic instruments for SGLT2 inhibition (Supplementary Table S1). The analysis involved a range of 3 to 12 selected IVs for gut microbiota (Supplementary Table S1) and 3 to 159 IVs for metabolites (Supplementary Tables S2, S3). It is crucial to note that the F statistics for all SNPs surpassed the threshold of 10, suggesting a negligible probability of encountering weak instrument bias.
3.2 Causal effects of SGLT2 inhibition on 10 pulmonary diseases and T2DMIn the MR analysis, after Bonferroni correction (p<0.05/11), we observed that SGLT2 inhibition was associated with a lowered risk of Interstitial lung disease (OR: 0.054, 95% CI: 0.020–0.148, p = 1.31×10⁻⁸), Pulmonary tuberculosis (OR: 0.280, 95% CI: 0.123–0.639, p = 2.48×10⁻³), Pneumoconiosis(OR: 0.002, 95% CI: 7.58×10⁻⁵–0.037, p = 5.18×10⁻⁵), Asthma (OR: 0.706, 95% CI:0.601–0.829, p = 2.22×10⁻⁵) and T2DM (OR: 0.457, 95% CI: 0.253–0.823, p = 9.13×10⁻³) (Supplementary Table S4). The results of the sensitivity analysis did not indicate the presence of heterogeneity or directional pleiotropy (Figure 2).
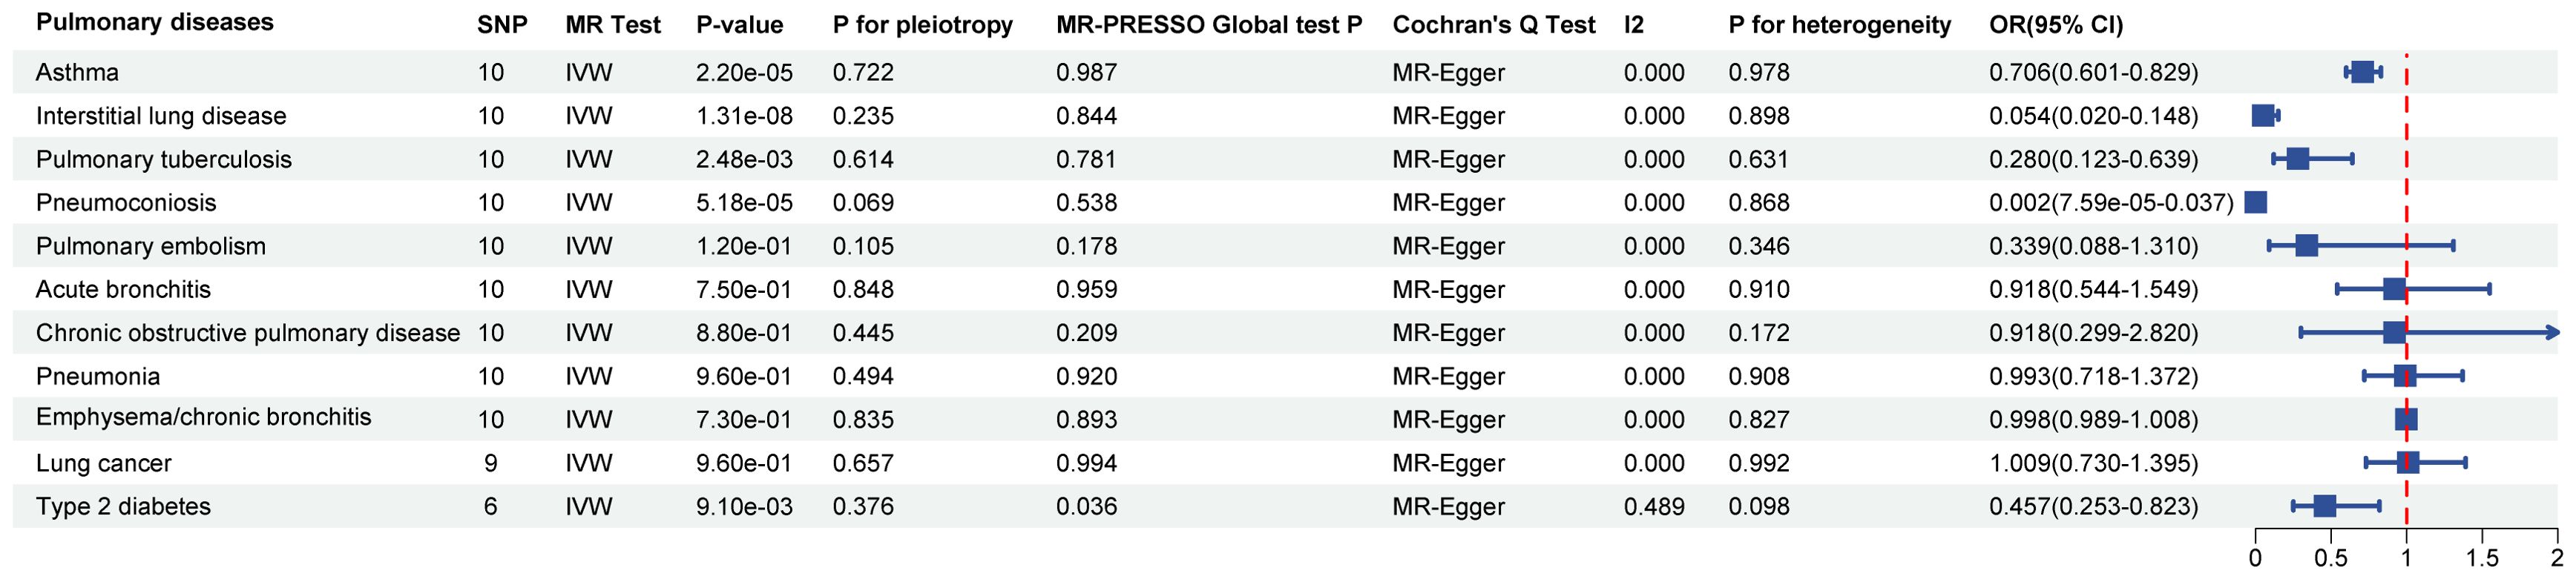
Figure 2. Causal effects of SGLT2 inhibition on 10 pulmonary diseases and T2DM. Forest plot showing the Inverse Variance-Weighted method for determining causal associations between SGLT2 inhibitors and ten prior lung diseases. MR-ivw analyses with P-value < 0.05 were determined to be positive results, P for pleiotropy > 0.05 showed that MR analyses were not pleiotropic, and P for heterogeneity > 0.05 indicated that MR analyses were not heterogeneous. IVW, inverse-variance weighted; OR, odds ratio.
3.3 Causal effects of SGLT2 inhibition on gut microbiota and metabolitesThe IVW method revealed 152 nominally significant associations (p < 0.05) between SGLT2 inhibition and gut microbiota, 173 nominal associations with 249 circulating metabolites, and 220 nominal associations with 486 metabolites (Figures 3–5; Supplementary Table S4).
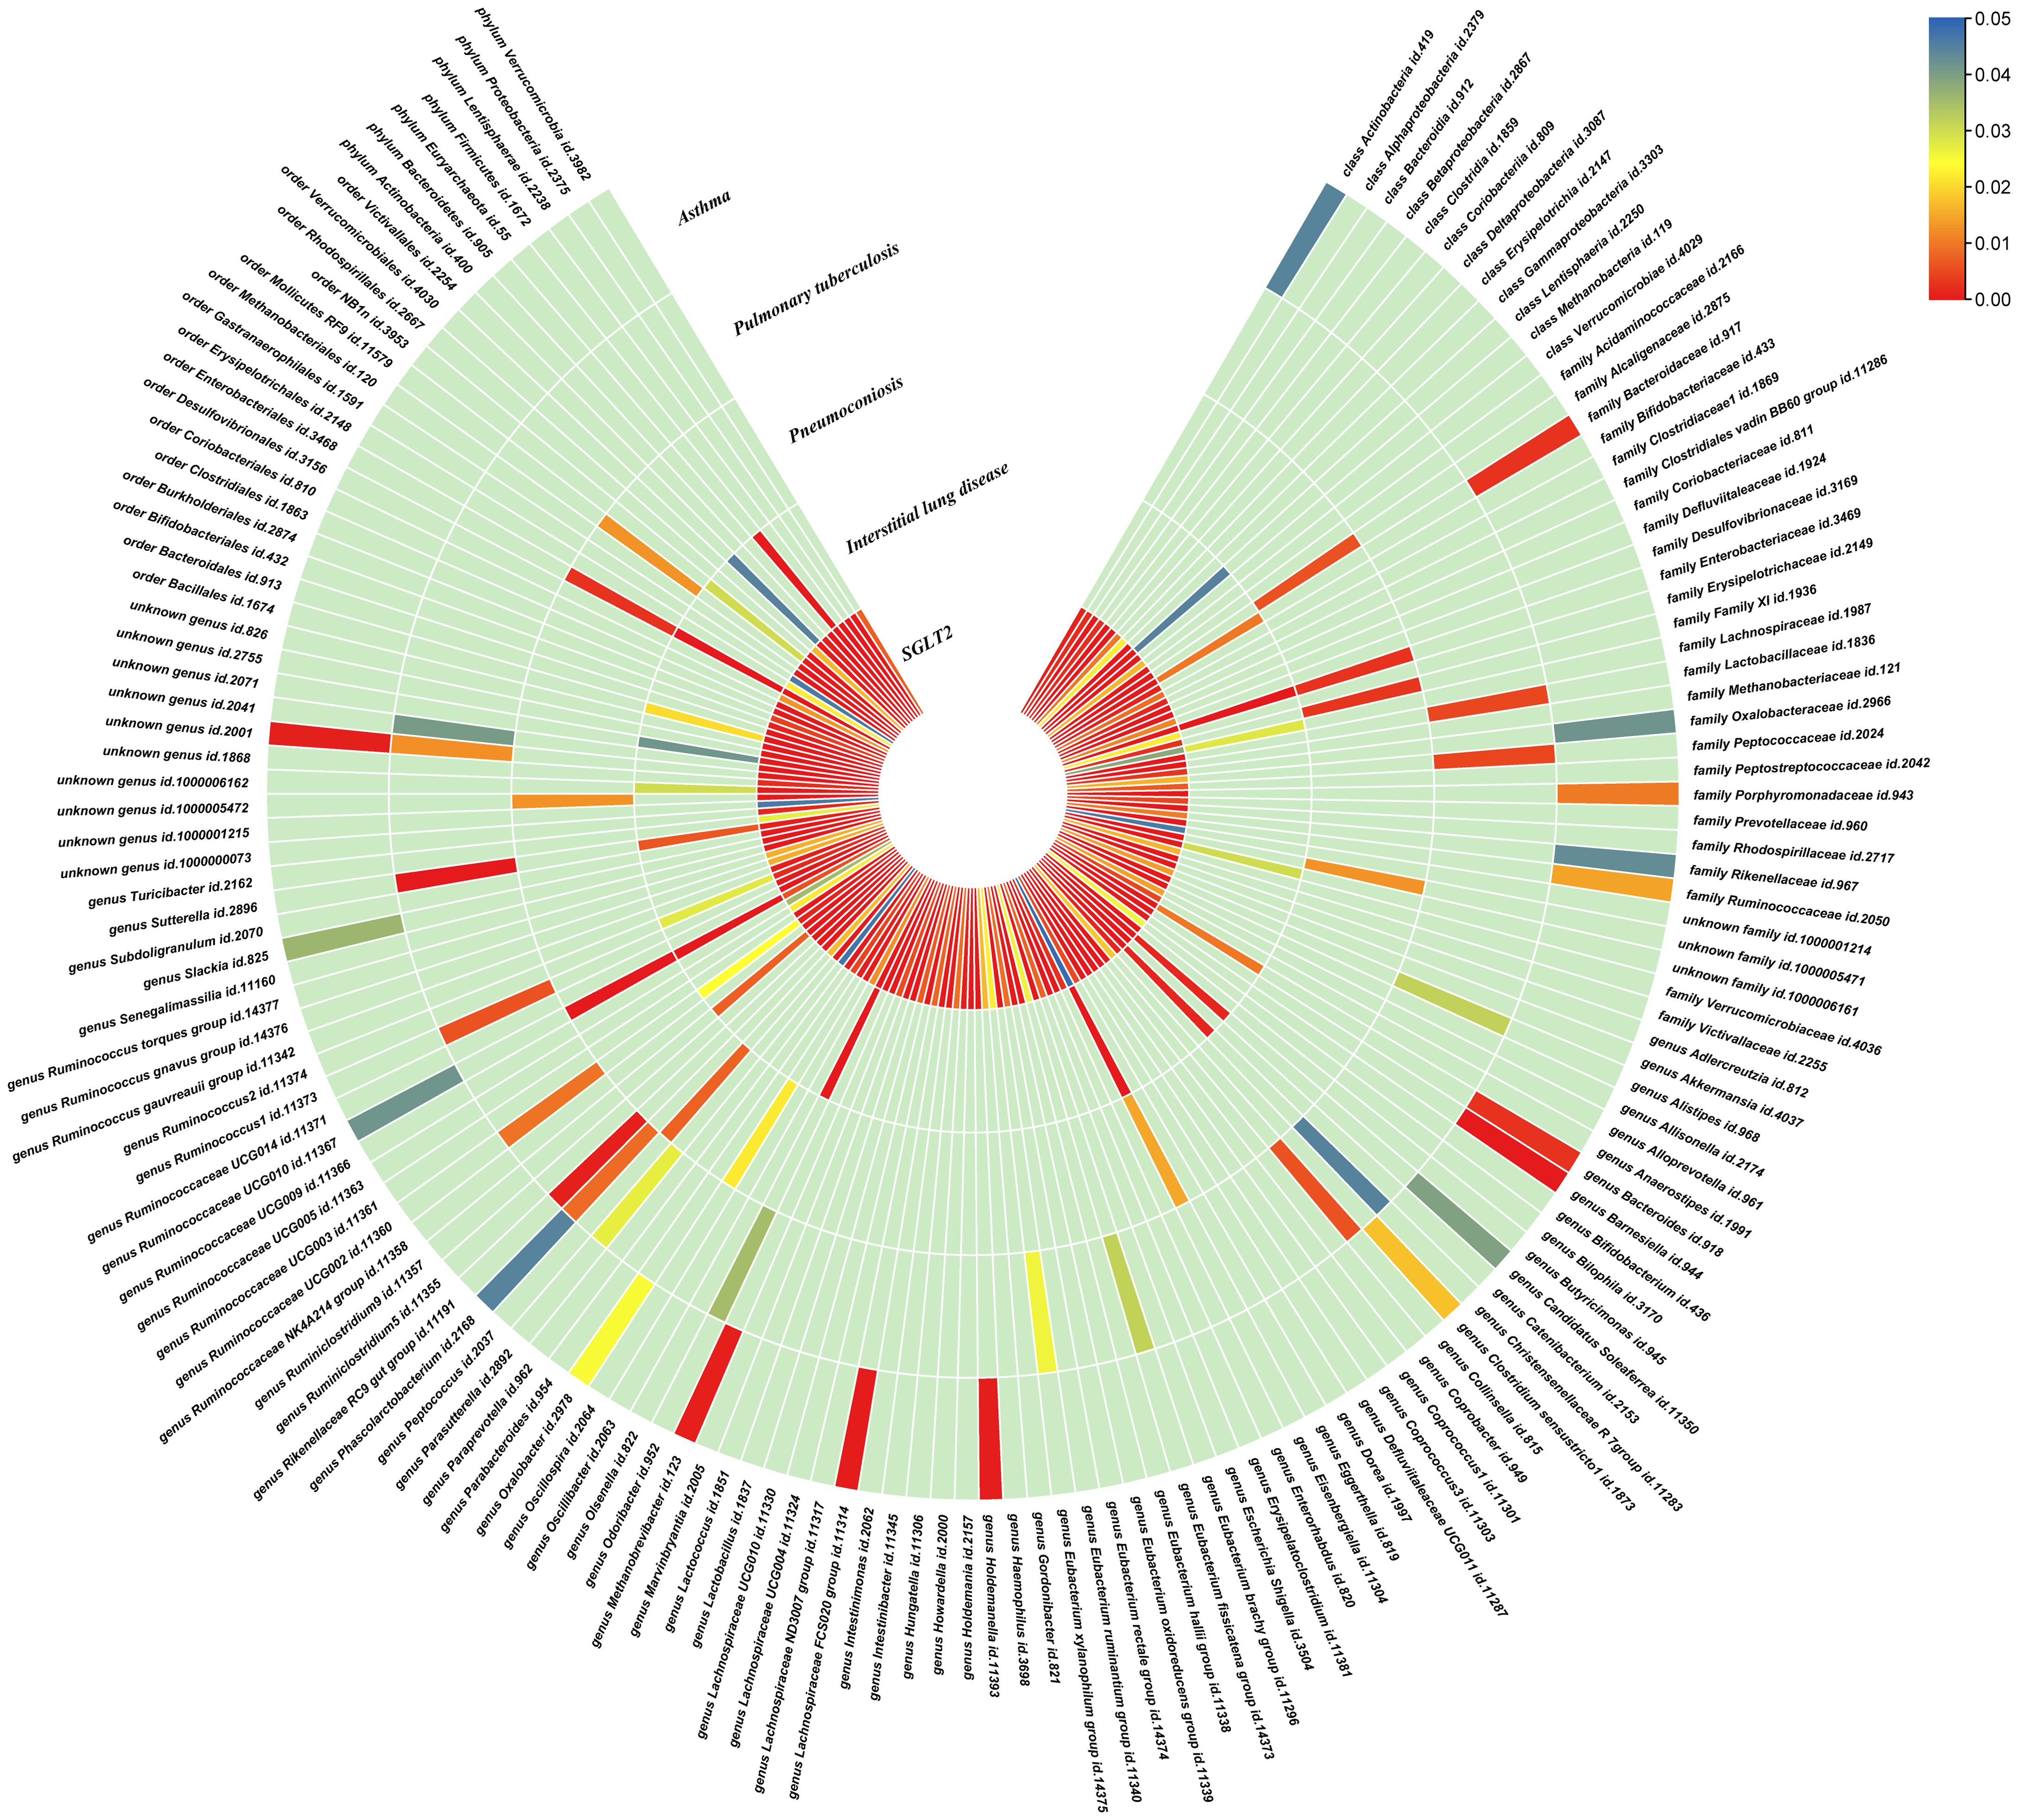
Figure 3. Causal effects of gut microbiota on interstitial lung disease, pulmonary tuberculosis, pneumoconiosis, and asthma. Circumferential thermograms showing causally linked gut microbiota in interstitial lung disease, tuberculosis, pneumoconiosis and asthma. The circular thermogram is divided into five layers representing the P-value results of MR analysis of SGLT2i, interstitial lung disease, pulmonary tuberculosis, pneumoconiosis, and asthma with gut microbiota. The change in color of each cell indicates the magnitude of the P-value. The redder the color of each cell, the smaller the P value; the bluer the color of each cell, the larger the value.
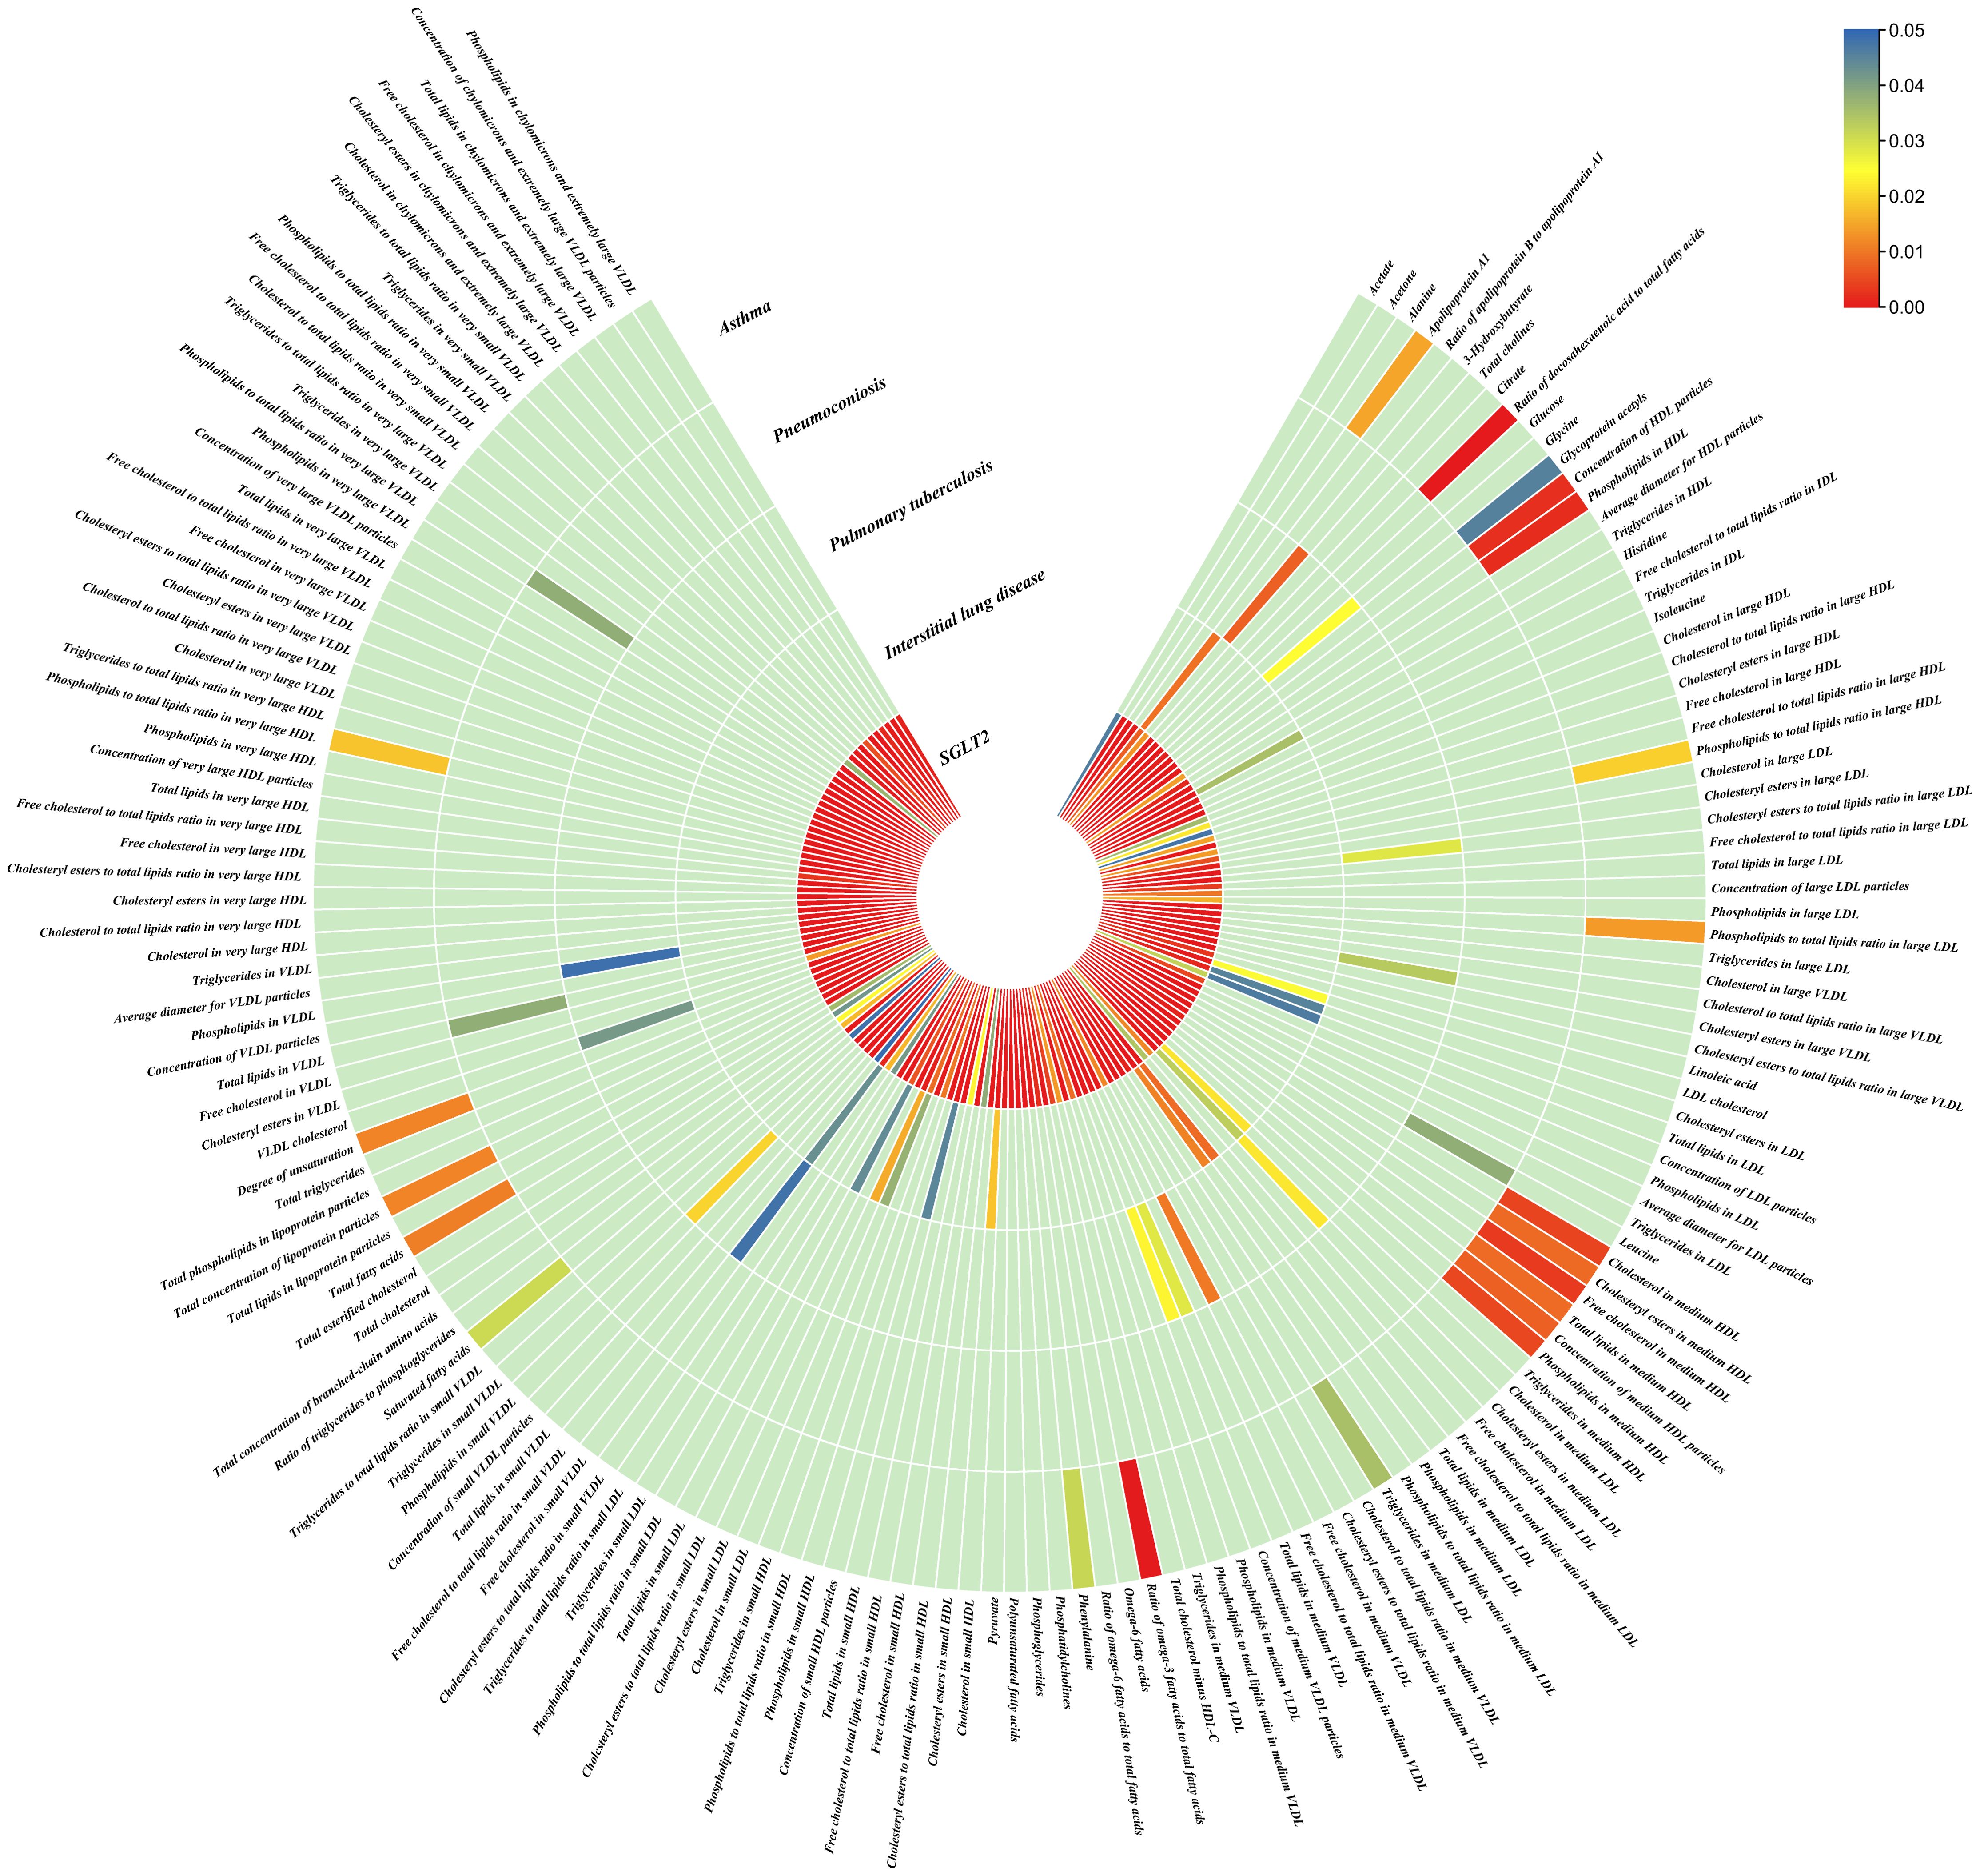
Figure 4. Causal effects of metabolites on interstitial lung disease, pulmonary tuberculosis, pneumoconiosis, and asthma. Circumferential thermograms showing causally linked metabolites (249 class) in interstitial lung disease, tuberculosis, pneumoconiosis and asthma. The circular thermogram is divided into five layers representing the P-value results of MR analysis of SGLT2i, interstitial lung disease, pulmonary tuberculosis, pneumoconiosis, and asthma with metabolites. The change in color of each cell indicates the magnitude of the P-value. The redder the color of each cell, the smaller the P value; the bluer the color of each cell, the larger the value.
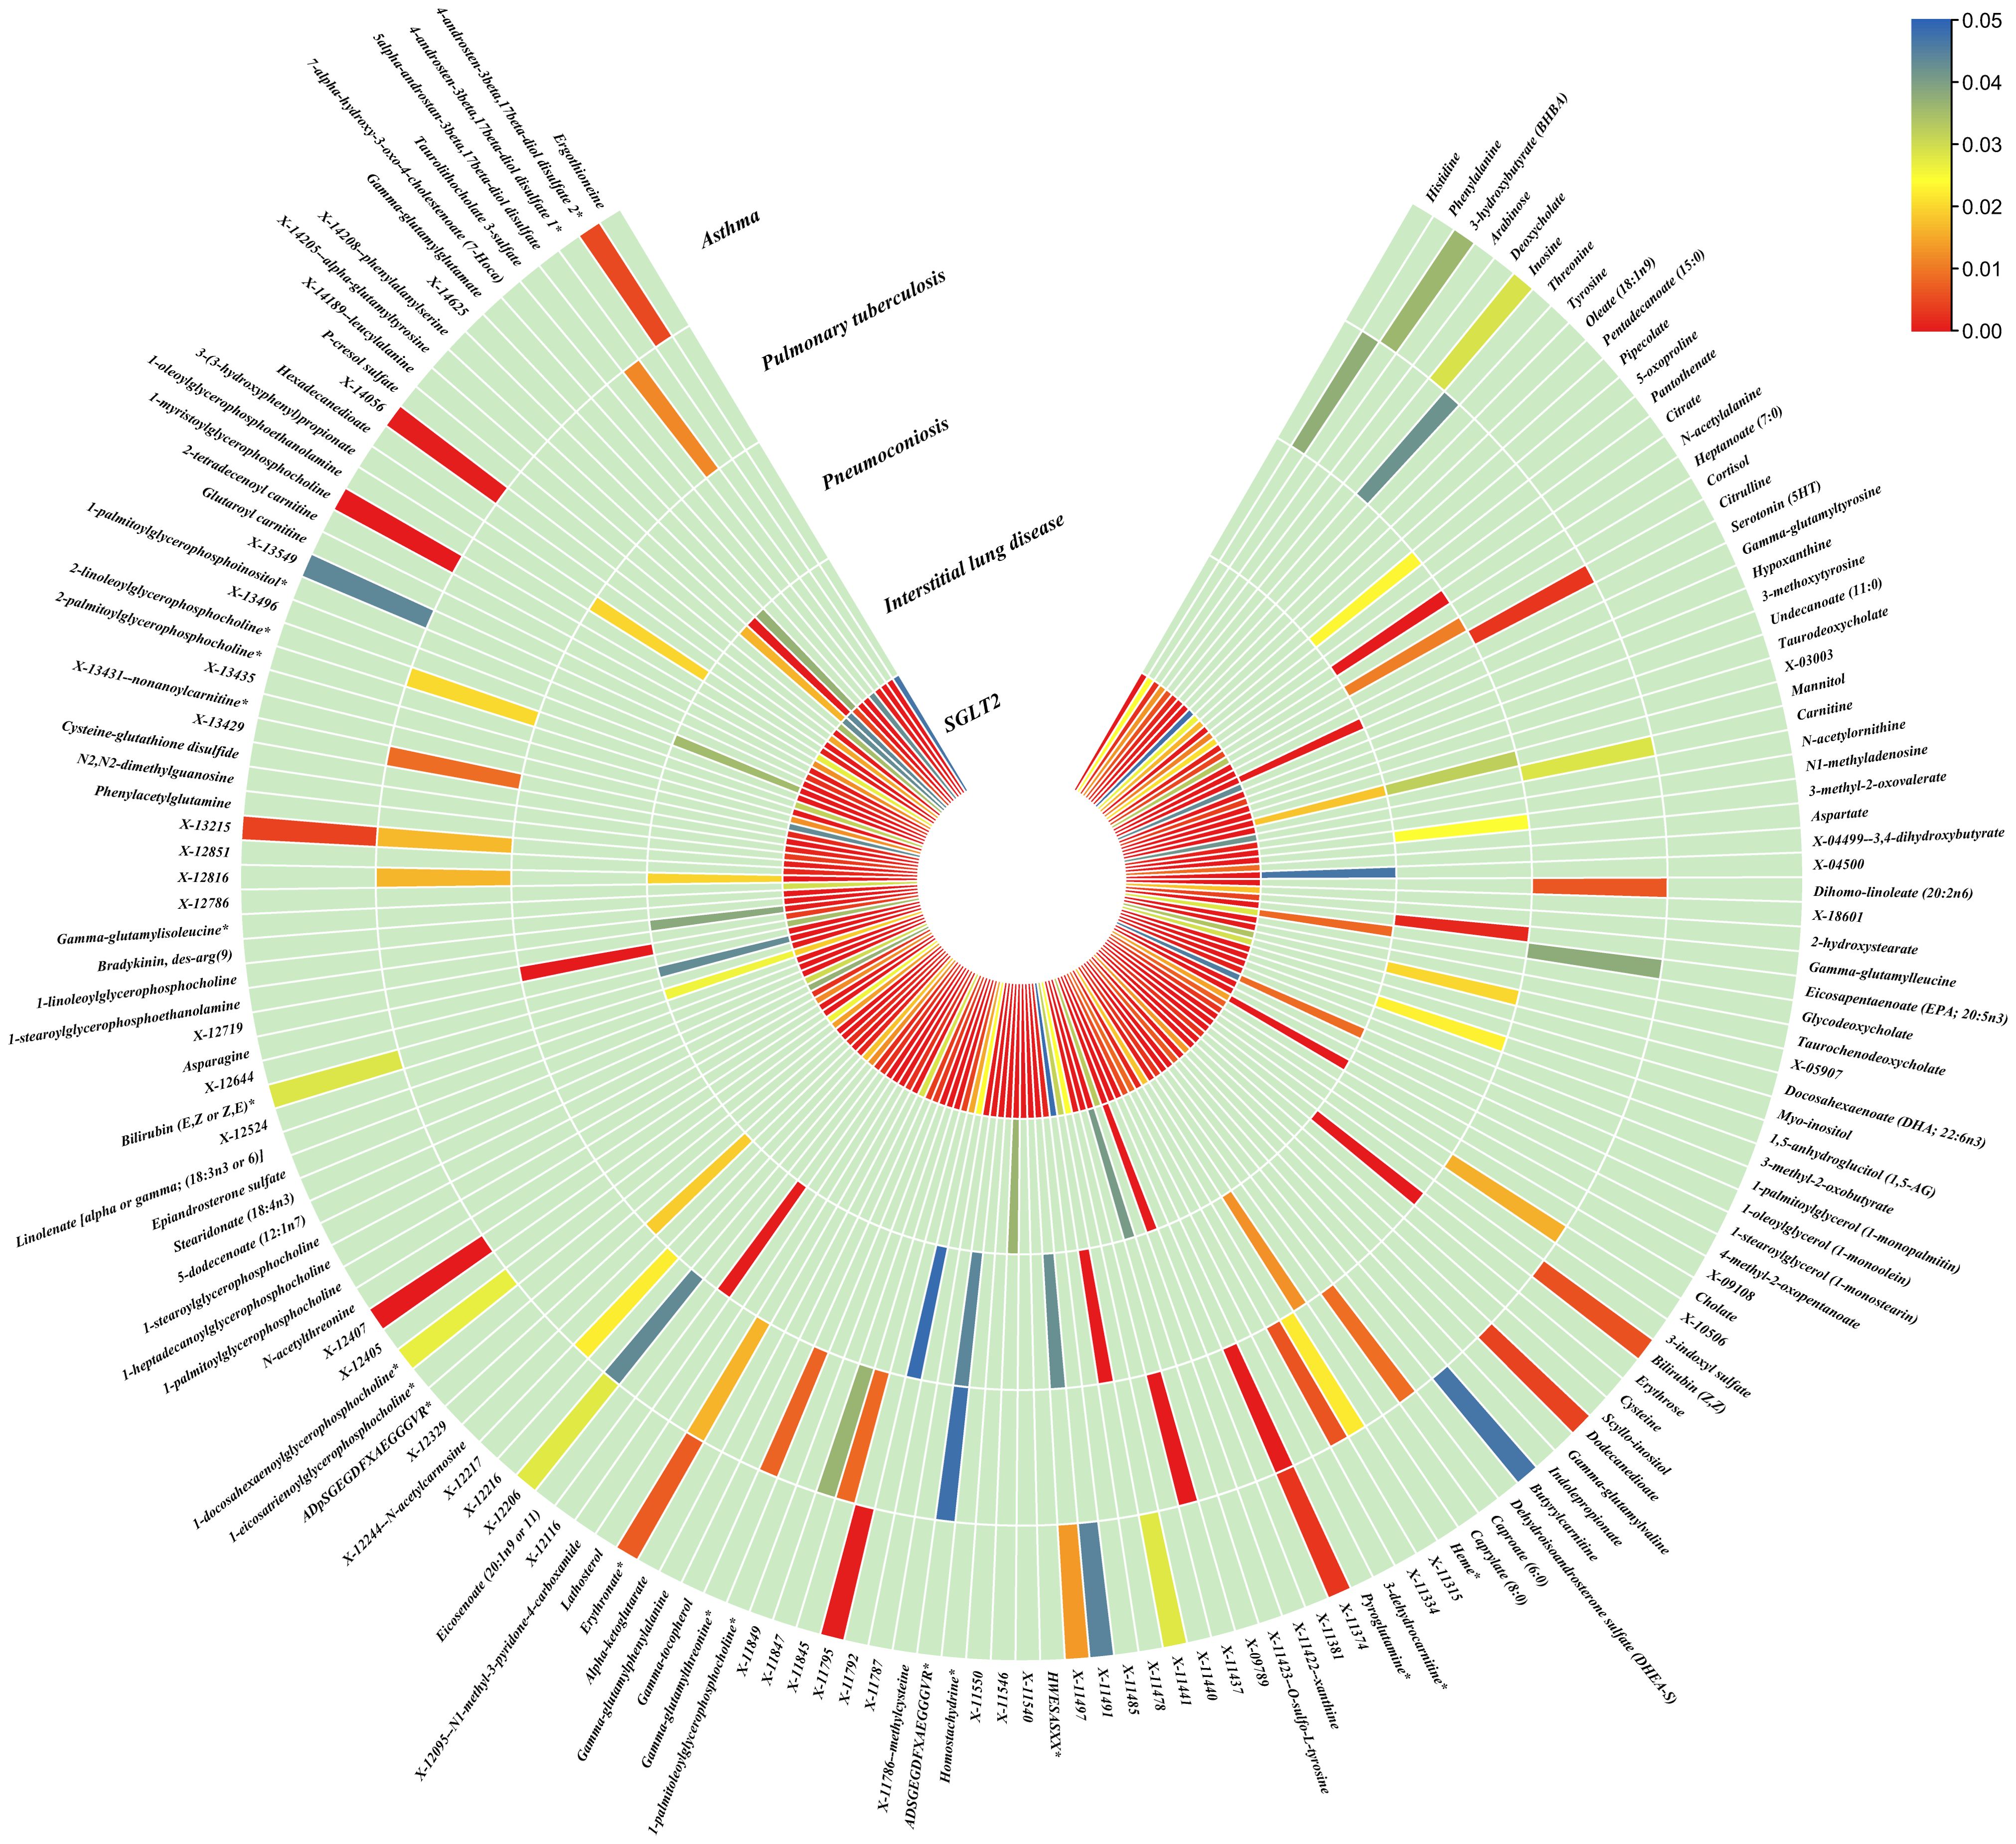
Figure 5. Causal effects of metabolites on interstitial lung disease, pulmonary tuberculosis, pneumoconiosis, and asthma. Circumferential thermograms showing causally linked metabolites (486 class) in interstitial lung disease, tuberculosis, pneumoconiosis and asthma. The circular thermogram is divided into five layers representing the P-value results of MR analysis of SGLT2i, interstitial lung disease, pulmonary tuberculosis, pneumoconiosis, and asthma with metabolites. The change in color of each cell indicates the magnitude of the P-value. The redder the color of each cell, the smaller the P value; the bluer the color of each cell, the larger the value.
3.4 Causal effects of gut microbiota and metabolites on interstitial lung disease, pulmonary tuberculosis, pneumoconiosis and asthmaWe performed causal estimation for Interstitial Lung Disease, Pulmonary Tuberculosis, Pneumoconiosis, and Asthma using 152 nominally significant gut microbiota, 173 out of 249 circulating metabolites and 220 out of 486 metabolites, respectively (Figures 3–5). Among the 211 types of gut microbiota included in the analysis, a total of 22 gut microbiota (representing 1 order, 2 families, 7 genera, and 7 species) were found to have a causal relationship with Interstitial Lung Disease; 6 gut microbiota (representing 1 order, 4 families, 1 genera) were found to have a causal relationship with Pneumoconiosis; 8 gut microbiota (representing 2 families, 6 genera) were found to have a causal relationship with Pulmonary Tuberculosis; 8 gut microbiota (representing 2 families, 6 genera) were found to have a causal relationship with Asthma.
As for metabolites, X-11422–xanthine, X-09108, X-14208–phenylalanylserine, Gamma-glutamyltyrosine were highly correlated with interstitial lung disease;X-12719, Erythrose, N-acetylalanine, X-11478, X-12116, and Gamma-glutamylleucine were highly correlated with pneumoconiosis;X-11437 and X-11374 were highly correlated with pulmonary tuberculosis;17 out of 21 circulating metabolites, 10 out of 20 metabolites showed significant correlations with asthma.
The all results were as follows:
Interstitial lung disease: The IVW method revealed nominally significant associations (p < 0.05) between 22 gut microbiota,15 out of 173 circulating metabolites, and 17 out of 220 metabolites with interstitial lung disease. After FDR correction, we observed 12 gut microbiota, 0 out of 15 circulating metabolites, 4 out of 17 metabolites with significant causative correlations to interstitial lung disease. Among gut microbiota, the family Enterobacteriaceae id.3469 (OR: 1.577, 95% CI: 1.423–1.749, p = 4.93×10⁻¹⁸, FDR = 3.70×10⁻¹⁶), the family Bacteroidaceae id.917 (OR: 1.174, 95% CI: 1.039–1.327, p =0.01, FDR =0.125), the genus Eisenbergiella id.11304 (OR: 1.275, 95% CI: 1.158–1.404, p = 7.50×10⁻⁷, FDR = 3.75×10⁻⁵), the genus Ruminococcaceae UCG010 id.11367 (OR: 0.822, 95% CI: 0.760–0.890, p = 1.37×10⁻⁶, FDR = 5.14×10⁻⁵), the genus Odoribacter id.952 (OR: 1.463, 95% CI: 1.242–1.723, p = 5.05×10⁻⁶, FDR = 1.52×10⁻⁴), the genus Christensenellaceae R 7group id.11283 (OR: 0.523, 95% CI: 0.352–0.776, p = 1.28×10⁻³, FDR =0.026), the genus Candidatus Soleaferrea id.11350 (OR: 1.222, 95% CI: 1.080–1.382, p = 1.41×10⁻³, FDR =0.026), the genus Sutterella id.2896 (OR: 0.602, 95% CI: 0.602–0.921, p = 6.54×10⁻³, FDR =0.109), the genus Ruminiclostridium9 id.11357 (OR: 0.846, 95% CI: 0.748–0.956, p =7.45×10⁻³, FDR =0.112), the genus Bacteroides id.918(OR: 1.174, 95% CI: 1.039–1.327,p=0.01, FDR=0.125), the order Enterobacteriales id.3468 (OR: 1.577, 95% CI: 1.423–1.749, p = 4.93×10⁻¹⁸, FDR = 3.70×10⁻¹⁶), and the phylum Euryarchaeota id.55 (OR: 1.270, 95% CI: 1.115–1.446, p = 3.05×10⁻⁴, FDR = 7.62×10⁻³) were strongly associated with interstitial lung disease. As for metabolites, X-11422–xanthine(OR: 0.327, 95% CI: 0.219–0.489, p = 5.11×10⁻⁸, FDR =1.06×10⁻⁵), X-09108 (OR: 0.190, 95% CI: 0.084–0.428, p = 6.34×10⁻⁵, FDR = 6.56×10⁻³), X-14208–phenylalanylserine(OR: 0.650, 95% CI: 0.519–0.813, p = 1.70×10⁻⁴, FDR = 0.012), Gamma-glutamyltyrosine(OR: 4.357, 95% CI: 1.948–9.748, p = 3.4×10⁻⁴, FDR =0.018) were highly correlated with interstitial lung disease.
Pneumoconiosis: The IVW method revealed nominally significant 11 gut microbiota, 3 out of 173 circulating metabolites and 18 out of 220 metabolites. After FDR correction, we observed 6 gut microbiota, 0 out of 3 circulating metabolites, 6 out of 18 metabolites with significant correlations to pneumoconiosis. Among gut microbiota, the genus Ruminococcaceae UCG010 id.11367 (OR: 0.256, 95% CI: 0.205–0.318, p = 4.77×10⁻³⁴, FDR =7.16×10⁻³²), the genus Peptococcus id.2037 (OR: 0.577, 95% CI: 0.386–0.865, p = 7.66×10⁻³, FDR =0.191),the family Enterobacteriaceae id.3469 (OR: 0.263, 95% CI: 0.111–0.628, p = 2.60×10⁻³, FDR =0.112), the family Family XI id.1936 (OR: 1.597, 95% CI: 1.172–2.175, p = 3.00×10⁻³, FDR =0.112), the family Alcaligenaceae id.2875 (OR: 0.568, 95% CI: 0.379–0.850, p = 5.95×10⁻³, FDR =0.179), and the order Enterobacteriales id.3468 (OR: 0.263, 95% CI: 0.111–0.628, p = 2.60×10⁻³, FDR =0.112) were associated with pneumoconiosis. As for metabolites, X-12719 (OR: 3.793, 95% CI: 3.061–4.702, p = 4.25×10⁻³⁴, FDR =8.79×10⁻³²), Erythrose(OR: 8.096, 95% CI: 3.470–18.885, p = 1.30×10⁻⁶, FDR =1.35×10⁻⁴), N-acetylalanine (OR: 8.096, 95% CI: 3.470–18.885, p = 2.89×10⁻⁵, FDR =1.20×10⁻³), X-11478 (OR: 0.410, 95% CI: 0.268–0.629, p = 4.27×10⁻⁵, FDR =2.21×10⁻³), X-12116 (OR: 0.126, 95% CI: 0.041–0.389, p = 3.18×10⁻⁴, FDR =0.013), and Gamma-glutamylleucine (OR: 41.849, 95% CI: 4.207–416.246, p = 1.44×10⁻³, FDR =0.049) were highly correlated with pneumoconiosis.
Pulmonary Tuberculosis: The nominally significant associations included 16 gut microbiota, 12 out of 173 circulating metabolites, 24 out of 220 metabolites. After FDR correction, we observed 8 gut microbiota, 0 out of 12 circulating metabolites, 2 out of 24 metabolites with significant correlations to pneumoconiosis. Among gut microbiota, the genus Sutterella id.2896 (OR: 0.666, 95% CI: 0.609–0.728, p = 7.23×10⁻¹⁹, FDR =1.08×10⁻¹⁶), the genus Rikenellaceae RC9 gut group id.11191(OR: 0.885, 95% CI: 0.826–0.949, p = 5.59×10⁻⁴, FDR =0.042), the genus Collinsella id.815 (OR: 1.353, 95% CI: 1.090–1.679, p = 6.07×10⁻³, FDR =0.152), genus Ruminococcus1 id.11373 (OR: 0.798, 95% CI: 0.679–0.937, p = 6.03×10⁻³, FDR =0.152), the genus Phascolarctobacterium id.2168(OR: 0.714, 95% CI: 0.555–0.918, p = 8.62×10⁻³, FDR =0.180), the genus Ruminococcaceae UCG002 id.11360 (OR: 0.842, 95% CI: 0.739–0.959, p = 9.58×10⁻³, FDR =0.180), the family Lactobacillaceae id.1836 (OR: 0.967, 95% CI: 0.945–0.990, p = 4.87×10⁻³, FDR =0.152), and the family Peptococcaceae id.2024 (OR: 0.786, 95% CI: 0.665–0.929, p = 4.73×10⁻³, FDR =0.152) were associated with pulmonary tuberculosis. As for metabolites, X-11437 (OR: 1.064, 95% CI: 1.036–1.094, p = 8.09×10⁻⁶, FDR =1.68×10⁻³), and X-11374 (OR: 0.541, 95% CI: 0.390–0.752, p = 2.55×10⁻⁴, FDR =0.026) were highly correlated with pulmonary tuberculosis.
Asthma: The nominally significant associations included 18 gut microbiota, 21 out of 173 circulating metabolites, 20 out of 220 metabolites. After FDR correction, we observed 8 gut microbiota, 17 out of 21 circulating metabolites, 10 out of 20 metabolites showed significant correlations with asthma. Among gut microbiota, the genus Barnesiella id.944(OR: 1.072, 95% CI: 1.036–1.110, p = 7.10×10⁻⁵,FDR=0.011),the genus Holdemanella id.11393(OR: 0.951, 95% CI: 0.925–0.978, p = 4.47×10⁻⁴,FDR=0.016), the genus Lachnospiraceae FCS020 group id.11314 (OR: 0.934, 95% CI: 0.900–0.970, p = 4.08×10⁻⁴,FDR=0.016), the genus Methanobrevibacter id.123 (OR: 0.979, 95% CI: 0.968–0.991, p = 5.42×10⁻⁴,FDR=0.016), the unknown genus id.2001 (OR: 0.944, 95% CI: 0.913–0.976, p = 6.64×10⁻⁴,FDR=0.017), the genus Bacteroides id.918(OR: 1.135, 95% CI: 1.045–1.233, p = 2.63×10⁻³,FDR=0.049), the family Bacteroidaceae id.917 (OR: 1.135, 95% CI: 1.045–1.233, p = 2.63×10⁻³,FDR=0.049), and the family Porphyromonadaceae id.943(OR: 0.850, 95% CI: 0.751–0.962, p = 0.01, FDR=0.169) were highly associated with asthma. As for metabolites, Degree of unsaturation (Fatty Acids) (OR: 1.109, 95% CI: 1.066–1.154, p = 3.19×10⁻⁷, FDR =5.53×10⁻⁵), Ratio of docosahexaenoic acid to total fatty acids (OR: 1.121, 95% CI: 1.071–1.173, p = 8.36×10⁻⁷,FDR =7.23×10⁻⁵), Ratio of omega-3 fatty acids to total fatty acids(OR: 1.079, 95% CI: 1.038–1.122, p = 1.31×10⁻⁴,FDR =7.58×10⁻³), Phospholipids in HDL(OR: 0.947, 95% CI: 0.915–0.980, p = 1.95×10⁻³,FDR = 0.078), Concentration of HDL particles (OR: 0.933, 95% CI: 0.892–0.975, p = 2.26×10⁻³,FDR = 0.078), Concentration of medium HDL particles (OR: 0.952, 95% CI: 0.919–0.987, p = 7.73×10⁻³,FDR = 0.138), Cholesteryl esters in medium HD(OR: 0.953, 95% CI: 0.919–0.988, p = 8.61×10⁻³,FDR = 0.138), Total lipids in medium HDL(OR: 0.952, 95% CI: 0.918–0.988, p = 8.78×10⁻³,FDR = 0.138), Total fatty acids(OR: 0.945, 95% CI: 0.905–0.987, p = 0.011,FDR = 0.152), Total concentration of lipoprotein particles(OR: 0.945, 95% CI: 0.905–0.987, p = 0.011,FDR = 0.152), Phospholipids to total lipids ratio in large LDL(OR: 1.048, 95% CI: 1.010–1.088, p = 0.014,FDR = 0.171), Apolipoprotein A1(OR: 0.951, 95% CI: 0.914–0.990, p = 0.015,FDR = 0.173), Phospholipids to total lipids ratio in large HDL(OR: 1.051, 95% CI: 1.008–0.990, p = 1.095,FDR = 0.199), X-12407(OR: 0.920, 95% CI: 0.897–0.944, p = 1.36×10⁻¹⁰,FDR =2.84×10⁻⁸), 1-myristoylglycerophosphocholine(OR: 1.113, 95% CI: 1.061–1.169, p = 1.45×10⁻⁵,FDR =1.50×10⁻³), X-14056 (OR: 1.354, 95% CI: 1.142–1.604, p = 4.70×10⁻⁴, FDR =0.025), X-11795(OR: 1.696, 95% CI: 1.260–2.282, p = 4.89×10⁻⁴, FDR =0.025), X-11374(OR: 1.171, 95% CI: 1.055–1.298, p = 2.89×10⁻³, FDR =0.120), X-13215(OR: 0.773, 95% CI: 0.647–0.922, p = 4.25×10⁻³, FDR =0.130), Dodecanedioate (OR: 1.218, 95% CI: 1.063–1.395, p = 4.45×10⁻³, FDR =0.130), 4-androsten-3beta,17beta-diol disulfate 2* (OR: 0.758, 95% CI: 0.624–0.920, p = 5.01×10⁻³, FDR =0.130), Bilirubin (Z,Z) (OR: 0.938, 95% CI: 0.896–0.982, p = 5.83×10⁻³, FDR =0.135), and Erythronate*(OR: 0.666, 95% CI: 0.495–0.895, p = 7.01×10⁻³, FDR =0.146) were highly associated with asthma.
In relation to asthma, the Ratio of docosahexaenoic acid to total fatty acids and the Degree of unsaturation exhibited evidence of heterogeneity in Cochran’s Q test. MR-PRESSO identified outliers, providing corrected values after observing anomalies. The remaining results showed no evidence of heterogeneity in Cochran’s Q test, and MR-PRESSO did not detect any significant horizontal pleiotropy. (Supplementary Tables S1–3).
3.5 Mediation MRAfter screening for potential intermediate factors, we identified a total of 4 gut microbiota and 4 metabolites that met our selection criteria.
Interstitial lung disease: We identified an indirect effect of SGLT2 inhibition on interstitial lung disease through the family Enterobacteriaceae id.3469 (OR: 0.499, 95% CI: 0.396–0.629, P = 3.71×10⁻⁹), and the order Enterobacteriales id.3468(OR: 0.499, 95% CI: 0.396–0.629, P = 3.71×10⁻⁹), with a mediated proportion of 10.87% (95% CI: 0.079–0.138, P = 2.08×10⁻⁴) and 10.87% (95% CI: 0.079–0.138, P = 2.08×10⁻⁴) of the total effect.
Pneumoconiosis: We identified an indirect effect of SGLT2 inhibition on pneumoconiosis through the family Alcaligenaceae id.2875 (OR: 0.401, 95% CI: 0.249–0.646, P = 1.71×10⁻⁴) and X-12719 (OR: 0.701, 95% CI: 0.503–0.975, P =0.035). The mediated proportion of the total effect was 8.10% (95% CI: 0.042–0.120, P =0.039) and 7.43% (95% CI: 0.050–0.099, P = 2.65×10⁻³), respectively.
Pulmonary tuberculosis: We found a mediated effect of SGLT2 inhibition on pulmonary tuberculosis through the involvement of the genus Phascolarctobacterium id.2168 (OR: 0.170, 95% CI: 0.123–0.236, P = 1.57×10⁻²⁶). This mediation contributed significantly, accounting for 46.94% (95% CI: 0.236–0.703, P = 0.045) of the total effect.
Asthma: We identified an indirect effect of SGLT2 inhibition on asthma through the Degree of unsaturation (Fatty Acids) (OR: 0.762, 95% CI: 0.692–0.839, P = 2.75×10⁻⁸), Ratio of docosahexaenoic acid to total fatty acids (OR: 0.809, 95% CI: 0.734–0.891, P = 1.69×10⁻⁵),4-androsten-3beta,17beta-diol disulfate 2*(OR: 0.663, 95% CI: 0.540–0.814, P = 8.60×10⁻⁵),with a mediated proportion of 8.10% (95% CI: 0.042–0.119, P = 0.036), 6.96% (95% CI: 0.039–0.101, P = 0.025), 32.71% (95% CI: 0.181–0.473, P = 0.025), of the total effect.
3.6 Metabolic pathway analysisAfter analyzing the associated metabolites, we identified a total of 16 metabolic pathways that are integrated with SGLT2 and associated with pulmonary disease (Figure 6). There are four metabolic pathways associated with interstitial lung disease, with the most significant pathway being “Caffeine metabolism” (p=7.83×10⁻³). For pneumoconiosis, the most significant pathway among the three identified is “Glutathione metabolism” (p =1.67×10⁻²). In the case of pulmonary tuberculosis, among the eight metabolic pathways, the most significant one is “Aminoacyl-tRNA biosynthesis” (p = 1.07×10⁻³). Finally, for asthma, “Glycerophospholipid metabolism” (p=3.87×10⁻²) emerges as the only statistically significant. In addition, we noted a shared metabolic pathway, “Biosynthesis of unsaturated fatty acids”, between interstitial lung disease and pulmonary tuberculosis. Moreover, “Fructose and mannose metabolism” emerged as a common metabolic pathway between interstitial lung disease and pneumoconiosis, while “Phenylalanine metabolism” was identified as a shared pathway between pneumoconiosis and pulmonary tuberculosis (Supplementary Table S4).
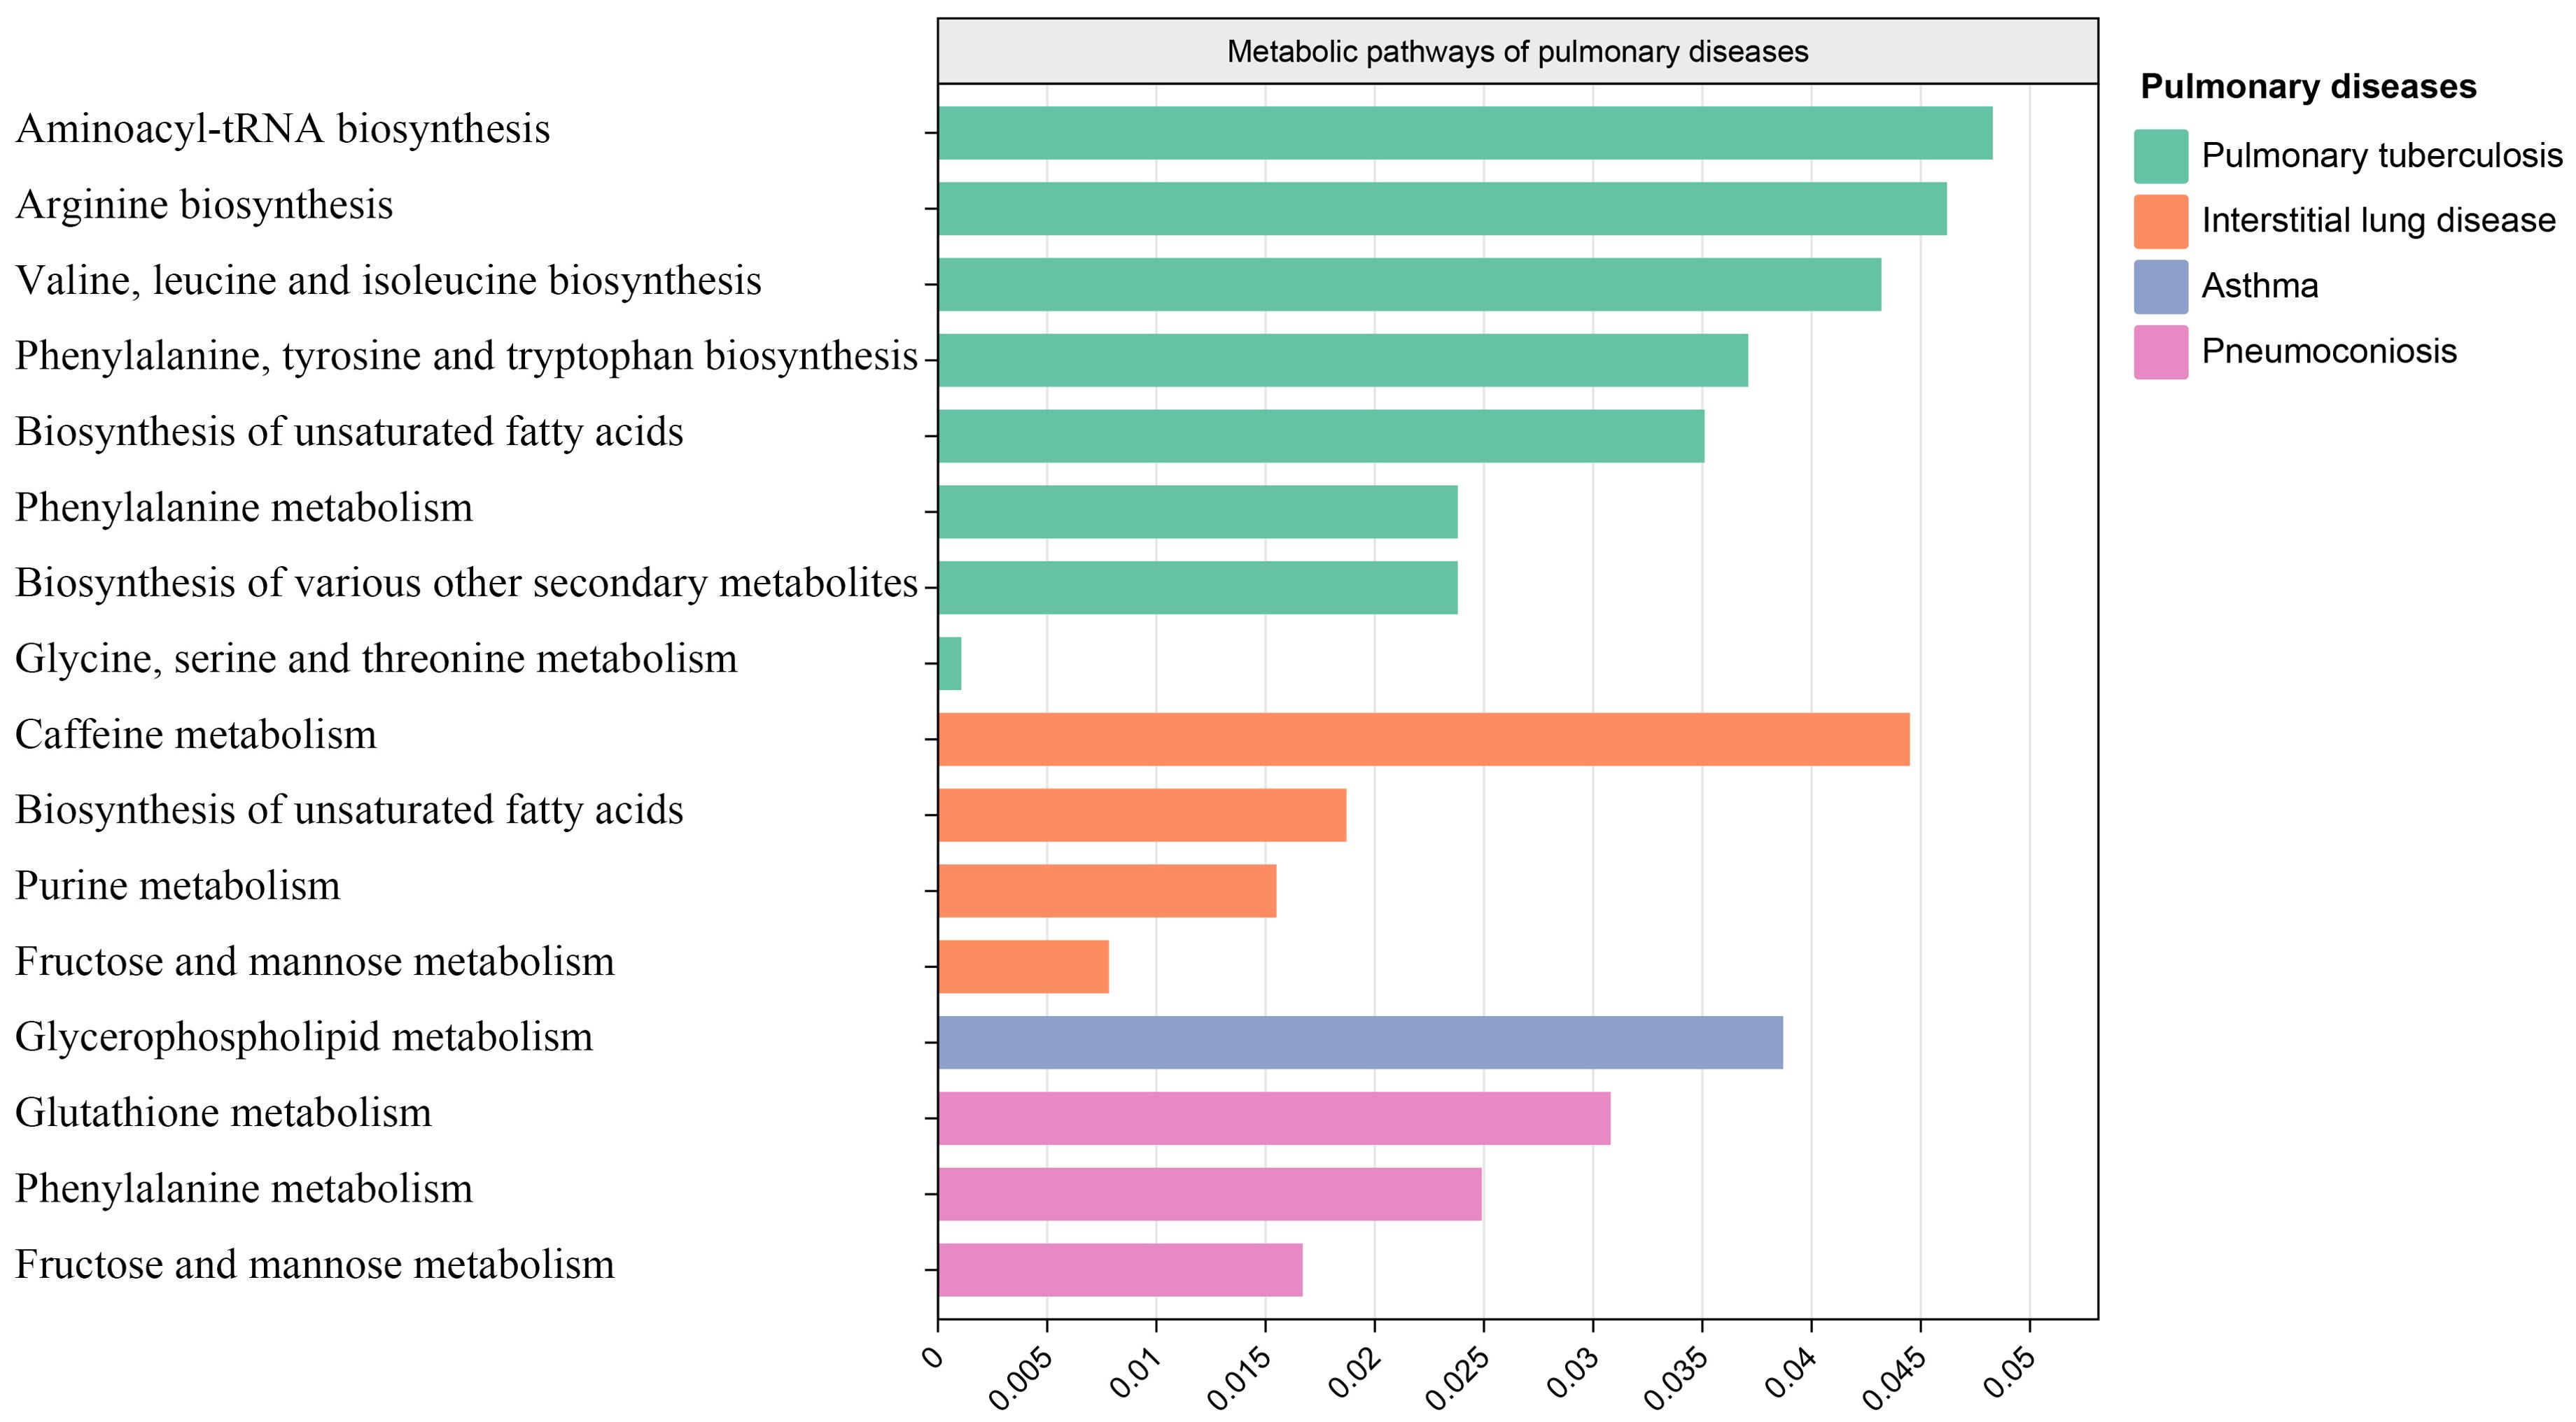
Figure 6. Metabolic pathways. Bar graph showing metabolic pathways enriched for metabolites causally associated with interstitial lung disease, tuberculosis, pneumoconiosis, asthma.
3.7 Fine mapping and magma analysisWe used the instrumental variable SNP for mediating metabolites and bacteriophages for fine mapping, leading to extensive identification of relevant target genes.16, 36, 63, and 1165 genes were mapped by FUMA in Interstitial lung disease, Pulmonary tuberculosis, Pneumoconiosis, and Asthma (Supplementary Table S5). Magma analysis then helped us to further identify the distribution of genes in tissues, and we found that in Pulmonary tuberculosis the differential genes mapped significantly in skin tissues; in Interstitial lung disease the differential genes mapped significantly in Heart tissues; and in Asthma the differential genes mapped significantly in Liver tissues. In Asthma, the differential gene mapped significantly in Liver tissue (Figure 7).
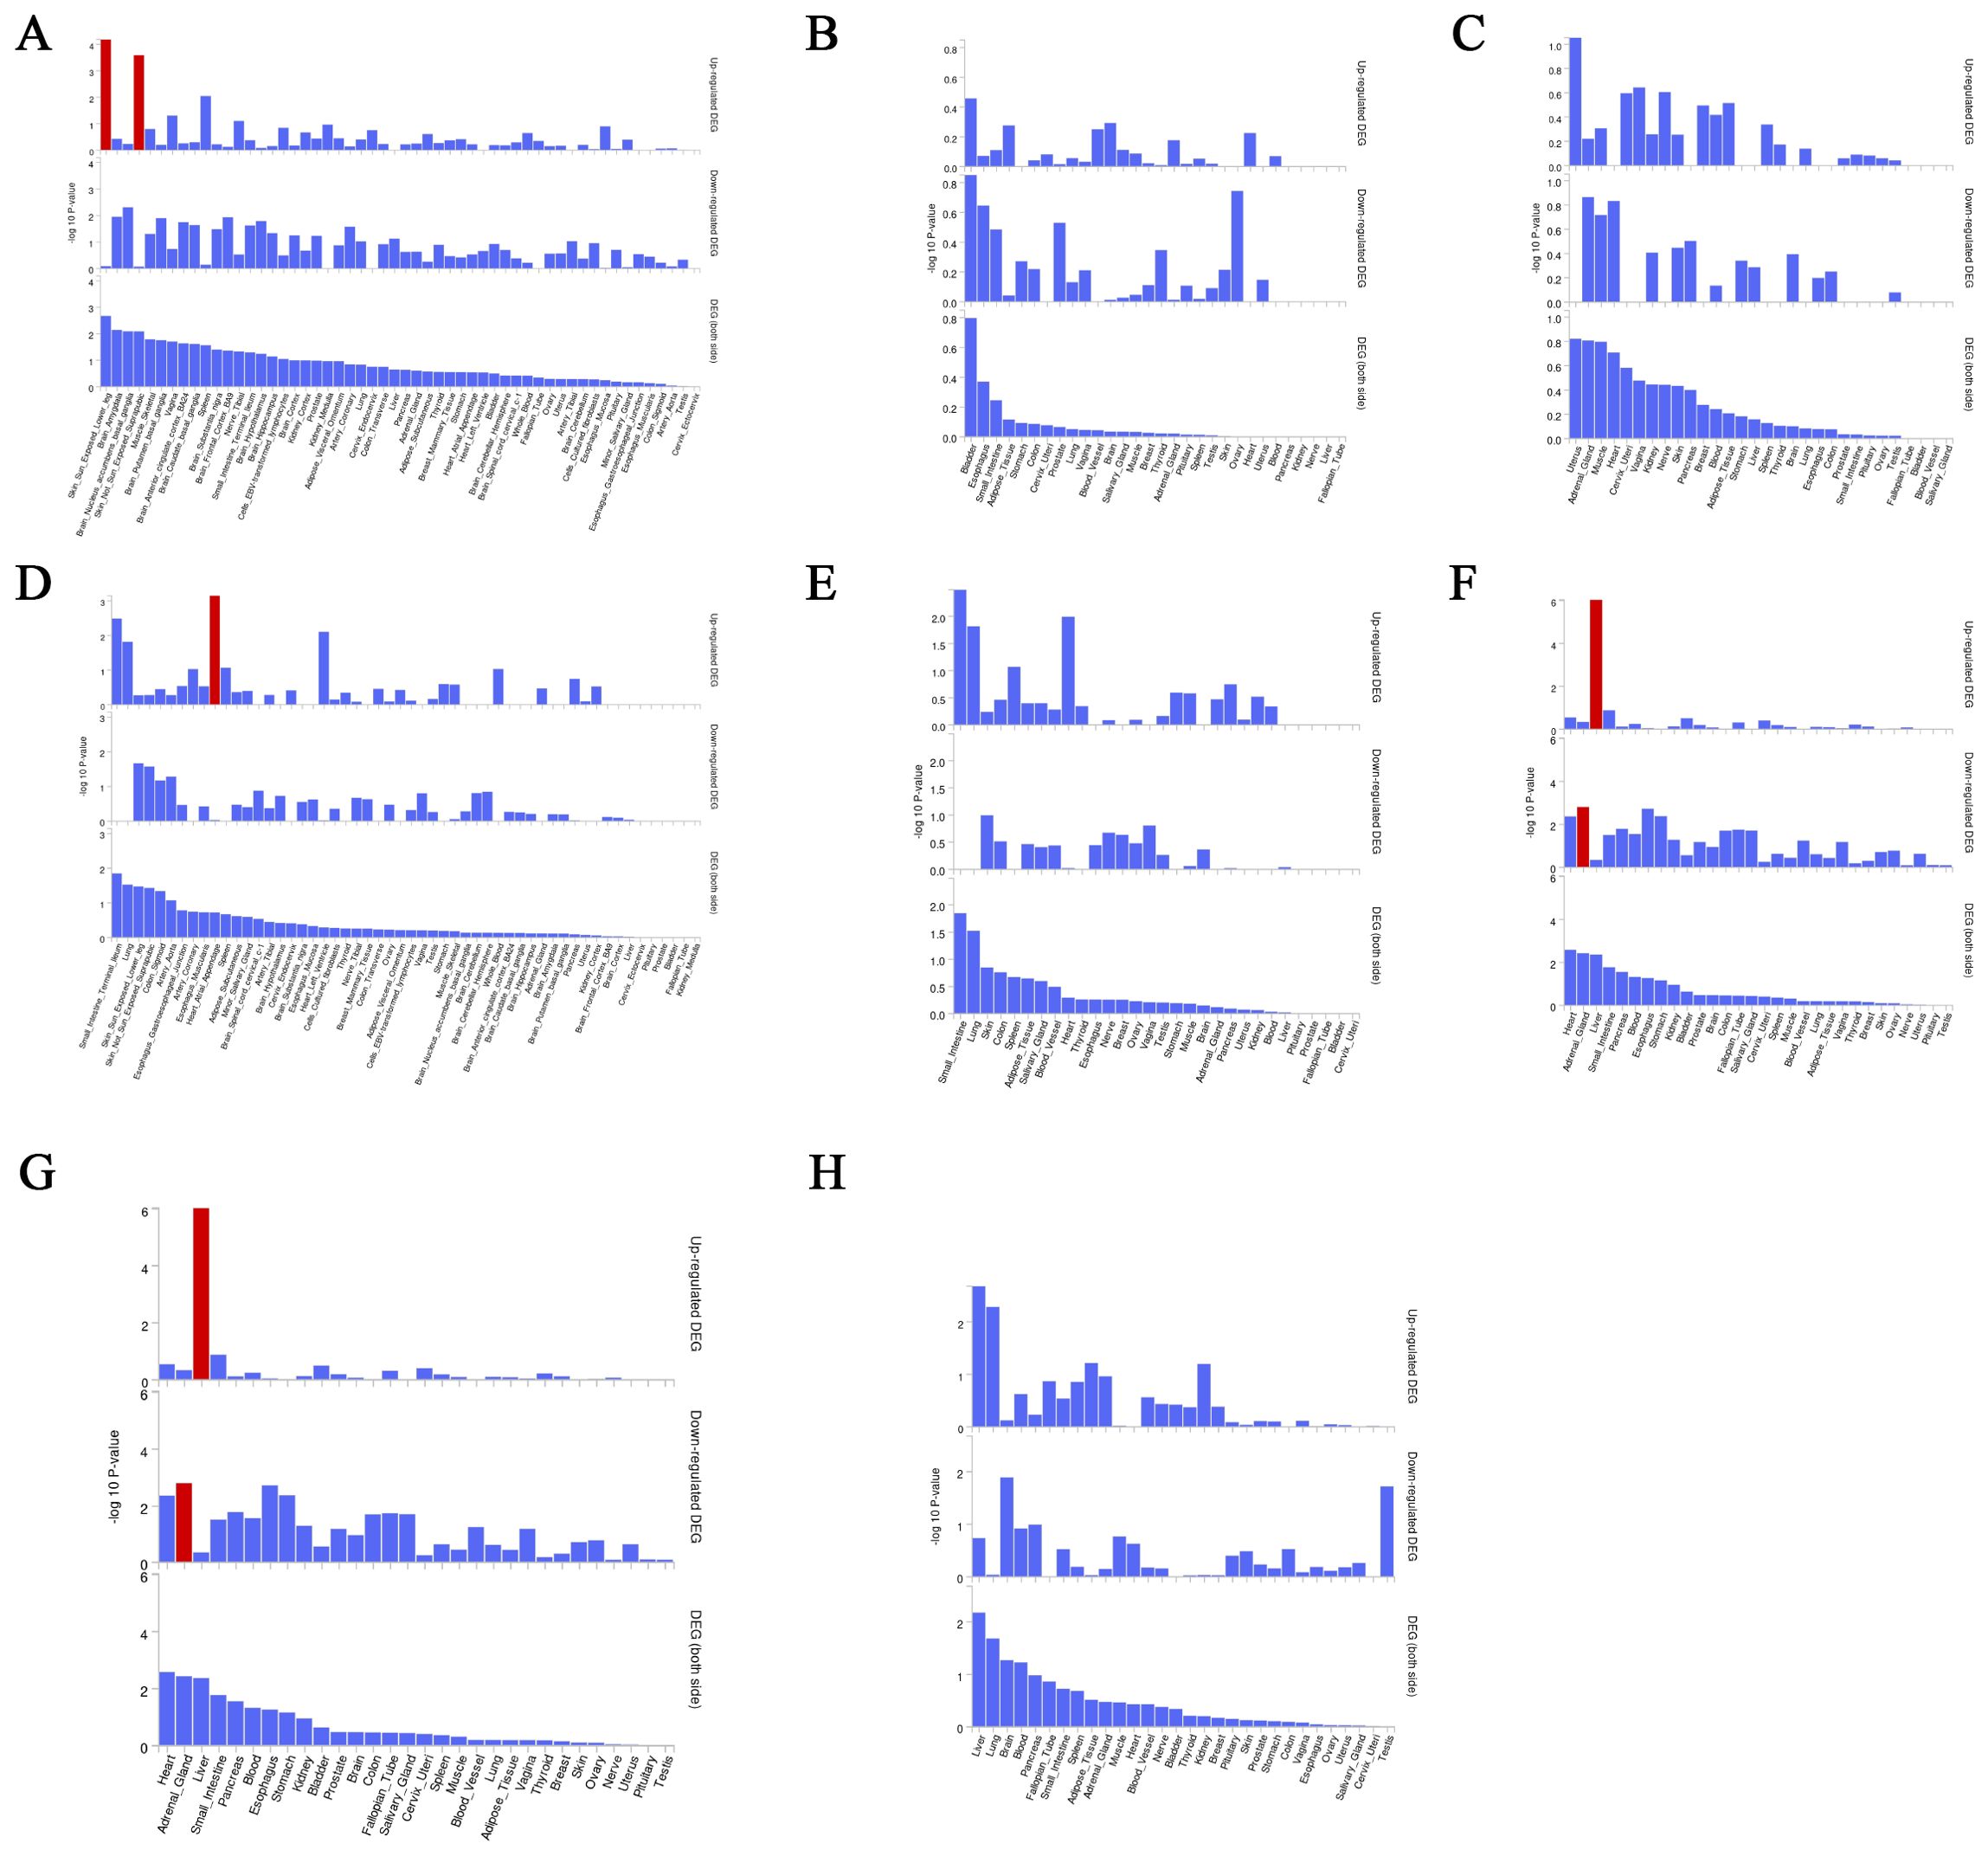
Figure 7. Magma analysis annotates the distribution of finely mapped DEG genes in tissues. Using the result of gene analysis (gene level p-value), (competitive) gene-set analysis is performed with default parameters with MAGMA v1.6. (A) Distribution of mapped genes in tissues of genus Phascolarctobacterium (B) Distribution of mapped genes in tissues of family Alcaligenaceae (C) Distribution of mapped genes in tissues of X-12719 (D) Distribution of mapped genes in tissues of family Enterobacteriaceae (E) Distribution of mapped genes in tissues of order Enterobacteriales (F) Distribution of mapped genes in tissues of Ratio of docosahexaenoic acid to total fatty acids (G) Distribution of mapped genes in tissues of Degree of unsaturation (H) Distribution of mapped genes in tissues of 4-androsten-3beta,17beta-diol disulfate 2.
3.8 Multi-omics analysis to identify target genesProteins are important forms of function in the body. We used the cis-pQTL for analysis to identify positive proteins that were causally associated with outcomes (Supplementary Table S6). We found 71,66 and 71 causally associated proteins, but no overlap with the fine mapping results in Pulmonary tuberculosis, Pneumoconiosis and Interstitial lung disease; we found 125 causally associated proteins, with 6 overlapping proteins obtained from the fine mapping results in Asthma, and the results of the overlapping proteins are shown in Table 2. Proteins TCN2,TNFRSF1B and C10orf54 were positively associated with the development of asthma (B>0); proteins PDGFD,INHBC and ANXA7 were negatively associated with the development of asthma (B<0).

Table 2. Co-evidence of fine mapping and multi-omics.
3.9 Multiple effect evaluation of SGLT2 inhibitors across PheWAS analysisPheWAS analyses were performed using instrumental variables for SGLT2 inhibitors to determine their possible side effects and thus assess their effects more fully. After FDR correction, we found that SGLT2 inhibitors were associated with Portal hypertension (B<0, Pval=2.80E-18), Uterine leiomyoma (B>0, Pval=3.03E-13), Glaucoma (B<0, Pval=1.25E-09), Rheumatism, unspecified and fibrositis (B>0, Pval=1.94E-16) and Secondary malignant neoplasm of digestive systems (B>0, Pval=1.08E-15) had significant causal associations (Figure 8, Supplementary Table S7).
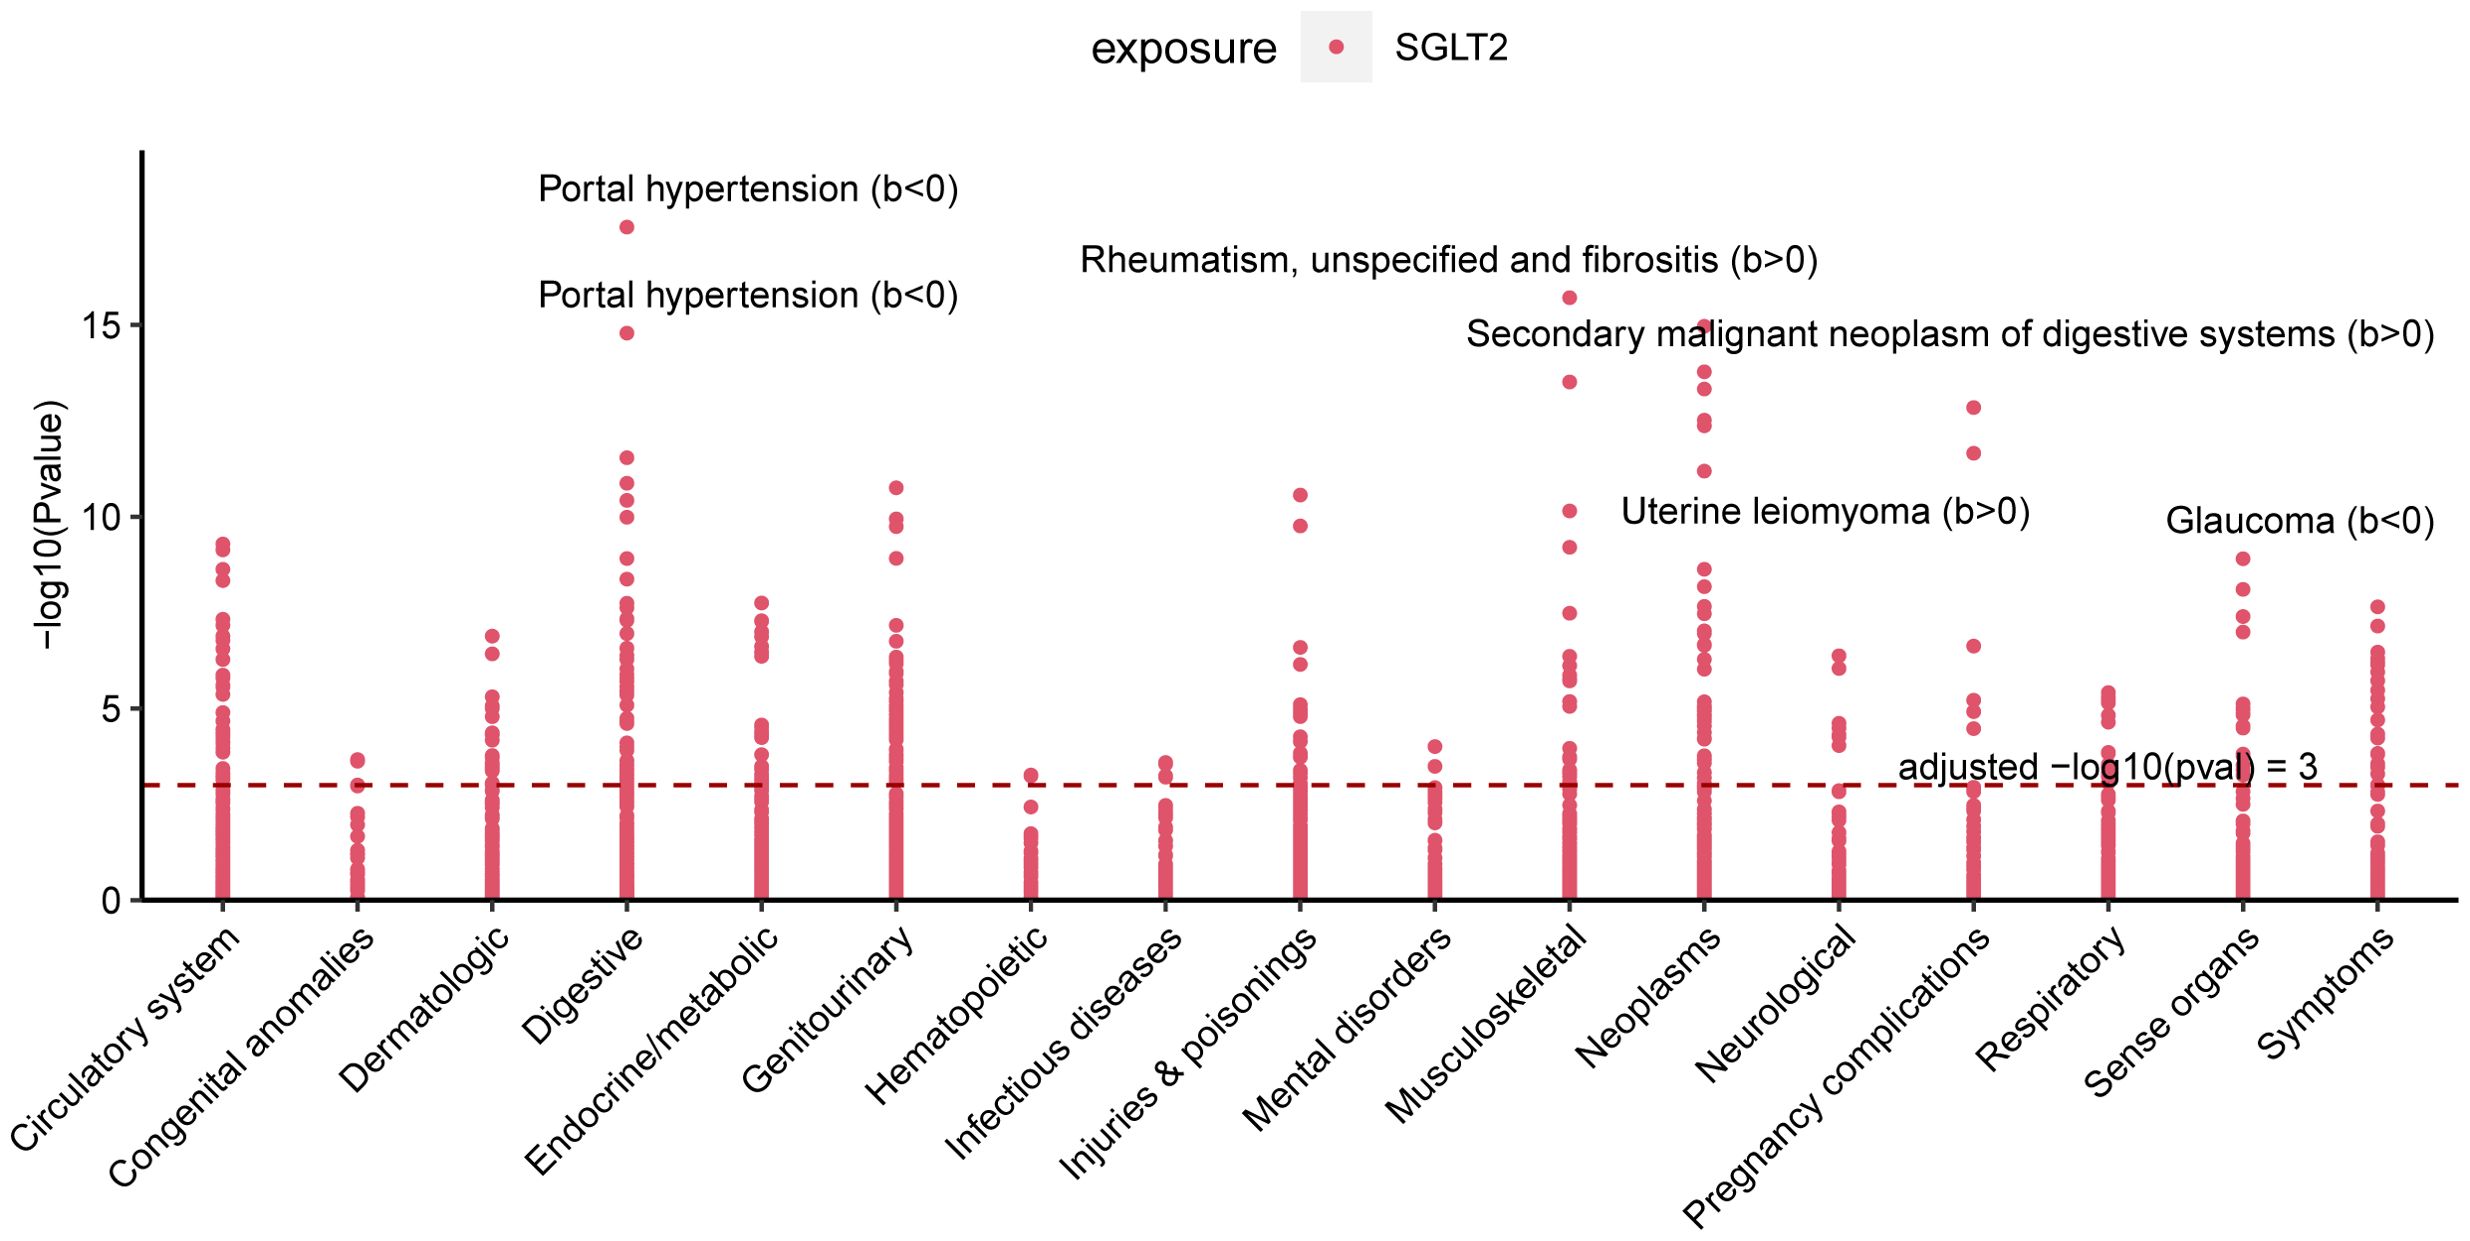
Figure 8. Multiple Effect Evaluation of SGLT2 Inhibitors Across PheWAS analysis. Manhattan plot showing phenotypic traits causally associated with instrumental variables for SGLT2. Horizontal coordinates indicate the categorization of phenotypes and vertical coordinates represent -log10 (Pvalue).
4 DiscussionOver the past few decades, the rapid advancements in gut microbiota and metabolome studies have greatly enhanced our understanding of diseases. The discovery of the gut-lung axis and biomarkers such as metabolites has had a profound impact on the treatment and early diagnosis of diseases (Budden et al., 2017; Dang and Marsland, 2019). Our study is the first to comprehensively identify the lung-gut axis role of SGLT2 using a fine-mapping-based multi-omics research approach. We explored the potential mediating role of the gut microbiota and metabolites by examining the effects of SGLT2 inhibition on the gut microbiota and metabolites and their impact on lung-related diseases, and performed a multi-omics analysis to identify target genes that drive disease (Figure 9). In addition, our analyses identified 16 important metabolic pathways strongly associated with SGLT2 inhibition and the four lung diseases studied (interstitial lung disease, pneumoconiosis, tuberculosis, and asthma), and comprehensively assessed the possible side effects of SGLT2 inhibitors.
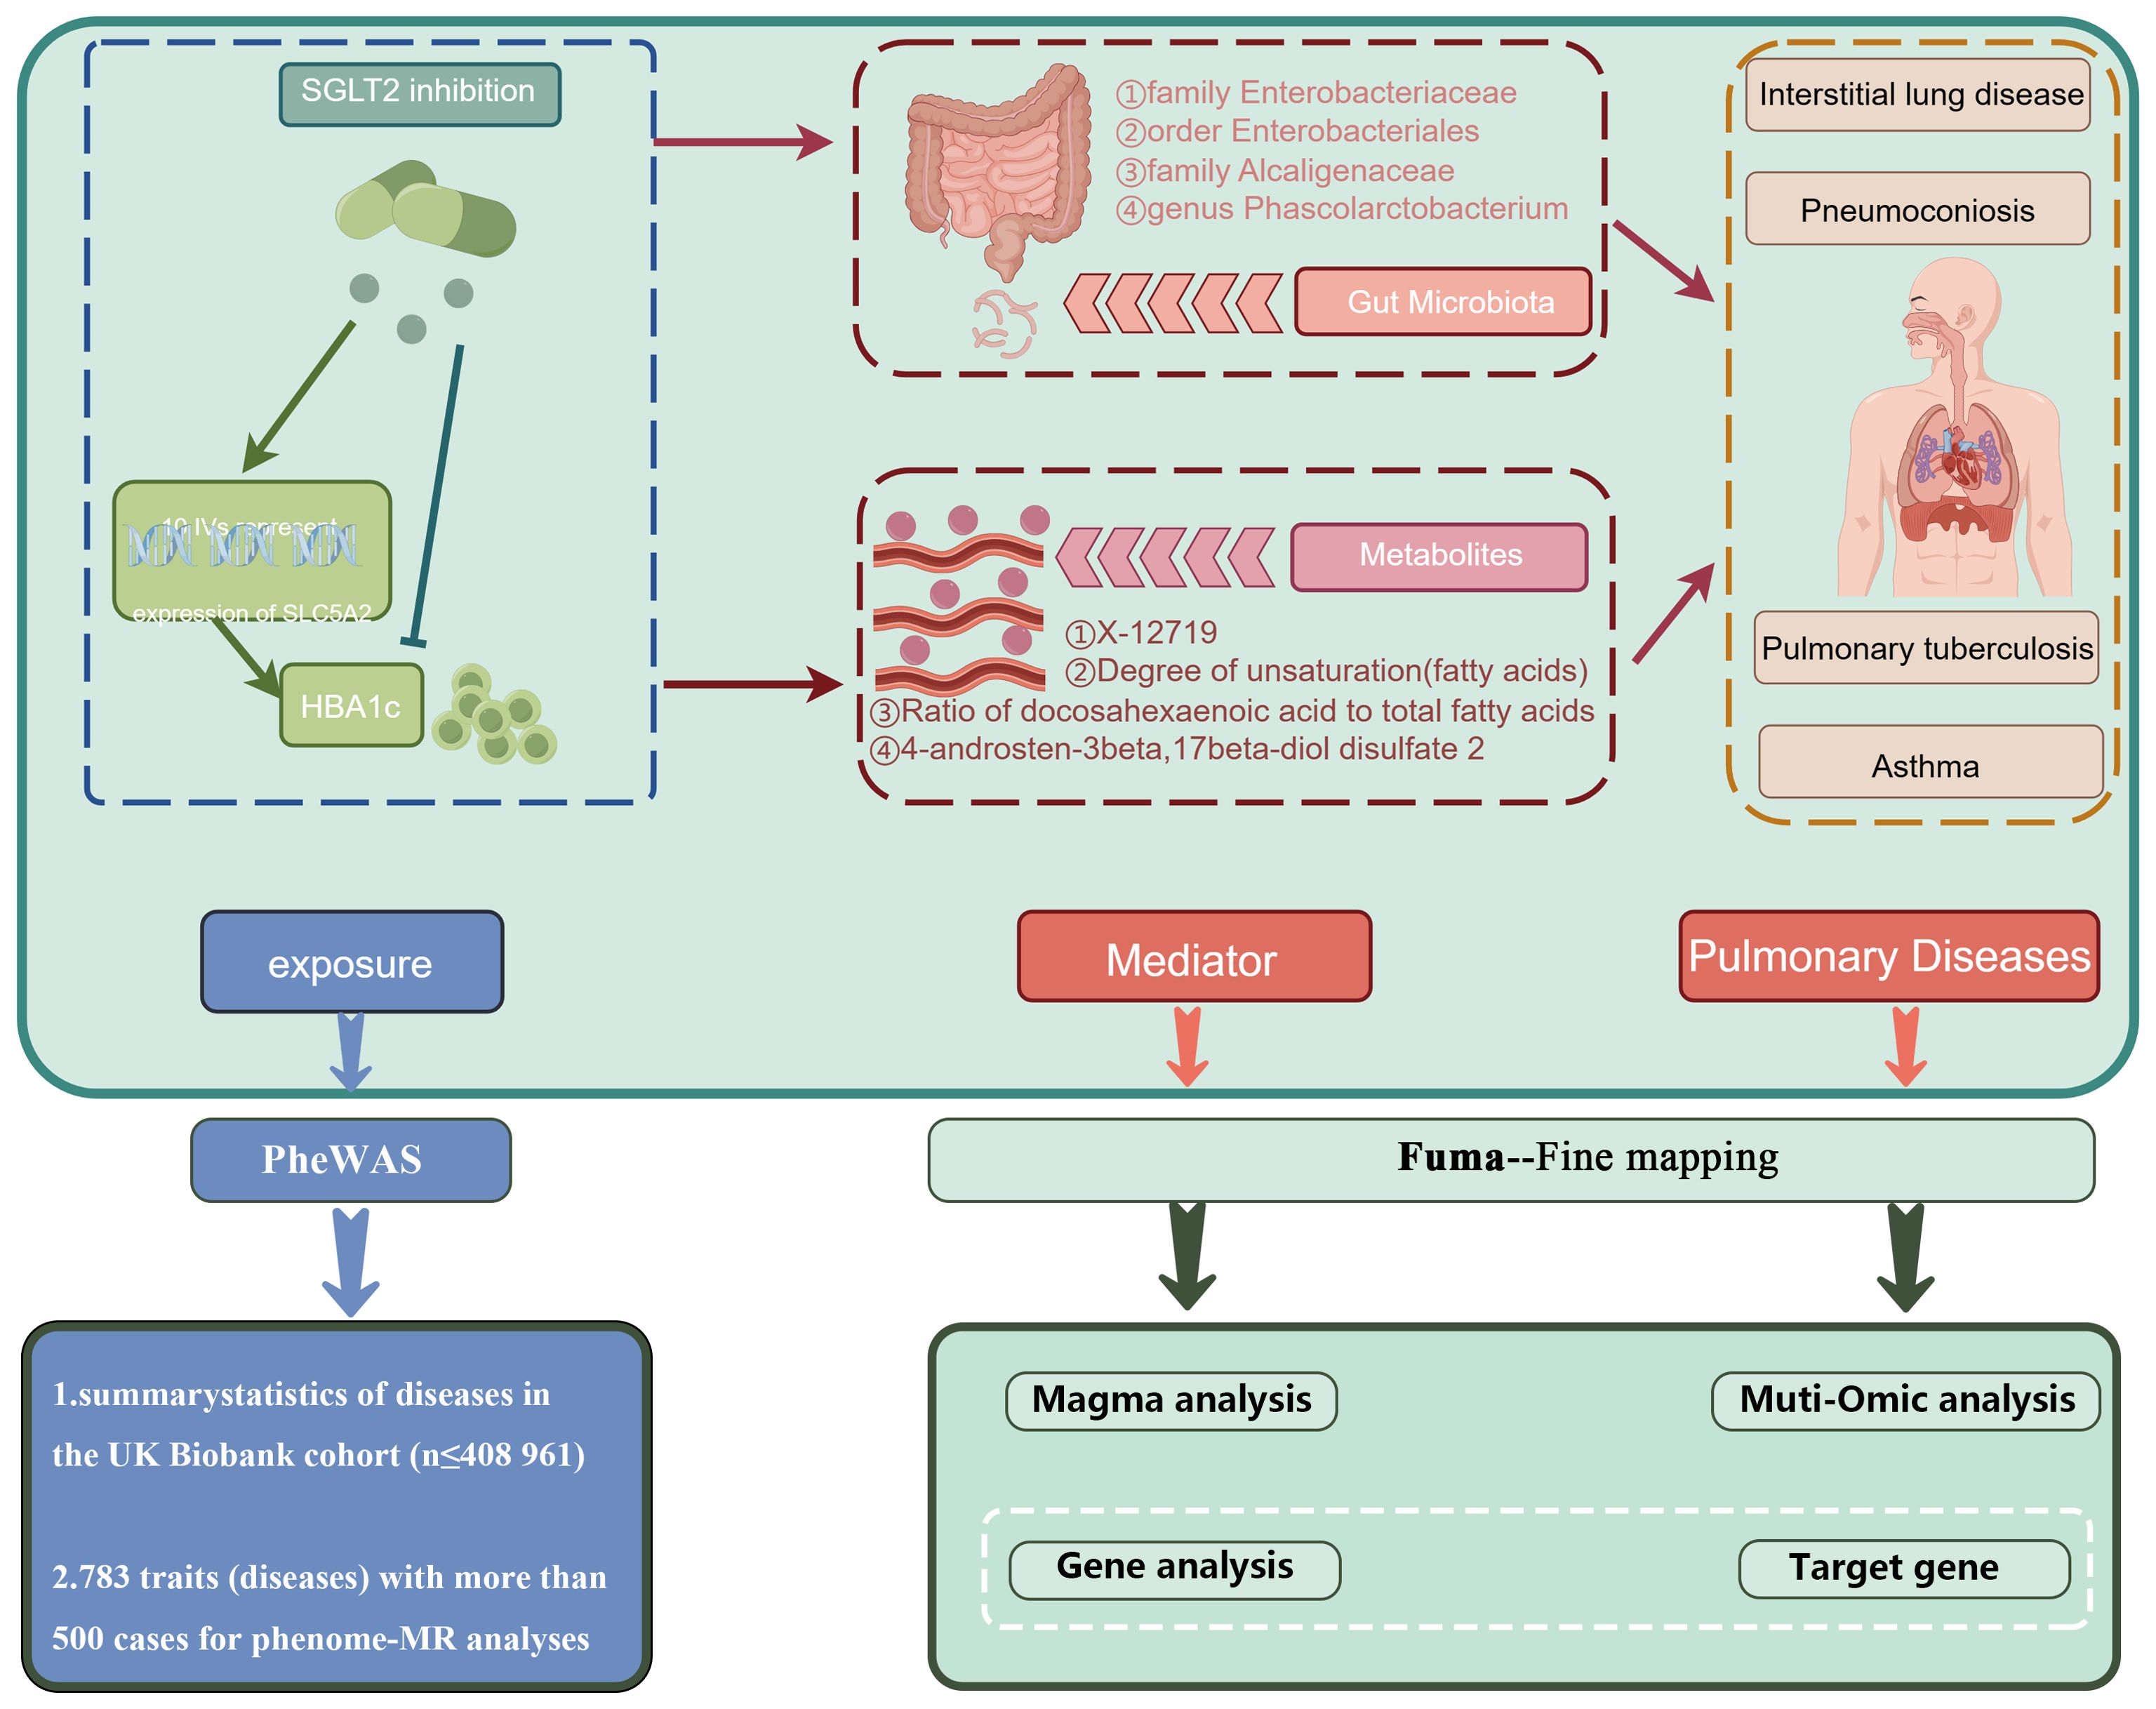
Figure 9. Mechanism role diagram. Mechanisms of SGLT2i action in lung disease inferred herein.
4.1 The relationship between SGLT2 inhibition and ten pulmonary diseasesSome previous clinical trials, cohort studies, and retrospective analyses have investigated the role of SGLT2 inhibition in pulmonary diseases. They found that SGLT2 inhibitors may reduce the risk of asthma, pneumonia, exacerbations in patients with chronic obstructive pulmonary disease, improve pulmonary arterial hypertension in patients with interstitial lung disease, and serve as a therapeutic target for early-stage lung adenocarcinoma (Scafoglio et al., 2018; Qiu et al., 2021; Pradhan et al., 2022; Wu et al., 2022). However, there is still controversy surrounding their results. Moreover, there remains a paucity of research on the correlation between SGLT2 inhibitors and pneumoconiosis, pulmonary tuberculosis. Our MR study results affirm the risk reduction in asthma and interstitial lung disease, supporting the aforementioned associations. However, no favorable outcomes were discerned for COPD, pneumonia, and lung cancer. The precise mechanisms underlying the protective effects of SGLT2 inhibitors against respiratory diseases have not been fully elucidated thus far. In a murine model of asthma, it was observed that SGLT2 inhibitors could reduce airway hyperreactivity, ameliorate airway inflammation and remodeling. In the microscopic structure of the lungs, they alleviated thickening of the bronchiolar epithelium, hyperplasia of goblet cells, fibrosis, and hypertrophy of smooth muscles (Hussein et al., 2023). Additionally, SGLT2 inhibitors were found to possess anti-pulmonary fibrosis effects (Park et al., 2019). Finally, our study results also revealed a decreased risk of pneumoconiosis and pulmonary tuberculosis with SGLT2 inhibition. However, further validation is required in future research.
4.2 The relationship between SGLT2 inhibition and gut microbiota, as well as circulating metabolitesIn animal models, the significant SGLT2 inhibitors, dapagliflozin, and empagliflozin, have been observed to induce changes in the gut microbiota, impacting the progression of various diseases. Empagliflozin, for instance, reduces lipopolysaccharide-producing bacteria like Oscillibacter while increasing short-chain fatty acid-producing bacteria such as Bacteroid and Odoribacter, thereby contributing to the amelioration of diabetic nephropathy (Deng et al., 2022). Similarly, dapagliflozin is associated with improvements in arterial stiffness, vascular smooth muscle function, and alterations in the composition of gut microbiota, including Actinobacteria, Bacteroidetes, Firmicutes, Verrucomicrobia and Proteobacteria (Lee et al., 2018). However, in human studies, no significant changes in the gut microbiota composition were observed in fecal samples after 12 weeks of treatment with dapagliflozin (van Bommel et al., 2020). These studies might be affected by remaining confounding factors, and the precise alterations in the gut microbiota induced by SGLT2 inhibitors remain unclear. Hence, our MR study delved into the relationship between SGLT2 inhibition and the gut microbiota, uncovering modifications in 152 gut microbiota. Further research is needed to elucidate the connections between these microbiota changes and various diseases.
The impact of SGLT2 inhibitors on metabolites has been observed in early studies. The SGLT2 inhibitors were initially discovered to induce changes in lipid metabolites. In diabetic mouse models, the use of canagliflozin was associated with a reduction in circulating cholesterol (Osataphan et al., 2019), and treating high-fat-fed mice with dapagliflozin inhibited lipid accumulation (Sato et al., 2022). In a meta-analysis study, SGLT2 inhibitors have been shown to alter levels of total cholesterol, low-density lipoprotein cholesterol, non-high-density lipoprotein cholesterol, high-density lipoprotein cholesterol, and triglycerides (Sánchez-García et al., 2020). The impact of SGLT2 inhibition extends to other blood metabolites, as evidenced by a study measuring plasma metabolite changes in patients treated with empagliflozin, revealing significant alterations in the tricarboxylic acid cycle, unsaturated fatty acids, butyric acid, propionic acid, alanine, aspartic acid, and glutamic acid (Liu et al., 2021). However, there is ongoing debate about how metabolites are altered. Therefore, in our study, we utilized SGLT2 genetic variants as instrumental variables to explore changes in metabolites. To identify more metabolite changes, we employed two metabolite GWAS datasets—one predominantly containing lipid metabolites and the other encompassing various blood metabolites. Our study results revealed changes in 173 out of 249 metabolites and 220 out of 486 metabolites in the two respective datasets. The connections between metabolites and multiple diseases still require further exploration.
4.3 The mediating role of gut microbiota and metabolites in the association between SGLT2 inhibition and interstitial lung disease, pneumoconiosis, pulmonary tuberculosis, and asthmaThe aforementioned studies have already revealed that SGLT2 inhibitors induce changes in gut microbiota and metabolites. The investigation into the role of gut microbiota and metabolites in pulmonary diseases is currently progressing vigorously.
Our research results indicate that the family Enterobacteriaceae and the order Enterobacteriales play a mediating role in interstitial lung disease. These two bacteria have not been identified in current research on interstitial lung disease. In a study predominantly involving females with interstitial lung disease, the dysregulation of gut microbiota was identified as a significant factor exacerbating the disease (Chioma et al., 2023). However, the specific bacteria responsible for the dysregulation have not been elucidated. Currently, there is limited data on the gut microbiota of patients with interstitial lung disease. In our study, in addition to these two clearly identified intermediate bacterial groups, there are also some significant bacteria. However, these bacteria still require further investigation in future studies. Additionally, in the study of metabolites and interstitial lung disease, while no mediating metabolites were identified, there are several significant metabolites, such as X-11422 (xanthine), X-14208 (phenylalanylserine), and Gamma-glutamyltyrosine. In a study involving blood samples related to interstitial lung disease in systemic sclerosis, xanthine was found to distinguish the severity of the condition (Meier et al., 2020). Metabolomic research on cellular metabolism in lung fibrosis revealed changes in various amino acids such as glutamine, glutamate, glycine, and lipid metabolites (Roque and Romero, 2021). While our study partially corroborates these findings, we also identified additional metabolites that require further investigation. Furthermore, our research uncovered numerous lipid metabolites associated with interstitial pneumonia; however, they did not maintain significance after multiple corrections and are therefore not discussed in our analysis. We hope that future studies will provide better insights to validate these observations.
Our research findings suggest that the family Alcaligenaceae and X-12719 play a mediating role in pneumoconiosis. In a Mendelian randomization study investigating the relationship between gut microbiota and pneumoconiosis, utilizing a database from Finland, we also identified a significant association between the Alcaligenaceae family and pneumoconiosis (Shi et a
留言 (0)