Data sourcesAdministrative data
We obtained application data for new NHSC LRP clinicians from FY 2019, FY 2020, and FY 2021 NHSC LRP clinicians from HRSA’s internal BHW Management Information System Solution. The clinician application data provided four measures of clinicians’ background demographic characteristics such as gender, underrepresented minority, disadvantaged background, and rural background status. Please see Supplemental Table S1 for the background characteristics of the clinicians in the Standard, SUD, and Rural Community LRPs. The application data also contained federal codes for the counties where clinicians served which were used to link to publicly available data (described below).
Web-based surveys
NORC, the independent evaluator, designed, tested, and fielded three web-based surveys of NHSC clinicians. The three cross-sectional surveys were fielded to new FY 2019-FY 2021 NHSC LRP participants in the fall of each year from 2020 to 2022. (Each respondent participated in only one survey; there were no duplicate responses). The survey was pilot-tested with six NHSC clinicians from different regions of the country before the first round of fielding. NORC survey experts and external subject matter experts also reviewed the survey. The pilot subjects and experts provided feedback on the survey grammar, question length, and question format. All responses were completely confidential within NORC. Clinicians did not receive any financial incentive for participation and their participation was voluntary. The average NHSC clinician survey response rate was 61.7%. Response rates were calculated using the American Association for Public Opinion Research Response Rate 2 [22]. Approval for the survey was obtained from NORC’s Institutional Review Board. The surveys and their administration were approved by the U.S. Government’s Office of Management and Budget; the questionnaires, as well as the outreach materials, are available online [23]. Additional details about the survey development, fielding, questions used in this analysis, links to the surveys, and response rates are provided in Supplemental Material S7.
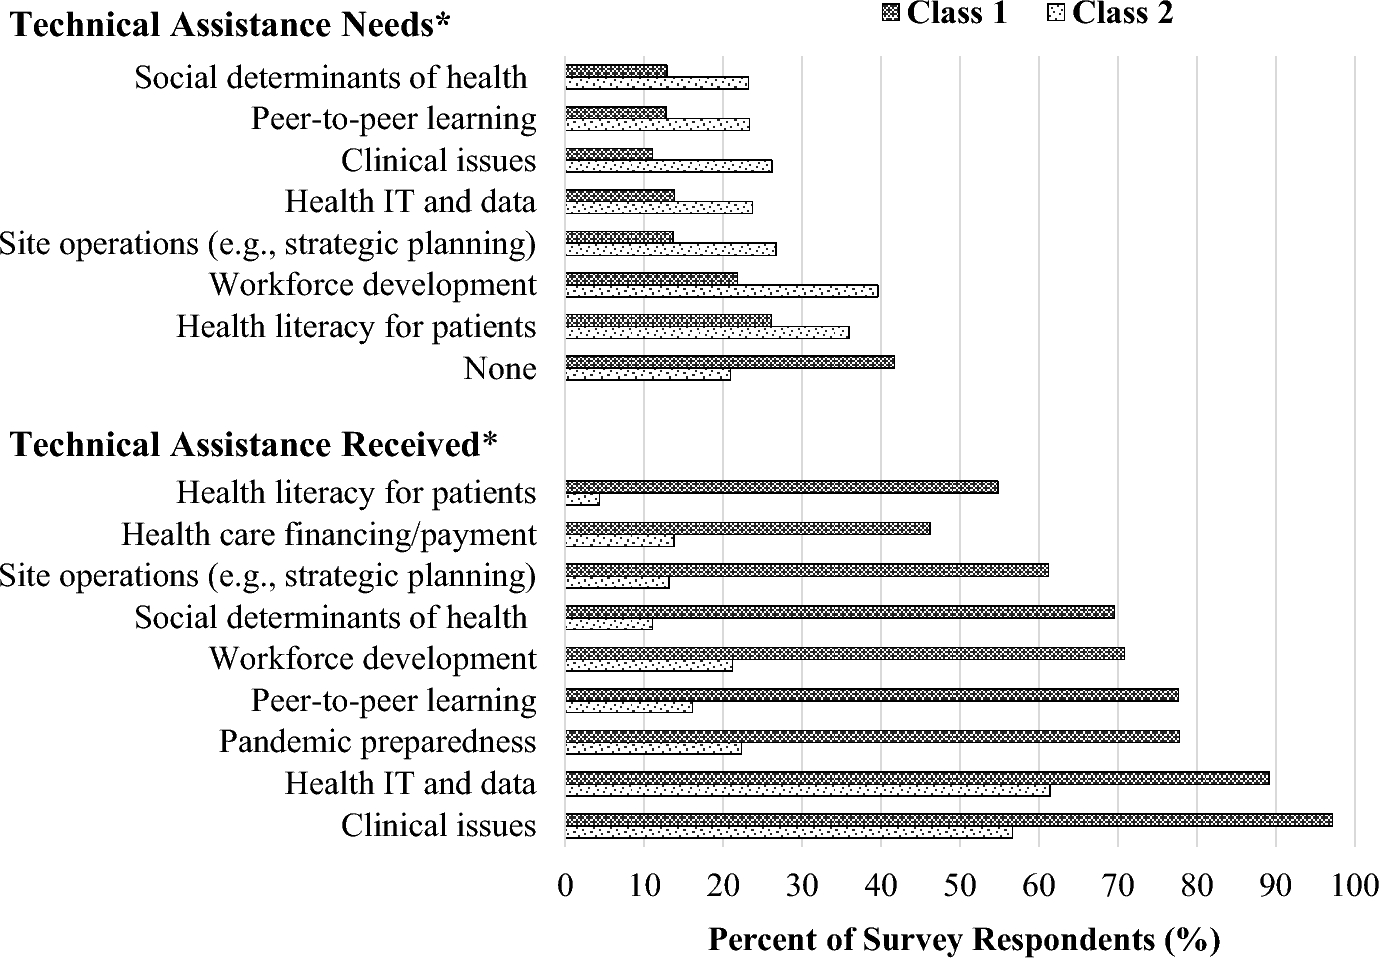
The dependent variable was the intention to remain working in an underserved area, a dichotomous measure constructed from an affirmative response to one of two survey questions regarding whether the clinician planned to provide patient care following service completion: (1) at an NHSC site; or (2) at a non-NHSC site in an underserved area. The survey measures selected for analysis were questions about clinicians’ experiences at sites concerning resources, support, technical assistance, and challenges to providing care (Supplement S7 provides the specific survey questions). Our final analysis included 9341 respondents who answered this question and responded to the questions about site experiences.
Public data
To examine the characteristics of counties where clinicians in the study served, we used the Social Vulnerability Index (SVI) from the Centers for Disease Control and Prevention and the Agency for Toxic Substances and Disease Registry and the University of Wisconsin Population Health Institute’s County Health Rankings [24, 25]. These data were used because aspects of the community could affect a clinician’s decision to remain working in an underserved area. While clinicians entering the NHSC are aware that they will work in underserved areas, there may be variations in community resources, such as affordable housing, and recreational, educational, and economic opportunities for their families. The County Health Ranking data provided a within-state ranked value based on each county’s score for six composite indexes that reflect conditions that influence health and well-being: (1) length of life; (2) quality of life; (3) health behaviors; (4) social and economic factors; (5) environmental factors; and (6) access to care.
Analyses
We employed a latent class analysis (LCA) to identify typologies of clinicians’ experiences at sites, and the association of these typologies with the intention to remain working in an underserved area and with individual-level background characteristics. To select measures for the LCA, we first conducted bivariate regression analyses to test for statistically significant differences (at P < 0.05) between those who do and do not intend to remain working in underserved areas for each of the measures examined for inclusion in the LCA. The measures tested for inclusion in the LCA were the survey measures on workplace experiences (described above), individual-level background demographic measures, and community characteristics as measured by the SVI and the county health ranking data.
Second, using the measures from the bivariate analyses that were most strongly associated with the intention to stay, we implemented a series of latent class models to understand whether there are typologies of clinicians’ experiences such as whether there were patterns for results to questions about site experiences). The LCA method has the advantage of using statistical modeling to classify persons based on response data. The accuracy of the classification can be assessed by statistical fit indices and with other theoretical and empirical understanding of how measures may cluster together. We used Bayesian Information Criterion (BIC) to compare model fit, and entropy to understand how well the classes were distinguished.
To identify the number of classes, our initial LCA models used measures for which there was at least an 8% difference between clinicians who do and do not intend to serve. This threshold was used to find the fewest number of covariates that drive class sorting, avoid data redundancy and highly correlated variables, and overfitting the model which could result in finding rare, spurious classes [26, 27]. To refine the model fit and improve entropy, we incorporated additional measures for which there was a 7% or greater difference between the two groups of clinicians (on the intention to serve). The results of the LCA assign each respondent to a latent class; the assignment of individuals to classes is probabilistic. All the variables selected for inclusion for fitting the LCA had Spearman's rank correlation coefficients (rho) of less than 0.4.
We also used the same measures selected for the final LCA model to conduct additional LCA, stratified by discipline, since experiences at sites may vary by discipline.
Following the LCA, which assigned individuals to classes, our third step was to characterize each class using bivariate logistic regression, with class membership as the outcome variable, to examine how experiences and background characteristics varied across the classes, and to test the association of each class with the intention to stay. Regression models included survey weights that adjusted for nonresponse across the three loan repayment programs. While the overall average response rate was 61.7%, clinicians in the standard LRP had a lower average response rate (59.9%) compared to the SUD and Rural Community clinicians (67.5% and 65.9%, respectively). These weights allowed survey results to reflect the distribution of the overall loan repayment program population, by program participation. Results were also adjusted for the false discovery rates (FDR) [28]. All analyses were conducted using Stata SE 17 for Windows (Stata Corp, College Station, Texas).


留言 (0)