
記住我

Methane (CH4) is the key to tackling two of the major obstacles in ruminant nutrition: feed efficiency and greenhouse gas (GHG) emissions. Enteric methane emissions represent up to 10% of dietary energy loss (Blaxter and Clapperton, 1965) and 26.9% of the total anthropogenic CH4 emissions in the US (US EPA, 2022). Further, these factors of ruminal methanogenesis may create a negative feedback loop around the price of not only beef and dairy but also other agricultural products because agricultural practices are often dependent on local climate, which is expected to vary drastically due to climate change thereby impacting productivity (Gornall et al., 2010). With the growing public concerns of food insecurity (Capitán-Moyano et al., 2023) and environmental impacts (Myers et al., 2022), mitigation of ruminal methanogenesis is a pivotal point for the future of our agriculture (Beauchemin et al., 2020).
However, methanogenesis serves as a major hydrogen (H2) sink to maintain functional microbial fermentation in the rumen (Ungerfeld, 2020). Because of the symbiotic nature of ruminant digestive physiology, merely inhibiting methanogenesis may result in the accumulation of H2 thereby inhibiting microbial fermentation and growth (van Soest, 1994). Therefore, ideal means of ruminal methanogenesis inhibition should not only inhibit the methanogenesis pathways but also account for the vacant niche space of H2 sink due to the absence of methanogenesis. One strategy to achieve such simultaneous inhibition and replacement would take advantage of the thermodynamics and kinetics of enzymes involved in microbial biochemistry so that thermodynamic inhibitors act as alternative H2 sinks while a enzymatic inhibitor directly inactivates a methanogenic molecule.
Thermodynamics dictates the favorability of a reaction while kinetics corresponds to reaction rates, which are governed by the underlying enzymatic mechanisms (Kohn and Boston, 2000; Ungerfeld, 2020). Hence, a thermodynamic inhibitor would be an electron acceptor that competes with methanogenesis for available H2 (Kohn and Boston, 2000; Ungerfeld and Kohn, 2006). Conversely, an enzymatic inhibitor exerts its effect by inhibiting an enzyme or cofactor (Ungerfeld and Kohn, 2006). Enzymatic inhibition is reported to be the most efficacious among numerous anti-methanogenic strategies (Chalupa, 1977; Goel et al., 2009; Matsui et al., 2020). Based on the above strategies, we hypothesized that 1) methane inhibition via thermodynamics is dose-dependent whereas methanogenesis inhibition by an enzymatic inhibitor is dose-independent; 2) combinations of thermodynamic inhibitors offer an additive anti-methanogenic effect; and 3) combination of thermodynamic and enzymatic inhibitors inhibit methanogenesis and redistribute H2 to other fermentation end products.
Our objective was to determine the effect of four feed additives on CH4 production by in-vitro cultures of mixed ruminal microbes. Sodium nitrate (NaNO3), sodium sulfate (Na2SO4), and 3-nitro-1-propionate (3NPA) were used as thermodynamic inhibitors, while bromochloromethane (BCM) was used as an enzymatic inhibitor. A total of 4 experiments were conducted. In experiments 1 and 2, individual additives were evaluated at three inclusion levels. In experiment 3 and 4, the highest level of individual additives from previous experiments was used to determine the combined effect of the additives. The effect of additive treatments was evaluated at three different energy levels achieved by varying the forage to concentrate ratio of the basal diets, which consisted of alfalfa pellets and a concentrate mix.
2 Materials and methods 2.1 Additives and basal dietsFour independent experiments were conducted to test the effectiveness of individual and combined additions of NaNO3 (Sigma-Aldrich; purity ≥ 99.0%), Na2SO4 (EM Science; purity ≥ 99.0), 3NPA (Cayman Chemical Company; purity ≥ 95.0%), and BCM (Chem Service Inc.; purity = 100) on inhibiting CH4 in batch cultures of mixed ruminal microbes. Experiments 1 and 2 assessed the effect of independent additives included at four levels (DM basis). The additive treatments were as follows: control (no additive), NaNO3 at 7, 14, & 28 g/kg, and Na2SO4 at 3, 6, & 12 g/kg in experiment 1; and control, 3NPA at 0.5, 1.0, & 2.0 g/kg, and BCM at 0.075, 0.15, & 0.30 g/kg in experiment 2. Doses of NaNO2 (Patra and Yu, 2014; Nguyen et al., 2015), Na2SO4 (van Zijderveld et al., 2010; Patra and Yu, 2014; Gupta et al., 2017), 3NPA (Ochoa-García et al., 2019), and BCM (Tomkins et al., 2009; Abecia et al., 2012) were determined based on literature as cited. Based on the results of experiments 1 and 2, we determined the inclusion levels and combinations for experiments 3 and 4 and assessed the effect of combined additives included at one level as follows: control (no additive); NS(28 g/kg of NaNO3, 12 g/kg of Na2SO4); NSP (NS + 2.0 g/kg of 3NPA); and NSPB (NSP + 0.30 g/kg of BCM). The stock solutions of the above additives were dissolved in deionized H2O, except for BCM, which was dissolved in methanol (Supplementary Table S1).
Basal diets consisted of ground alfalfa hay and concentrate mix in three proportions as follows: (1) 70:30 high forage (HF); (2) 50:50 medium forage (MF); and (3) 30:70 low forage (LF). The concentrate mix consisted of a mixture of ground corn, soybean meal, and vitamin and mineral mix. The ingredients and chemical composition of the basal diets are presented in Table 1. Basal diets were designed to provide varying levels of energy from alfalfa and concentrate mix, which averaged 2.28, 2.35, and 2.42 Mcal of ME/kg DM in HF, MF, and LF diets, respectively (National Research Council, 2001). Basal diets (~1.0 g) were quantitatively weighed and placed in 100-mL glass culture bottles in duplicate. The same batches of ground alfalfa and concentrate mix were utilized for all four experiments. On the day of inoculation, respective additive treatments were quantitatively included in the culture bottles. All experiments were repeated twice in separate batch runs for statistical analysis (n = 2). For experiments 1 and 2, the first and second batch runs were conducted in summer and fall of 2021, respectively. For experiments 3 and 4, both batch runs were conducted at the same time in winter of 2022.
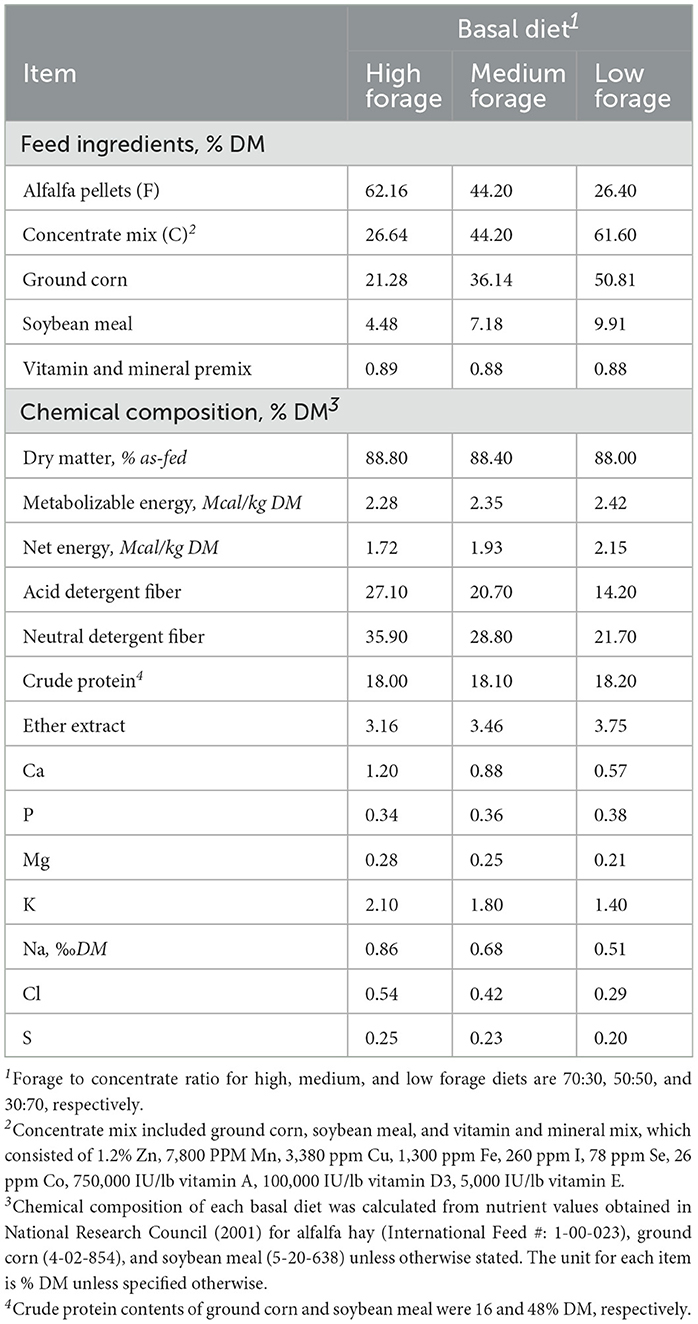
Table 1. Ingredients and chemical composition of three basal diets (high, medium, and low forage) on a dry matter basis (DM).
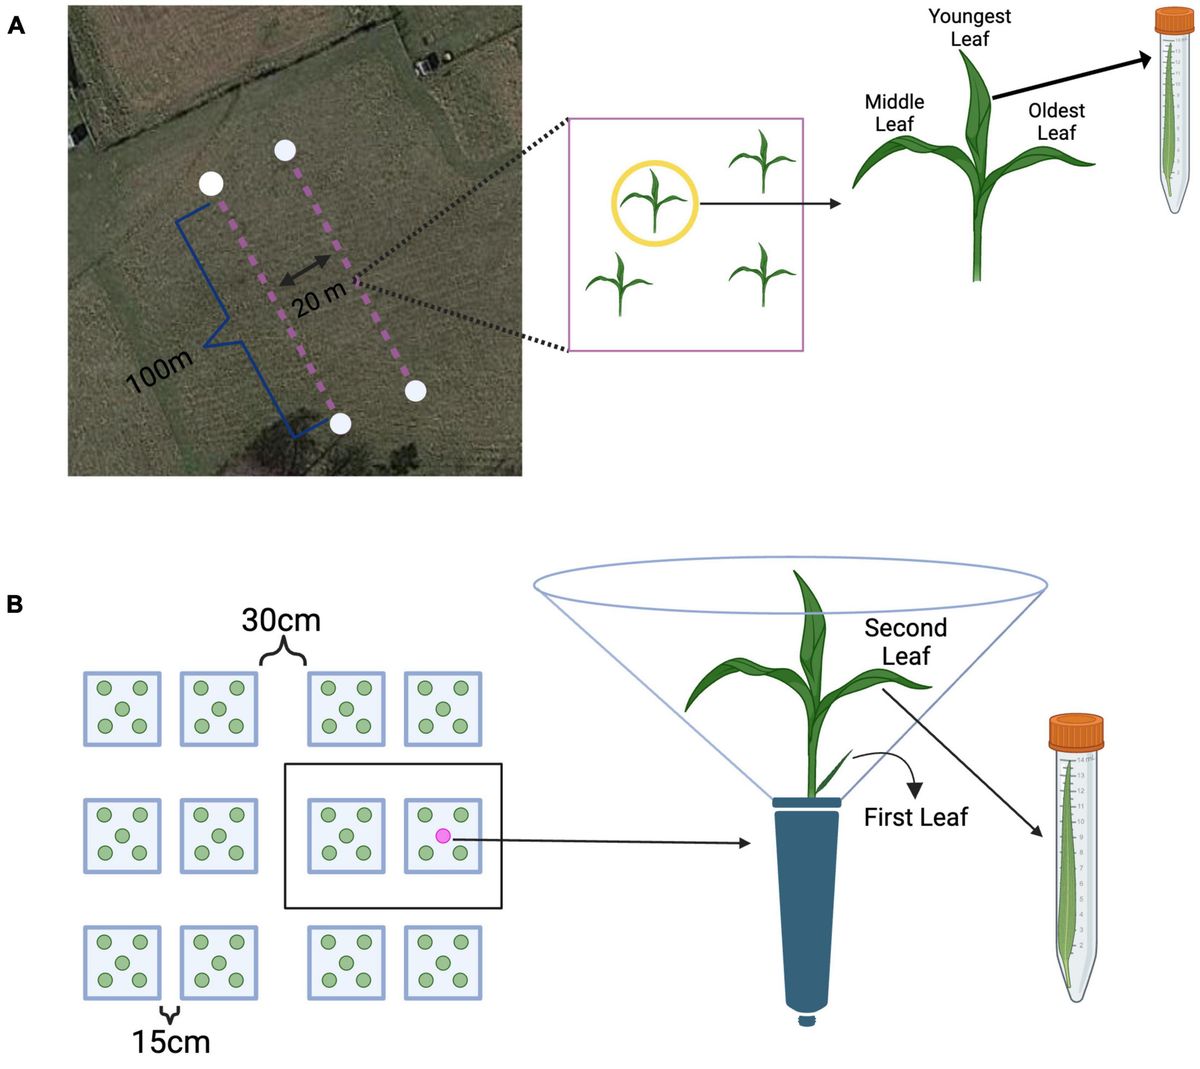
2.2 Rumen fluid collection and inoculationRumen contents were collected from a cannulated Hereford steer (Bos taurus) fed a basal diet, which consisted predominantly of orchardgrass pasture, throughout the experimental period. The steer was housed at the NCSU Metabolic Unit. The surgery protocol and animal handling procedures were approved by the North Carolina State University Institution of Animal Care and Use Committee (Approval No. 23-163). Whole ruminal contents (approximately 6 L) were obtained 2h postprandially, transported to the lab in pre-heated vacuum containers and squeezed through a double-layered cheesecloth. The strained ruminal fluid was used to inoculate culture bottles. Rumen inoculum was prepared by mixing rumen fluid and artificial saliva in a 1:2 ratio (Gawad and Fellner, 2018). The artificial saliva was prepared according to the ruminant saliva composition as previously outlined by McDougall (1948) and Slyter et al. (1966) and consisted of NaHCO3, NaH2PO4•H2O, NaCl, KCl, CaCl2•2H2O, MgCl2•6H2O, and Urea. Thirty mL of rumen inoculum were added to each fermentation bottle (nominal volume = 100 mL) that contained 1.0 g of feed substrate and the additive treatments. Culture bottles were flushed with a continuous stream of CO2 prior to and during inoculation to maintain anaerobicity. Immediately following the inoculation, the bottles were sealed with rubber-lined septum caps and incubated in a water bath at 39°C. After 0, 6, 12, and 24h of fermentation, respective culture bottles were transferred to an ice bath to terminate further microbial activity. The 12h time point was not measured in experiment 3 and 4 based on experiments 1 and 2.
2.3 Chemical measurementsWe measured CH4, H2, pH, ammonia-N (NH3), and short-chain fatty acids (SCFAs). At the end of 0, 6, 12, and 24 h, and prior to opening the bottles, a gas sample was taken from the headspace and immediately analyzed for CH4 and H2. Gas samples (10 μL) were withdrawn directly from the headspace with the aid of a gas tight syringe (Hamilton Co., Reno, NV) and analyzed using a gas chromatograph (model CP-3800; Varian, Walnut Creek, CA) equipped with a stainless-steel column packed with Molsieve 5A 45/60 mesh (Supelco Inc., Bellefonte, PA) as well as the flame ionization detector for the detection of CH4 and the thermal conductivity detector for H2. Seventy mL of headspace in the bottle allowed for the collection of gas, and the rubber-lined septum cap for retaining the gas in the headspace while taking samples. The expressions of both CH4 and H2 concentrations (in mM and μM, respectively) are based on the headspace volume of 70 mL (0.07 L). Area counts from 10 μL injections of CH4 (770191.76) and H2 (98.35) standard gases were used to calculate the concentration (reported as mM for CH4 and μM for H2) of the respective gas in a sample using the following formula (Equation 1) given the gas constant that 1 mol of gas occupies 22.4 L (and the units were converted from M to mM or μM for CH4 and H2, respectively):
Gas (M)=area countsamplearea countstandard×mol22.4LAfter the headspace gas measurement, pH of the culture fluid in the bottle was measured with a pH probe (VWR SympHony—model AR25; Accumet Research, Dual Channel pH/Ion Meter Fisher Scientific). Following pH measurements, culture contents were transferred to a tube and centrifuged at 500 xg for 5 min at 4°C to separate the solid digesta from the liquid. Four mL aliquots of supernatant were transferred to two 5.0-mL centrifuge tubes and kept in a freezer at -80°C for subsequent NH3 and SCFA measurements and DNA extraction. After thawing the 4.0-mL aliquots, two 1.0-mL aliquots were transferred into separate microcentrifuge tubes for NH3 and SCFA analyses.
Ammonia-N was analyzed using the colorimetric procedure outlined by Beecher and Whitten (1970). Standards containing 0, 4, 8, 12, and 16 μg/mL of NH3-N were prepared to generate a standard curve. Culture samples were centrifuged at 21,000 xg for 15 minutes at 4°C to separate any remaining solid particles from the liquid. For the analysis, 5.0 μL of sample or standard were transferred, in duplicate, into glass tubes. Each tube received 100 μL of deionized water, and 0.5 mL of phenol and sodium hypochlorite reagent. The samples and standards were allowed to react for 30 minutes at room temperature. Following 30 min, 4.0 mL of deionized water was added, and the sample was transferred into a cuvette. Absorbance was measured at a wavelength of 630 nm. The standards were used to determine the concentration of unknown samples.
Short chain fatty acids were measured as previously described by Eun et al. (2004) using gas-liquid chromatography (model CP- 3380; Varian, Walnut Creek, CA) equipped with a fused silica capillary column, 30 m × 0.25 mm with 0.25-μm film thickness (NukolTM; Superlco Inc., Bellefonte, PA). One mL aliquots of culture contents were frozen, thawed, and centrifuged at 21,000 xg for 15 min at 4°C to separate remaining solid particles from the liquid. The 1.0-mL sample aliquot was treated with 0.2 mL of a metaphosphoric acid, which included 2-ethylbutyrate as internal standard. The sample was then centrifuged at 21,000 xg for 5 minutes at 4°C, and the supernatant was transferred into a GC vial. The column used in this study detected acetate, propionate, butyrate, valerate, and the isoacids (isobutyrate and isovalerate; we did not measure 2-methylbutyrate, but our results would include it in the isovalerate estimate).
Using the CH4, H2, and SCFA values measured, theoretical amount of hexose metabolized, production of metabolic hydrogen, recovery of metabolic hydrogen in fermentation end-products and in cells, and the total metabolic hydrogen recovery were calculated using the equation provided by Marty and Demeyer (1973). Additionally, dissolved H2 concentrations were estimated using the equation provided by Wang et al. (2016) though the authors highlight the limitation of this estimation. Data were normalized by subtracting the values from the rumen fluid blanks (i.e., rumen inocula without substrates, sacrificed at 0h) from those of samples at 6, 12, and 24h.
2.4 DNA sequencingFor DNA sequencing, the following criteria were used to select samples: control and highest level of inclusion; high- and low-forage diets; and incubation of 0 and 24h. This resulted in a total of 88 samples. To facilitate the lysis of microbial cells, an enzymatic lysis mixture was prepared, containing 200 μL of Lytic Enzyme Solution (Qiagen) and 400 μL of MetaPolyzyme (Millipore Sigma MAC4L-5MG), mixed in 19,400 μL of PBS, following the protocol outlined by Maghini et al. (2021). Samples containing 4.0 mL of ruminal fluid were thawed and centrifuged at 12,000 xg for 5 mins at 4°C to separate solid particles from the liquid phase. Supernatant was removed and 200 mL of the enzymatic lysis mixture was added to each sample. The samples were then incubated at 37°C for 1h. After the incubation, microbial DNA was extracted using a Zymo Quick-DNA Fungal/Bacterial Miniprep Kit (Zymo Research), following the manufacturer's protocol.
The concentration of extracted DNA in each sample was measured by UC/Vis spectroscopy using a NanoDrop spectrophotometer (Thermo Fisher Scientific). The DNA concentrations in the samples were standardized to approximately 30 ng/μL of DNA, which was then amplified via polymerase chain reaction (PCR). For PCR, Q5 DNA Polymerase and the following three primer pairs were included separately (i.e. one primer pair per PCR) at 1.25 μL each for forward and reverse primers with Illumina p5 and p7 adapters, respectively (Supplementary Table S2): 515F-806R for universal 16S rRNA gene V4 hypervariable region (Walters et al., 2016); 516F-915R for archaea-specific 16S rRNA gene V4-V5 hypervariable region (Raymann et al., 2017); and ITS3F-ITS4R for fungal ITS2 region (White et al., 1990). For the 515F-806R and 516F-915R primer pairs, the thermocycling conditions included denaturation at 98°C for 15 sec, annealing at 55°C for 20 sec, and extension at 72°C for 15 sec in 35 cycles. For ITS3F-ITS4R primer pair, the thermocycling conditions included denaturation at 98°C for 15 sec, annealing at 65°C for 20 sec, and extension at 72°C for 15 sec in 35 cycles.
The DNA templates were purified with AMPure XP beads (Beckman Coulter, Inc.). Four μL of the purified PCR products were mixed with 25 μL of Q5 DNA Polymerase, 11 μL of nuclease-free H2O, and 10 μL of IDT for Illumina DNA/RNA UD Indexes. The prepared libraries were purified with AMPure XP beads (Beckman Coulter, Inc.). The libraries were pooled at 10:1:1 for universal 16S rRNA, archaea-specific 16S rRNA, and fungal ITS2 amplicons, respectively, and sequenced on Illumina MiSeq using a MiSeq v3 2x300bp paired end flow cell (20M reads) in the Genomic Sciences Laboratory at North Carolina State University.
2.5 BioinformaticsSequence data were first processed using Cutadapt (Martin, 2011) to separate reads into three separate FASTQ files based on the primer sequence present, resulting in three sets of sequence reads: universal 16S, archaea-specific 16S, and fungal ITS datasets. A custom bash script was created to run the Cutadapt program and to count the number of reads in each of the original and new FASTQ files. Each dataset was then processed following the DADA2 pipeline (Callahan et al., 2016) in R version 4.3.0 (R Core Team, 2023) using RStudio (Posit team, 2023) to infer amplicon sequence variants (ASVs) and assign taxonomy, i.e. the standard DADA2 pipeline for universal and archaea-specific 16S amplicon sequences and the ITS DADA2 pipeline for fungal ITS2 amplicon sequences. For ASVs in the universal and archaea-specific 16S datasets, Silva version 138 reference database was utilized (Quast et al., 2013; Yilmaz et al., 2014). For ASVs in the fungal ITS dataset, UNITE general FASTA release for Fungi 2 was used (Abarenkov et al., 2022).
The ASV and taxa tables from the three separate runs through the DADA2 pipelines were merged for sequence alignment and phylogenetic information inference using the DECIPHER (Wright, 2016) and phangorn (Schliep, 2011) packages, respectively. The NCSU High Performance Computing Hazel Cluster was utilized for this step due to the computational requirements. The ASV, taxonomy assignment, sequence, and phylogenetic information was compiled into a phyloseq (McMurdie and Holmes, 2013) object for downstream analyses.
For alpha diversity, Chao1 diversity, Shannon diversity, and Simpson diversity indices were estimated on the ASV level. For further downstream analyses, ASVs were filtered to the abundance and prevalence of more than 3 (i.e. ASVs only present in more than 3 counts and samples). Beta diversity was estimated on centered-log ratio transformed abundance data using the Bray-Curtis dissimilarity and weighted UniFrac distance as measurements of dissimilarity. To ordinate these dissimilarity and distance measurements, principal coordinate analysis (PCoA) was performed.
From the filtered sequences, pathway abundances were predicted using PICRUSt2 (Douglas et al., 2020). The predicted metagenomic functional data were imported into R and used as a TreeSummarizedExperiment (Huang et al., 2021) object for statistical analysis.
2.6 Statistical analysisData from above measurements and estimations were analyzed according to a completely randomized block design using a mixed model using the following R packages: lme4 (Bates et al., 2015), lmerTest (Kuznetsova et al., 2017), and emmeans (Lenth, 2023) including polynomial contrasts for linear and quadratic trend of the level effect. Data from 6, 12, and 24h were analyzed separately. Thus, the model included treatment and diet as fixed effects while the replicate variable nested within the batch run as a random effect. Thus, the model is represented by:
yijkl=β0+βixi+βjxj+βijxij+γk(l)+ϵijkl (1)where
yijkl = each response variable measured,
β0 = overall mean,
βixi = fixed effect of additive level or treatment,
βjxj = fixed effect of diet,
βijxij = interaction term of additive level or treatment and diet fixed effects,
γk(l) = random effect of replicate nested within run,
ϵijkl = residuals.
For alpha and beta diversity, the RRPP package (Collyer and Adams, 2018) was used for permutational analysis of variance (PERMANOVA). To analyze the relative abundance of archaeal taxa, untransformed abundance data were transformed to relative terms, which were then used as the response variable in the above mixed model. For differential abundance analysis of microbial taxa as well as predicted pathways, the ANCOMBC package was used to conduct the analysis of compositions of microbiomes with bias correction 2 (ANCOM-BC2) (Lin and Peddada, 2020; Lin et al., 2022). Only the individual fixed effects of treatment and diet were included in the model for this analysis because the interaction term could not be included due to the sample size requirement of the ANCOM-BC2 algorithm. The Benjamini-Hochberg adjustment was used as a p-value adjustment method (padj) for multiple hypothesis tests.
Significant effects were declared at p-value ≤ 0.05 and tendencies at p-value ≤ 0.10. The analyzed data were visualized in figures using the following R packages: tidyverse (Wickham et al., 2019) and ggpubr (Kassambara, 2023).
3 Results 3.1 Experiment 1—In-vitro fermentation profileEffects of diets and additives in experiment 1 are reported in Tables 2, 3, Supplementary Tables S3–S6, Figure 1A. There was an interaction between time and treatment (p < 0.001) in all experiments; results are shown by time. The pH values in control cultures ranged from 5.9 at 6 h to 5.2 at 24 h. Total SCFA concentrations at 24h were similar (p > 0.10) in control cultures (Table 3). Acetate decreased and butyrate increased as dietary concentrate increased (Table 3). But proportions of propionate were not affected (p > 0.10). Molar proportions of valerate and isoacids were not affected by diet.
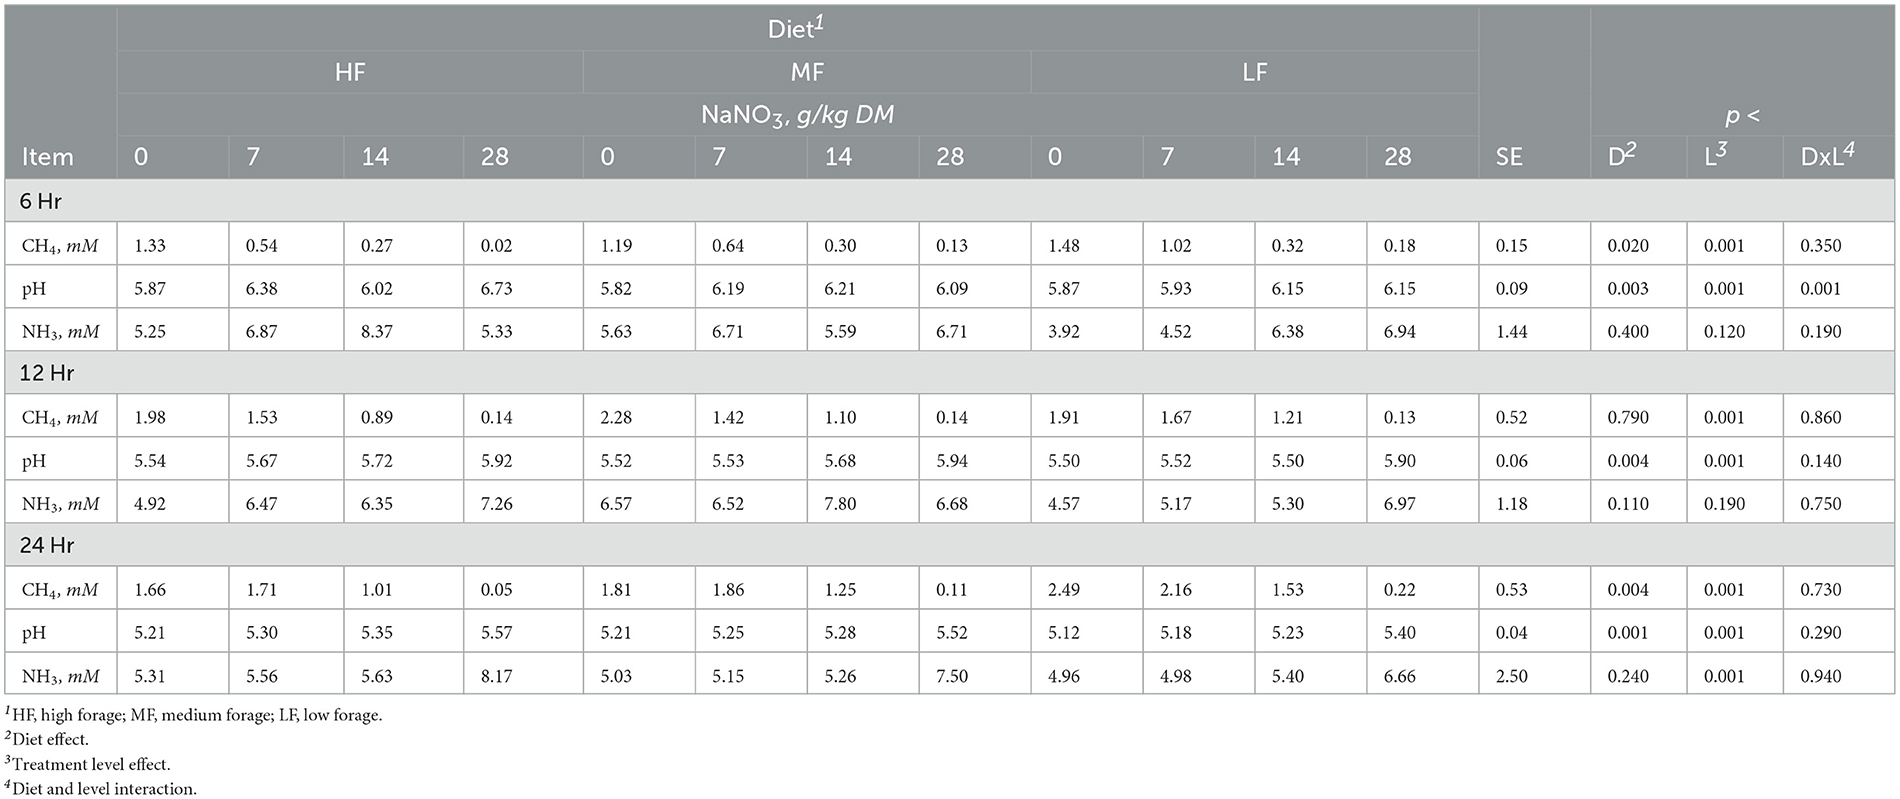
Table 2. Effect of sodium nitrate (NaNO3) on methane (CH4), pH and ammonia (NH3) after 6, 12, and 24h of incubation with rumen microbes in an in-vitro mixed batch culture system fed varying forege:concentrate (HF = 70:30, MF=50:50, and LF = 30:70) in experiment 1.
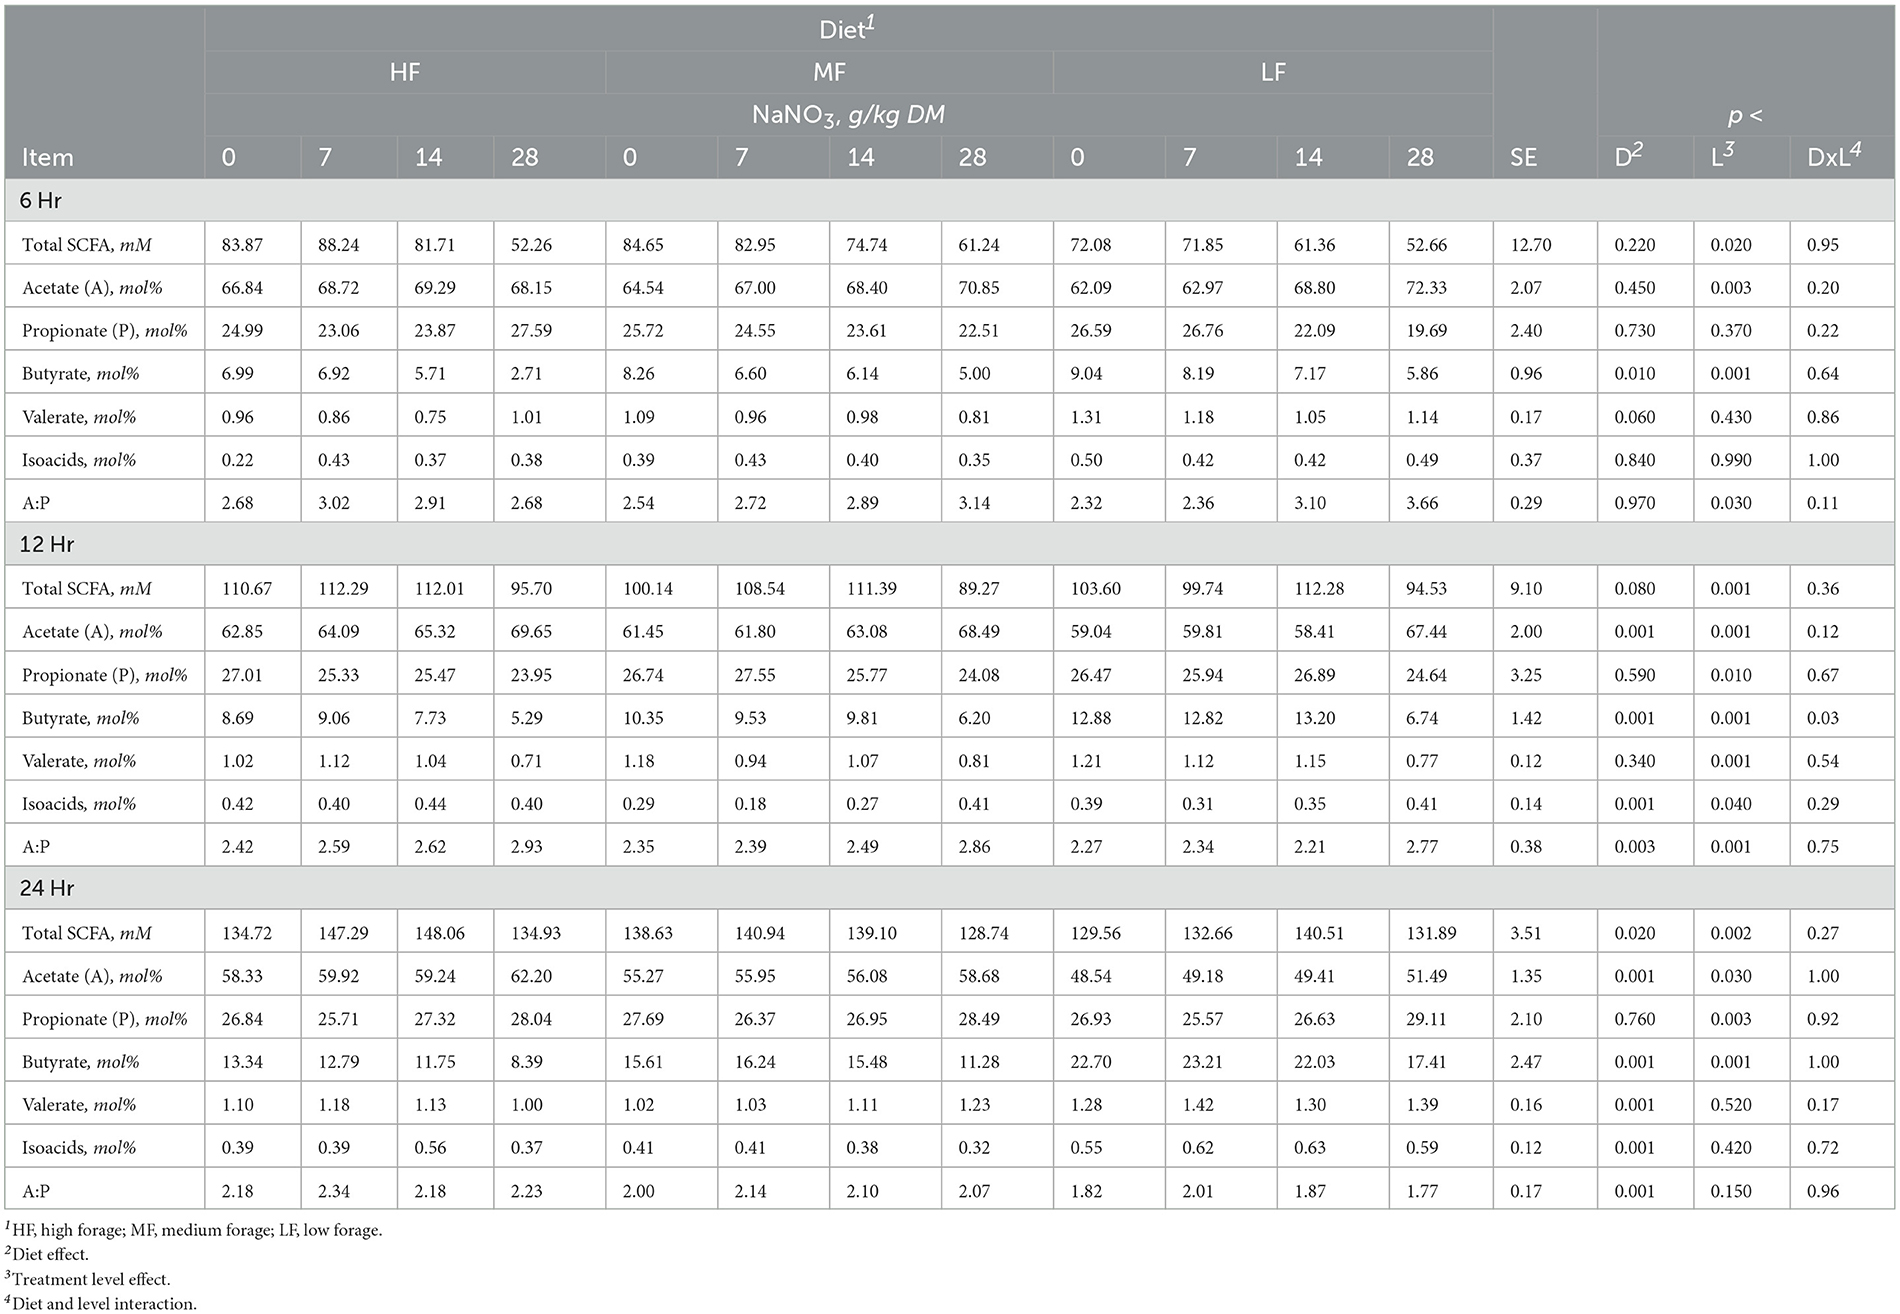
Table 3. Effect of sodium nitrate (NaNO3) on short chain fatty acids (SCFA) after 6, 12, and 24h of incubation with rumen microbes in an in-vitro mixed batch culture system fed varying forege:concentrate (HF = 70:30, MF = 50:50, and LF = 30:70) in experiment 1.
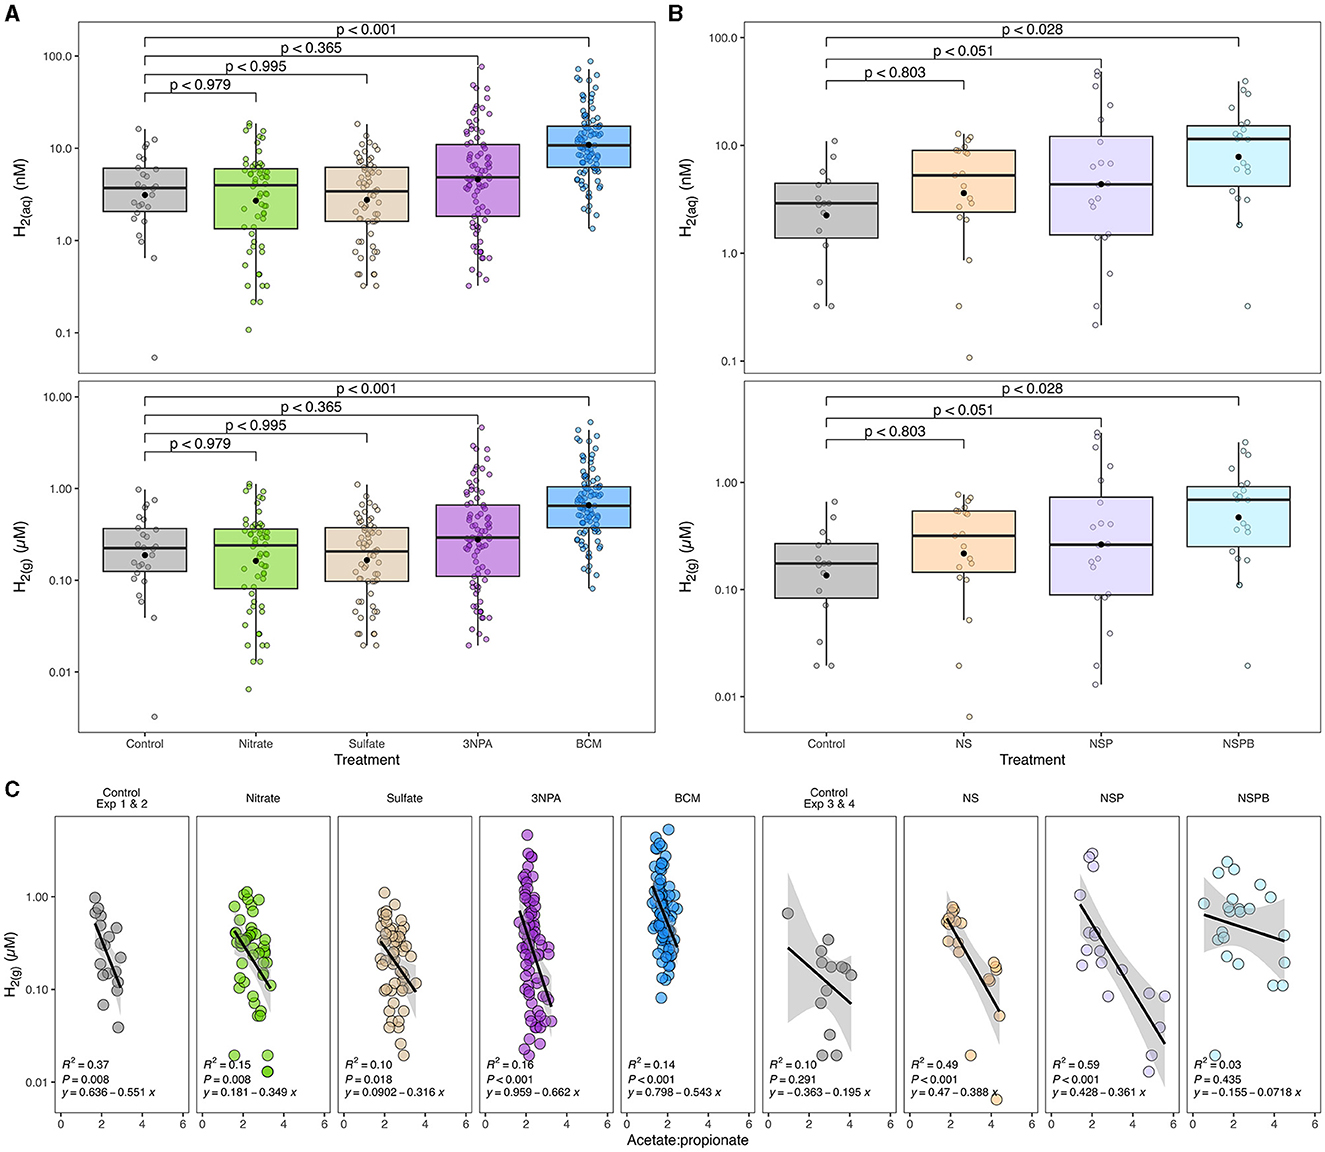
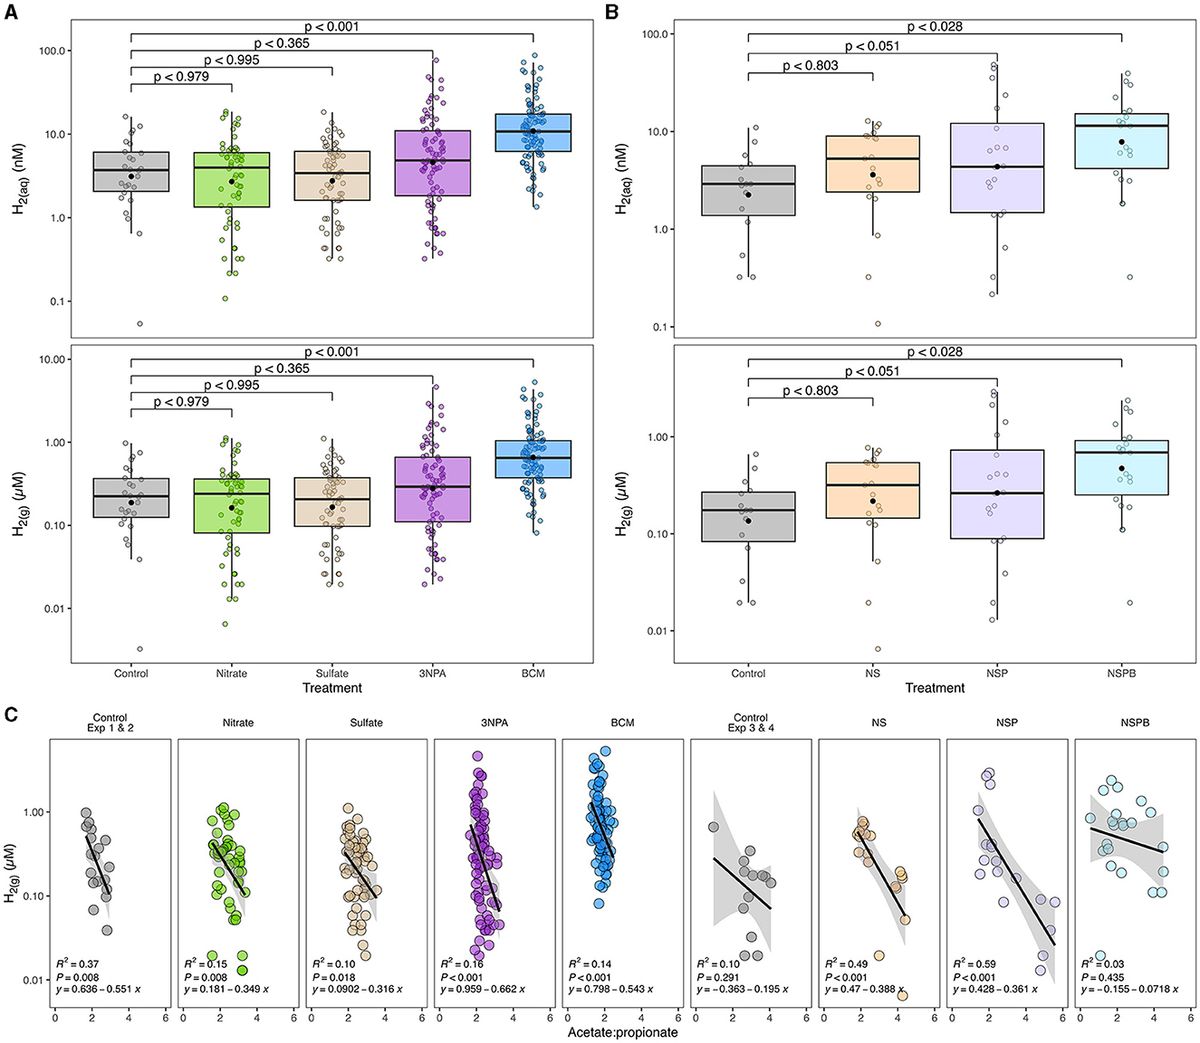
Figure 1. Effects of individual (A) and combined (B) sodium nitrate (Nitrate; N), sodium sulfate (Sulfate; S), 3-nitro-1-propionate (3NPA; P), and bromochloromethane (BCM; B) on gaseous and estimated dissolved hydrogen concentration (H2(g) μM and H2(aq) nM, respectively) and its correlation with acetate-to-propionate ratio (C). Dissolved H2 was estimated as outlined in Wang et al. (2016). In (A, B), the black filled point within each box plot represents the mean. The y-axes of the three figures are presented on log10 scale. Data are representative of all incubation periods (6, 12, and 24h) and diet (varying forege:concentrate, 70:30, 50:50, and 30:70) with rumen microbes in an in-vitro mixed batch culture system.
At 6h, there was an interaction (p < 0.001) between inclusion level of NaNO3 and diet on culture pH. At 24h, NaNO3 decreased (p < 0.01) CH4 irrespective of diet. The decrease was more than 90% and greatest at the highest level of inclusion. In contrast, NaNO3 increased (p < 0.01) culture pH and NH3 irrespective of diet (Table 2).
Sodium nitrate inclusion levels increased acetate and valerate and decreased butyrate in a linear manner (all at p < 0.001). Nitrate supplementation also had a linear effect (p < 0.004) on total SCFA that increased at the 7 and 14 g/kg DM inclusion levels and remained similar to the control at the 28 g/kg DM level. Acetate molar proportions increased linearly (p < 0.001) while butyrate molar proportions decreased linearly (p < 0.001). Molar proportions of propionate increased at the 28 g/kg DM inclusion level of NaNO3 (p < 0.005; Table 3).
Sodium sulfate had a diet by treatment interaction with respect to CH4, pH, and NH3 at 24h (p < 0.02, 0.05, and 0.04, respectively). Methane decreased in HF diet and increased in MF but in LF diets, the 3 g/kg DM level increased CH4 while the 6 and 12 g/kg DM levels decreased CH4 (Supplementary Table S3). Culture pH and NH3 increased in HF diet and decreased in MF and LF diets. Propionate decreased (p < 0.04) with the inclusion of 6 and 12 g/kg DM of Na2SO4 inclusion, which was also reflected in increased A:P (p < 0.02; Supplementary Table S4). Other SCFAs were not affected (p > 0.10).
The levels of NaNO3 inclusion had a linear effect (p < 0.04) on theoretical amounts of hexose metabolized at 6 and 12h (p < 0.04), on metabolic hydrogen recovered in end-products at 24h (p < 0.001), on cellular metabolic hydrogen recovery at 12 and 24h (p < 0.001) and total metabolic hydrogen recovery at 24h (p < 0.001; Supplementary Table S5).
The inclusion levels of Na2SO4 had a linear effect on theoretical hexose metabolism at 24h (p < 0.004), total metabolic hydrogen production at 12 and 24h (p < 0.01 and 0.001), end-product hydrogen recovery at 24h (p < 0.001), cellular metabolic hydrogen recovery at 6 and 24 h (p < 0.001), and total metabolic hydrogen recoveries at 24h (p < 0.001). Quadratic effects of sodium sulfate inclusion levels were observed for total metabolic hydrogen production at 6h (p < 0.03) and cellular metabolic hydrogen recovery at 12h (p < 0.02; Supplementary Table S6).
3.2 Experiment 2—In-vitro fermentation profileEffects of diets and additives in experiment 2 are reported in Tables 4, 5, Supplementary Tables S7–S10, and Figure 1A. There was an interaction between 3NPA and diet at 24h for CH4 and pH (p < 0.005 and 0.03, respectively). In the HF diet, 0.5 g/kg of 3NPA decreased CH4 by 63% and increased pH compared to the MF and LF diets and the control. In contrast, 0.5 g/kg of 3NPA increased CH4 at the 0.5 g/kg DM level with MF diet but decreased CH4 at the 2.0 g/kg level with MF and LF diet (Supplementary Table S7). At 3NPA inclusion of 0.5 g/kg in HF, at 2.0 g/kg in MF and LF diets, culture pH was the highest within the diet. Total SCFA concentration decreased linearly (p < 0.002) with the 3NPA inclusion levels (Supplementary Table S8). Propionate decreased linearly (p < 0.02), which in turn linearly increased A:P (p < 0.001). Valerate increased (p < 0.01), and other SCFAs were not affected. At 6h, molar proportions of butyrate and valerate decreased linearly and quadratically (p < 0.001 and 0.004, respectively).
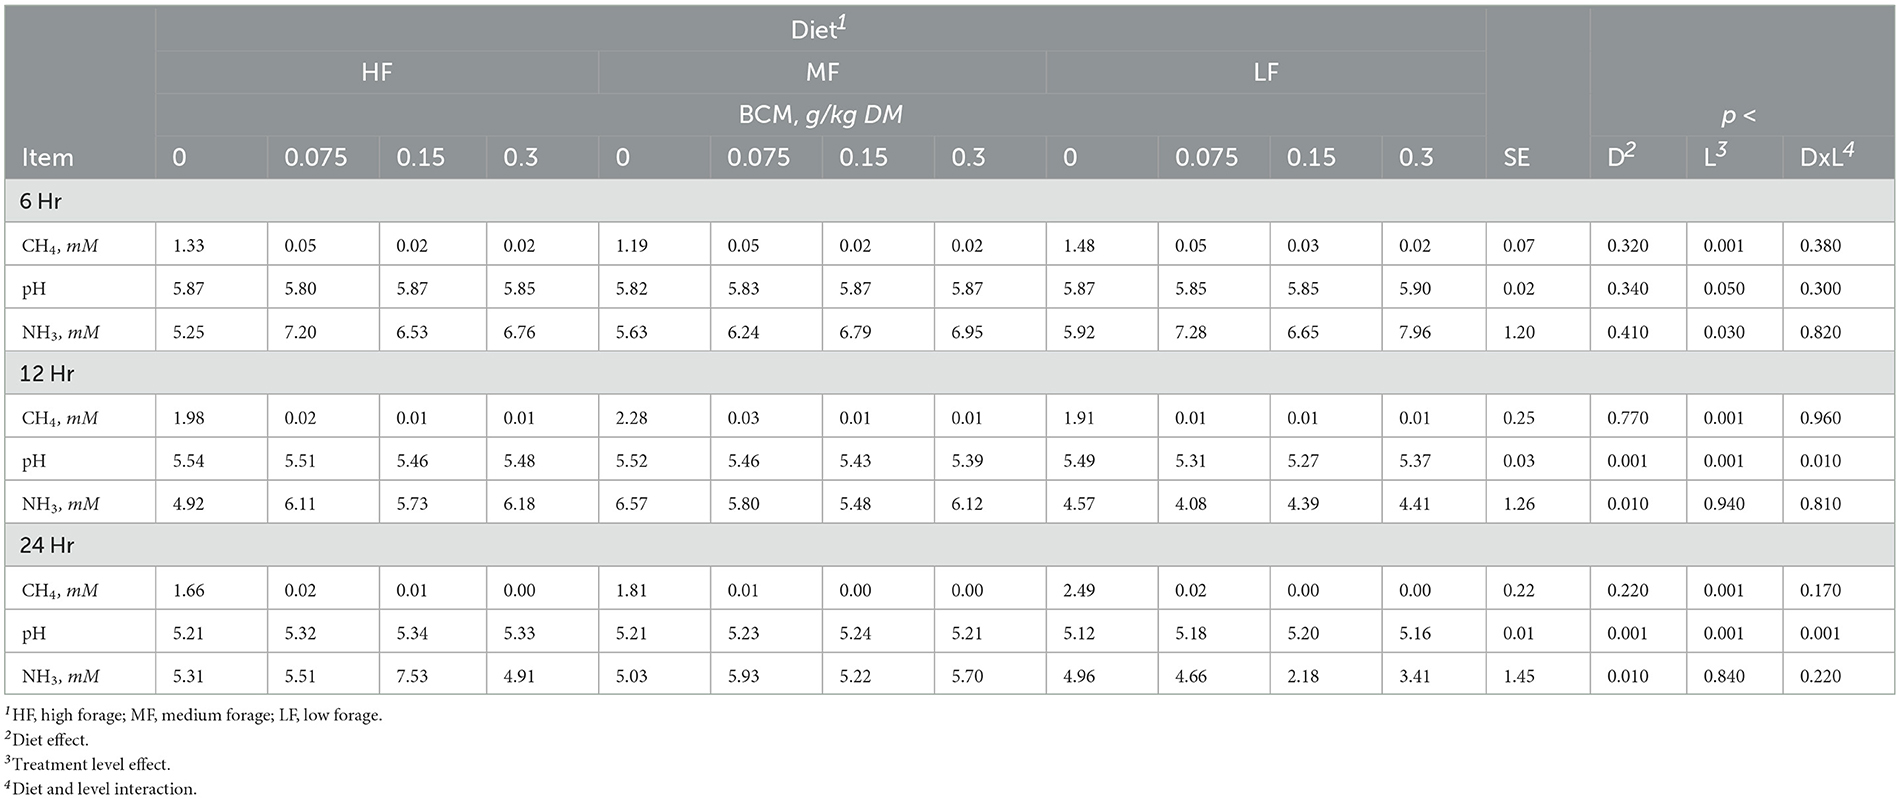
Table 4. Effect of bromochloromethane (BCM) on methane (CH4), pH and ammonia (NH3) after 6, 12, and 24h of incubation with rumen microbes in an in-vitro mixed batch culture system fed varying forege:concentrate (HF = 70:30, MF = 50:50, and LF = 30:70) in experiment 2.
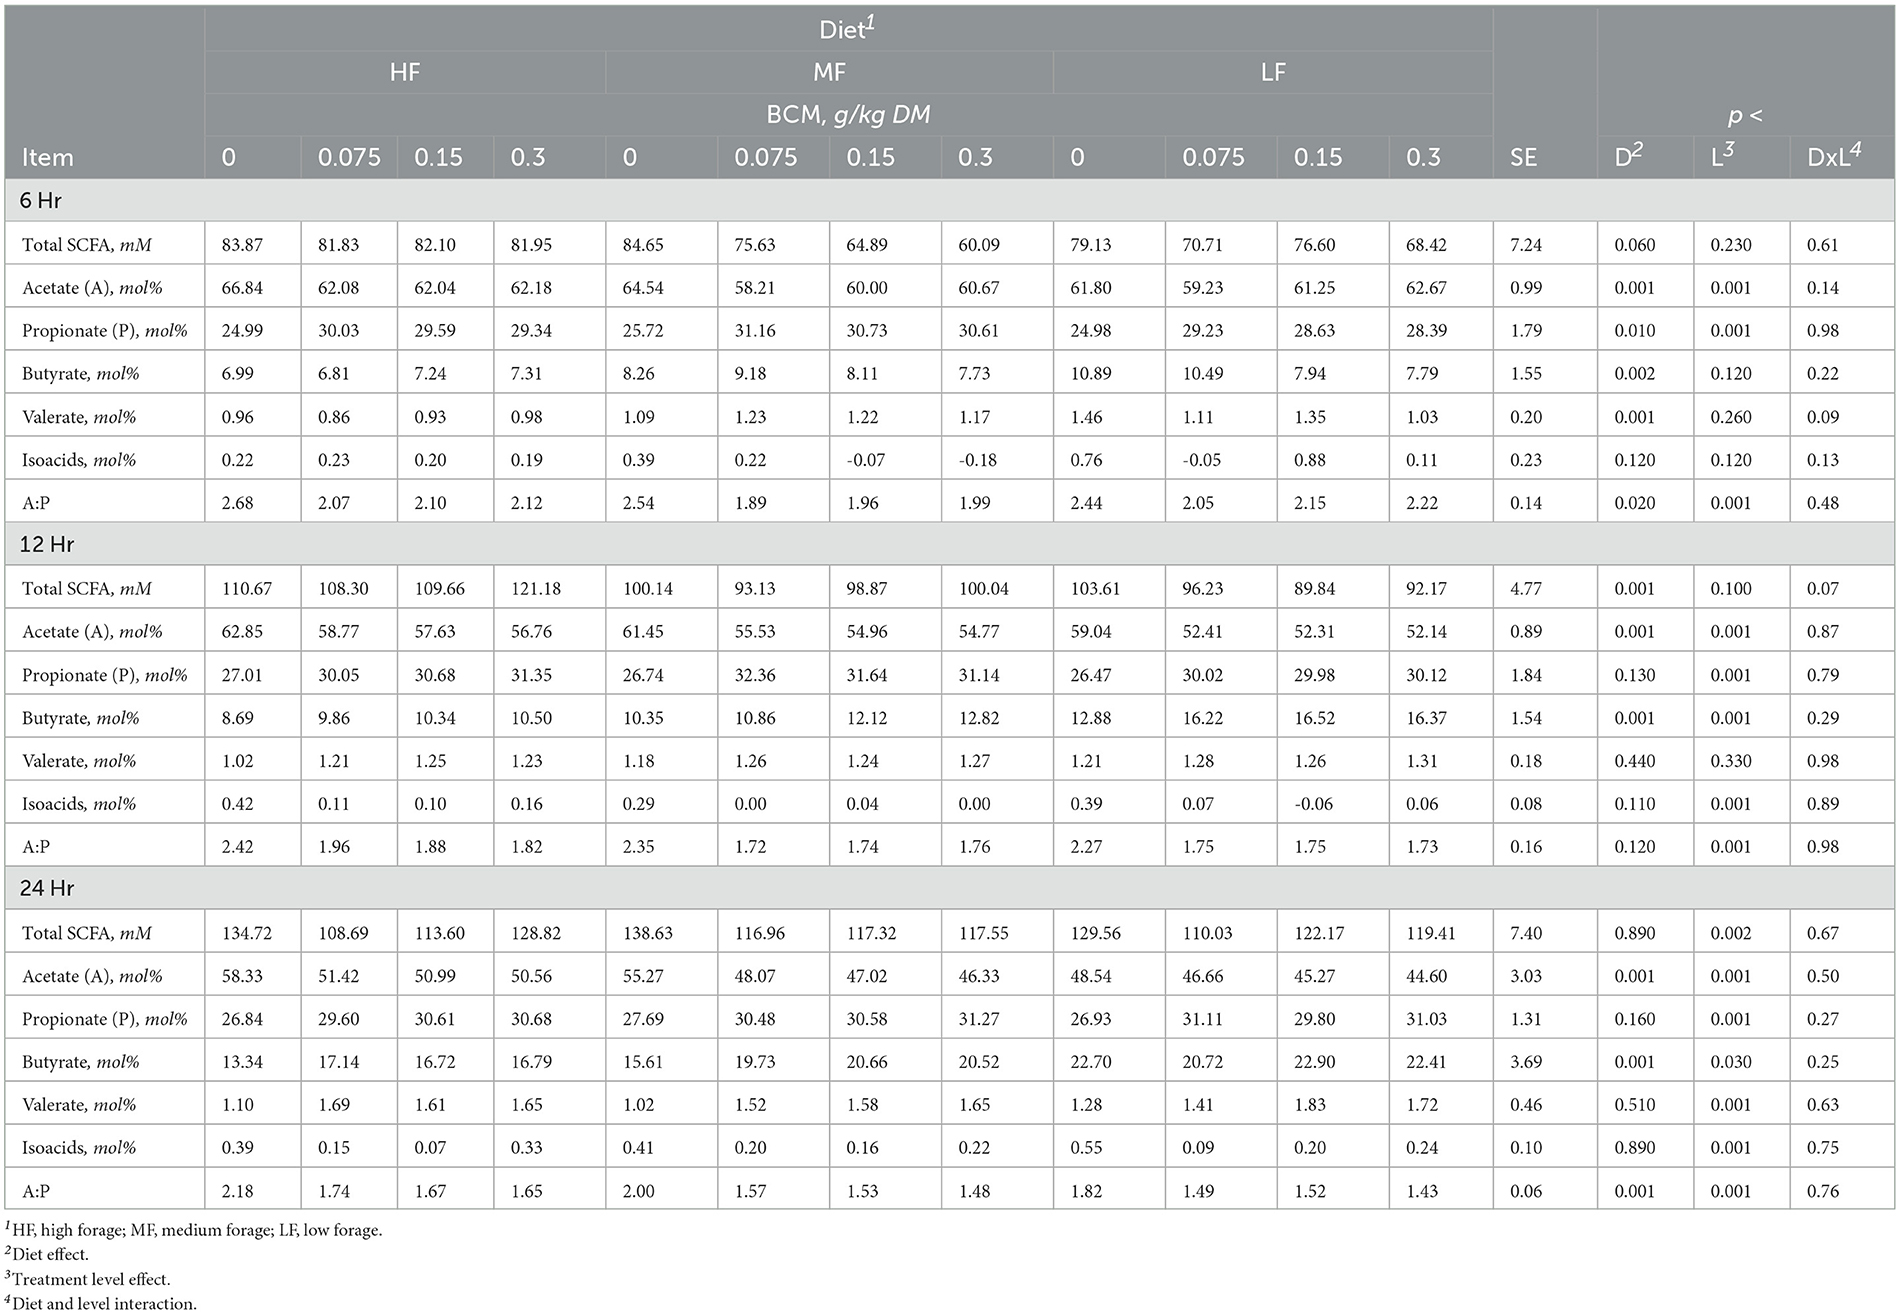
Table 5. Effect of bromochloromethane (BCM) on short chain fatty acids (SCFA) after 6, 12, and 24h of incubation with rumen microbes in an in-vitro mixed batch culture system fed varying forege:concentrate (HF = 70:30, MF = 50:50, and LF = 30:70) in experiment 2.
Methane linearly decreased with the addition of BCM at 6, 12, and 24h (at least p < 0.01; Table 4). At 12 and 24h, there was an interaction (p < 0.01 and 0.001, respectively) between inclusion level of BCM and diet on pH. Culture pH increased quadratically at 24h (p < 0.04) and linearly at 12 h (p < 0.001). Concentration of NH3 increased linearly with the BCM inclusion levels at 6 and 24h (p < 0.05 and 0.005, respectively) and quadratically at 12h (p < 0.05). Concomitantly, H2 in the BCM treatment increased (p < 0.001) when averaged across inclusion level compared to control (Figure 1A).
Total SCFA decreased (p < 0.002) with the addition of BCM at 24 h (Table 5). Molar proportion of acetate decreased (p < 0.001) while that of butyrate (p < 0.001) and propionate (p < 0.04) increased with an increase in the level of BCM inclusion. Consequently, the A:P ratio was decreased (p < 0.04) with an increase in the level of BCM inclusion. BCM increased (p < 0.05) valerate and decreased (p < 0.001) isoacids.
The levels of 3NPA had a linear effect on hexose metabolism at 6h (p < 0.04), total metabolic hydrogen production at 12 and 24 h (p < 0.001), end-product hydrogen recovery at 12 and 24 h (p < 0.01 and 0.001), cellular hydrogen recovery across all time points (p < 0.01, 0.001, and 0.001), and total hydrogen recovery at 24 h. The 3NPA levels exhibited quadratic effects on total metabolic hydrogen production and recovery (p < 0.01) at 6 h (Supplementary Table S9).
BCM had linear effects on hexose metabolism at 6 and 12 h (p < 0.05 and 0.002), end-product metabolic hydrogen recovery at 12 and 24 h (p < 0.001) and cellular metabolic hydrogen recovery at 24 h (p < 0.001) as well as quadratic effects on total metabolic hydrogen production at 6 and 12 h (p < 0.01 and 0.02), end-product metabolic hydrogen recovery at 6 h (p < 0.01), cellular metabolic hydrogen recovery at 6 and 12 h (p < 0.03), and total metabolic hydrogen recovery across all time points (p < 0.01, 0.02, and 0.001; Supplementary Table S10).
3.3 Experiments 3 and 4—In-vitro fermentation profileEffects of diets and additives are reported in Tables 6, 7, Supplementary Table S11, Figure 1B. Methane concentration in control cultures at 24 h was similar (p > 0.10). Culture pH and NH3 in control cultures decreased as the proportion of concentrate mix increased in the diet (Table 6).
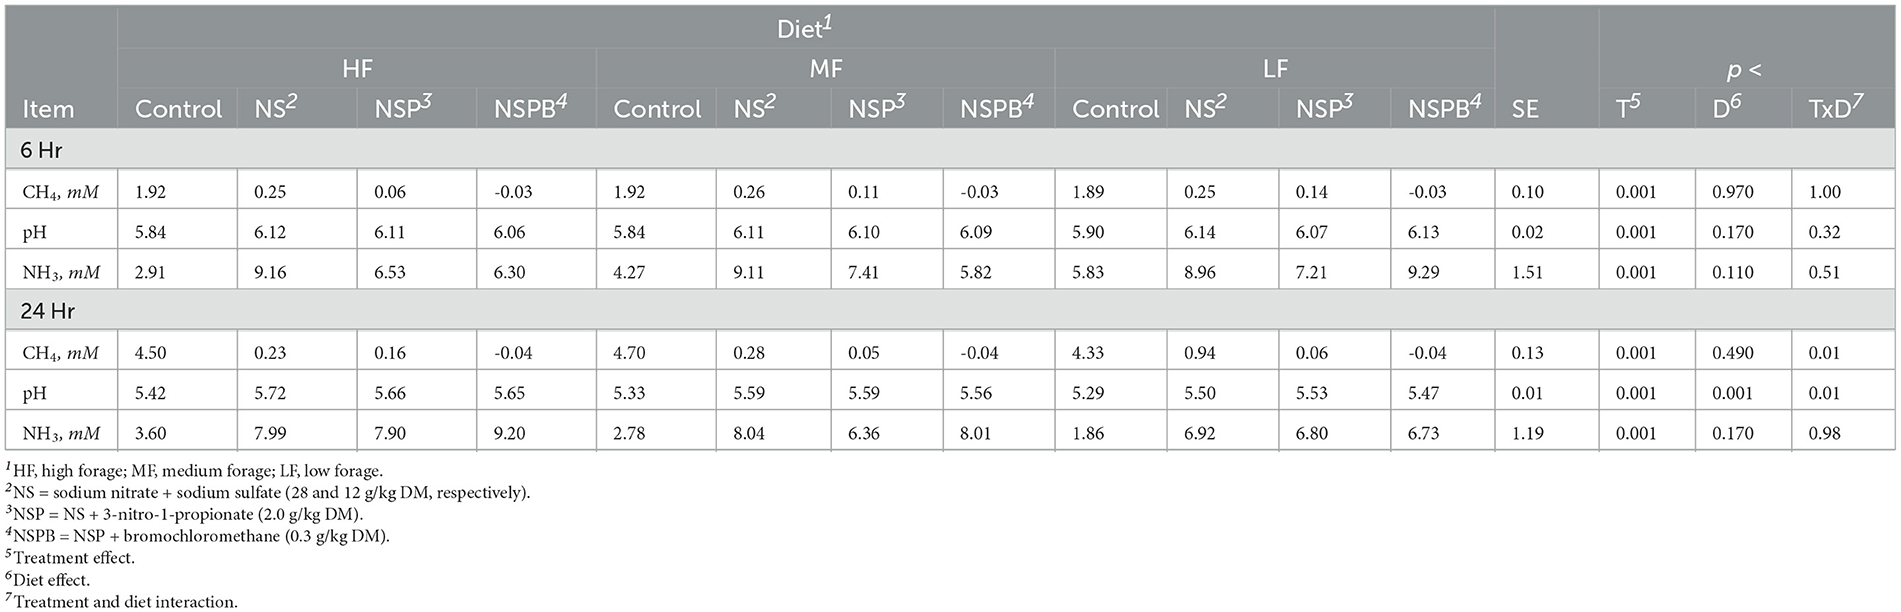
Table 6. Effects of treatments combining sodium nitrate (N), sodium sulfate (S), 3-nitro-1-propionate (P), and bromochloromethane (B) on methane (CH4), pH and ammonia (NH3) after 6, 12, and 24 h of incubation with rumen microbes in an in-vitro mixed batch culture system fed varying forege:concentrate (HF = 70:30, MF = 50:50, and LF = 30:70) in experiments 3 and 4.
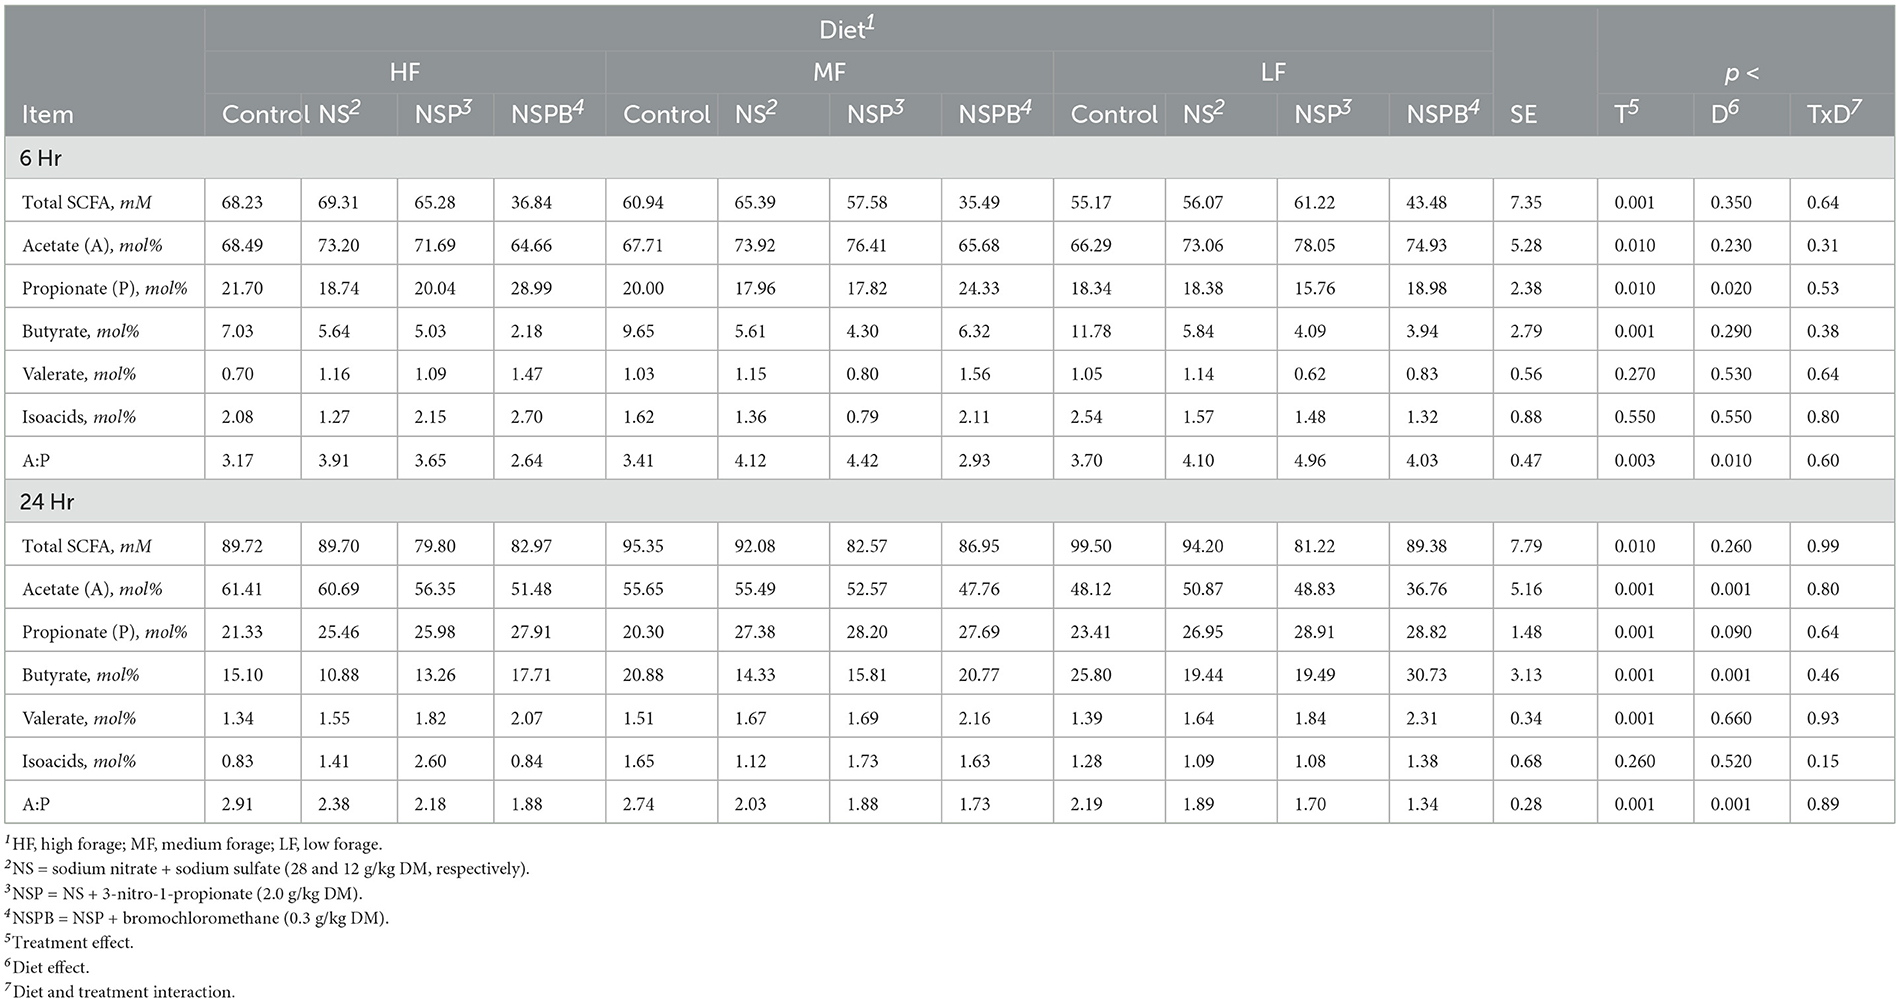
Table 7. Effects of treatments combining sodium nitrate (N), sodium sulfate (S), 3-nitro-1-propionate (P), and bromochloromethane (B) on short chain fatty acids (SCFA) after 6, 12, and 24h of incubation with rumen microbes in an in-vitro mixed batch culture system fed varying forege:concentrate (HF = 70:30, MF = 50:50, and LF = 30:70) in experiments 3 and 4.
At 24h, total SCFA in control cultures increased with an increase in the proportion of concentrate mix in the diet (Table 7). Acetate decreased and propionate and butyrate increased (p > 0.10) with an increase in dietary concentrate (Table 7). Molar proportions of valerate and isoacids were not affected (p > 0.10).
At 24h, there was an interaction between inclusion level of NaNO3 and diet on CH4 and culture pH (p < 0.01). All additive treatments decreased CH4 (p < 0.01) regardless of diet and increased (p < 0.01) pH and NH3 (Table 6). Methane decreased by 88, 97, and 99.5% on average by NS, NSP, and NSPB, respectively. Whereas the NSP treatment tended (p < 0.052) to increase H2, the NSPB increased (p < 0.028) H2 in the headspace of the culture bottles (Figure 1B).
There were significant effects (p < 0.01) of additives on fermentation profile. Diet had no effect (p > 0.10) on total SCFA. When averaged across diets, NSP decreased total SCFAs when compared with control (p < 0.007) and NS (p < 0.04); both NSP and NSPB decreased acetate when compared to the control and NS. All three additive treatments increased propionate when compared with the control, resulting in a decrease (p < 0.001) in the A:P ratio (Table 7). Cultures receiving the NSPB treatment had greater butyrate than those receiving the NS and NSP treatments. All treatments increased (p < 0.001) valerate while the NSP treatment increased (p < 0.05) isoacids in the HF diet compared to the control and NSPB treatment. The theoretical estimations of hexose metabolism, total metabolic hydrogen production, end-product, cellular, and total metabolic hydrogen recoveries were affected by the additive combinations (at least p < 0.01 across all of these estimations; Supplementary Table S11).
3.4 Amplicon sequencing data 3.4.1 Species richness and evenness (alpha-diversity) in culturesThere was no significant effect (p > 0.05) of diet, additive treatment, or interaction thereof on alpha-diversity indices (Supplementary Figures S1A, S2A). For experiments 1 and 2, only the Chao1 diversity tended to differ (p < 0.052) by treatment (Supplementary Figure S1A).
3.4.2 Community compositions (beta-diversity) in culturesAmong the control and highest inclusion levels of NaNO3, Na2SO4, 3NPA, and BCM in experiments 1 and 2, the treatment and diet individually altered the Bray-Curtis dissimilarity and weighted UniFrac distances (p < 0.05; Supplementary Figures S1B and S1C). The microbial communities between the control and NaNO3 were significantly different via the Bray-Curtis dissimilarity (p < 0.007) and weighted UniFrac distance (p < 0.001). On the other hand, the interaction term between treatment and diet changed (padj < 0.05) the Bray-Curtis dissimilarity and weighted UniFrac distances among the control and NS, NSP, NSPB treatments in experiments 3 and 4 (Supplementary Figure S2B). Microbial communities of NS (p < 0.03), NSP (p < 0.001), and NSPB (p < 0.04) treatments differed from that of the control via the Bray-Curtis dissimilarity, whereas only the NSP community differed (p < 0.003) from the control via the weighted UniFrac distance (Supplementary Figures S2B, C).
3.4.3 Differential abundance analysis of microbial taxaDifferential abundance analysis of microbial taxa between the control and respective additive treatments were conducted on the genus-species level. For this analysis via ANCOMBC2, we were only interested in the treatment effect averaged across diets. Significant results (p adj < 0.05) on the species level are shown for NaNO3, NS, NSP, and NSPB treatments in Figures 2A–D.
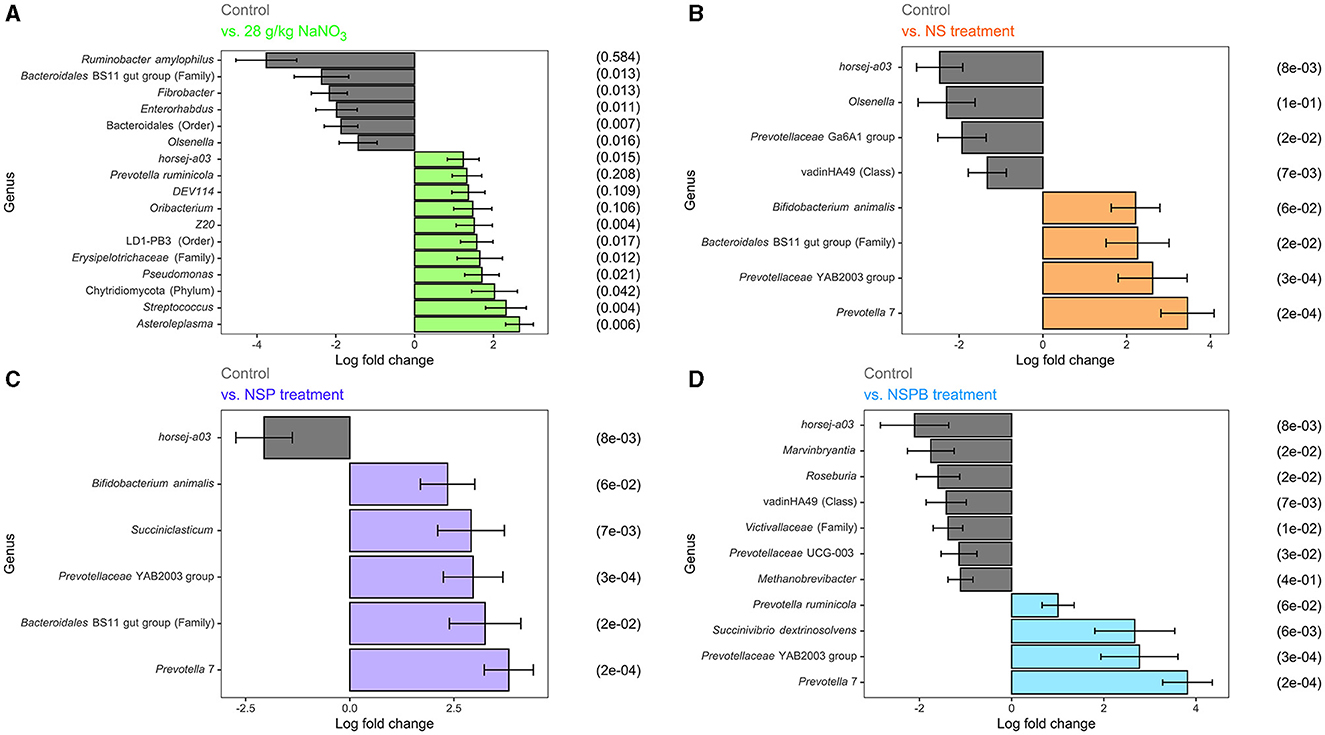
Figure 2. Effect of 28 g/kg DM sodium nitrate (NaNO3) and combination treatments with sodium nitrate + sodium sulfate (NS), NS + 3-nitro-1-propionate (NSP), and NSP + bromochloromethane (NSPB) on log fold change of microbial abundance on the species level after 24h of fermentation in vitro. Amplicon sequence variants (ASVs) were agglomerated at the lowest taxonomic level assigned. Taxonomy of these ASVs are annotated as follows. Genus and species are italicized; otherwise, the taxon of an unknown genus with its lowest available taxonomic rank (Family, Order, etc.) is indicated within parentheses. Using the ANCOMBC R package, log (ln) fold changes of differentially abundant taxa (padj < 0.05) between the control and: (A) 28 g/kg DM NaNO3; (B) combination of 28 g/kg DM NaNO3 and 12 g/kg DM Na2SO4 (NS); (C) combination of NS and 2.0 g/kg DM 3-nitro-1-propionate (NSP), and (D) combination of NSP and 0.30 g/kg DM bromochloromethane (NSPB). To the left of each subfigure is the relative abundance (%) of each taxon in the control group as a reference.
In experiments 1 and 2, the NaNO3 treatment affected the largest number of microbial taxa. On the species level, the addition of 28 g/kg of NaNO3 decreased (p adj < 0.05) the abundances of Ruminobacter amylophilus, unassigned taxa belonging to the family Bacteroidales BS11 gut group, Fibrobacter, Enterorhabdus, unassigned taxa belonging to the order Bacteroidales, and Olsenella and increased (p adj < 0.05) those of Asteroleplasma, Streptococcus, unassigned taxa belonging to the phylum Chytridiomycota, Pseudomonas, unassigned taxa belonging to the Family Erysipelotrichaceae, unassigned taxa belonging to the order LD-PB3, Z20, Oribacterium, DEV114, Prevotella ruminicola, and horsej-a03. On the other hand, the addition of 0.30 g/kg BCM increased (p adj < 0.05) Desulfovibrio and Megasphaera elsdenii. The addition of Na2SO4 and 3NPA had no effect (p adj > 0.10) on microbial taxa abundance.
In experiments 3 and 4, the addition of treatments from NS, NSP, and NSPB successively increased the number of differentially abundant microbial taxa compared to the control. The NS treatment decreased (padj < 0.05) the abundance of horsej-a03, Olsenella, Prevotellaceae Ga6A1 group, and unassigned taxa belonging to the class vadinHA49 and increased (padj < 0.05) Prevotella 7, Prevotellaceae YAB2003 group, unassigned taxa belonging to the family Bacteroidales BS11 gut group, and Bifidobacterium animalis. The NSP treatment decreased (padj < 0.05) horsej-a03 and increased (padj < 0.05) Prevotella 7, unassigned taxa belonging to the family Bacteroidales BS11 gut group, Prevotellaceae YAB2003 group, Succiniclasticum, Bifidobacterium animalis. Lastly, the NSPB treatment decreased (padj < 0.05) the abundances of horsej-a03, Marvinbryantia, Roseburia, unassigned taxa belonging to the class vadinHA49, unassigned taxa belonging to the family Victivallaceae, Prevotellaceae UCG-003, and Methanobrevibacter and increased (padj < 0.05) Prevotella 7, Prevotellaceae YAB2003 group, Succinivibrio dextrinosolvens, and Prevotella ruminicola.
3.4.4 Differential abundance analysis of predicted MetaCyc pathwaysDifferential abundance analyses of pathways predicted from the amplicon sequences were conducted between the control and each additive treatment via ANCOMBC2. In Experiments 1 and 2, 28 g/kg of NaNO3 decreased (padj < 0.05) the predicted pathway abundances of biotin biosynthesis II, L-glutamate degradation VIII to propanoate, TCA cycle VII of acetate-producers, and superpathway of polyamine biosynthesis I. Other additives did not affect (p adj > 0.10) pathway abundances.
In experiments 3 and 4, only the NSP and NSPB treatments affected pathway abundances. In the NSP treatment, polymyxin resistance was decreased (p adj < 0.05). The NSPB treatment decreased (p adj < 0.05) coenzyme B biosynthesis, archaetidylserine and archaetidylethanolamine biosynthesis, factor 420 biosynthesis, archaetidylinositol biosynthesis, CDP-archaeol biosynthesis, methanogenesis from H2 and CO2, 7-(3-amino-3-carboxypropyl)-wyosine biosynthesis, NAD salvage pathway II, phosphopantothenate biosynthesis II (archaea), mevalonate pathway II (archaea), and polymyxin resistance while increasing superpathway of L-arginine and L-ornithine degradation, superpathway of L-arginine, putrescine, and 4-aminobutanoate degradation, enterobacterial common antigen biosynthesis, and L-arginine degradation II (AST pathway) (Figure 3).
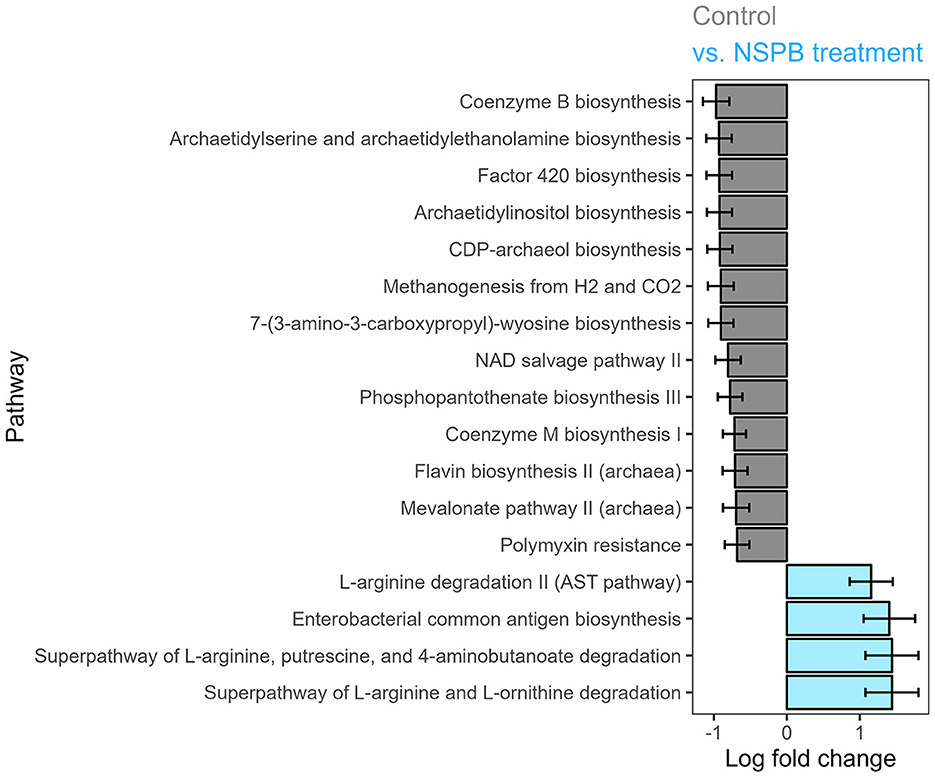
Figure 3. Effect of combination treatments with sodium nitrate (N), sodium sulfate (S), 3-nitro-1-propionate (P), and bromochloromethane (B) on log (ln) fold change of predicted MetaCyc pathway abundance on the species level after 24h of fermentation in vitro, calculated using the ANCOMBC package. Log fold changes of differentially abundant predicted pathways (padj < 0.05) between the control and combination of NaNO3, Na2SO4, 3-nitro-1-propionate, and bromochloromethane at 28, 12, 2.0, and 0.30 g/kd DM inclusion levels, respectively.
4 Discussion 4.1 NaNO3, but not Na2SO4, inhibits in-vitro methanogenesis in a dose-dependent mannerIn the anaerobic condition of the rumen, the economy of reduction and oxidation is managed through the microbial transaction of electrons as the currency. Plant carbohydrates
留言 (0)