
記住我


The study comprised 2,833 children and adolescents who attempted suicide during the studied period, with a mean age of 15.1 (SD = 1.6) years and a male to female ratio of 1:5.4.
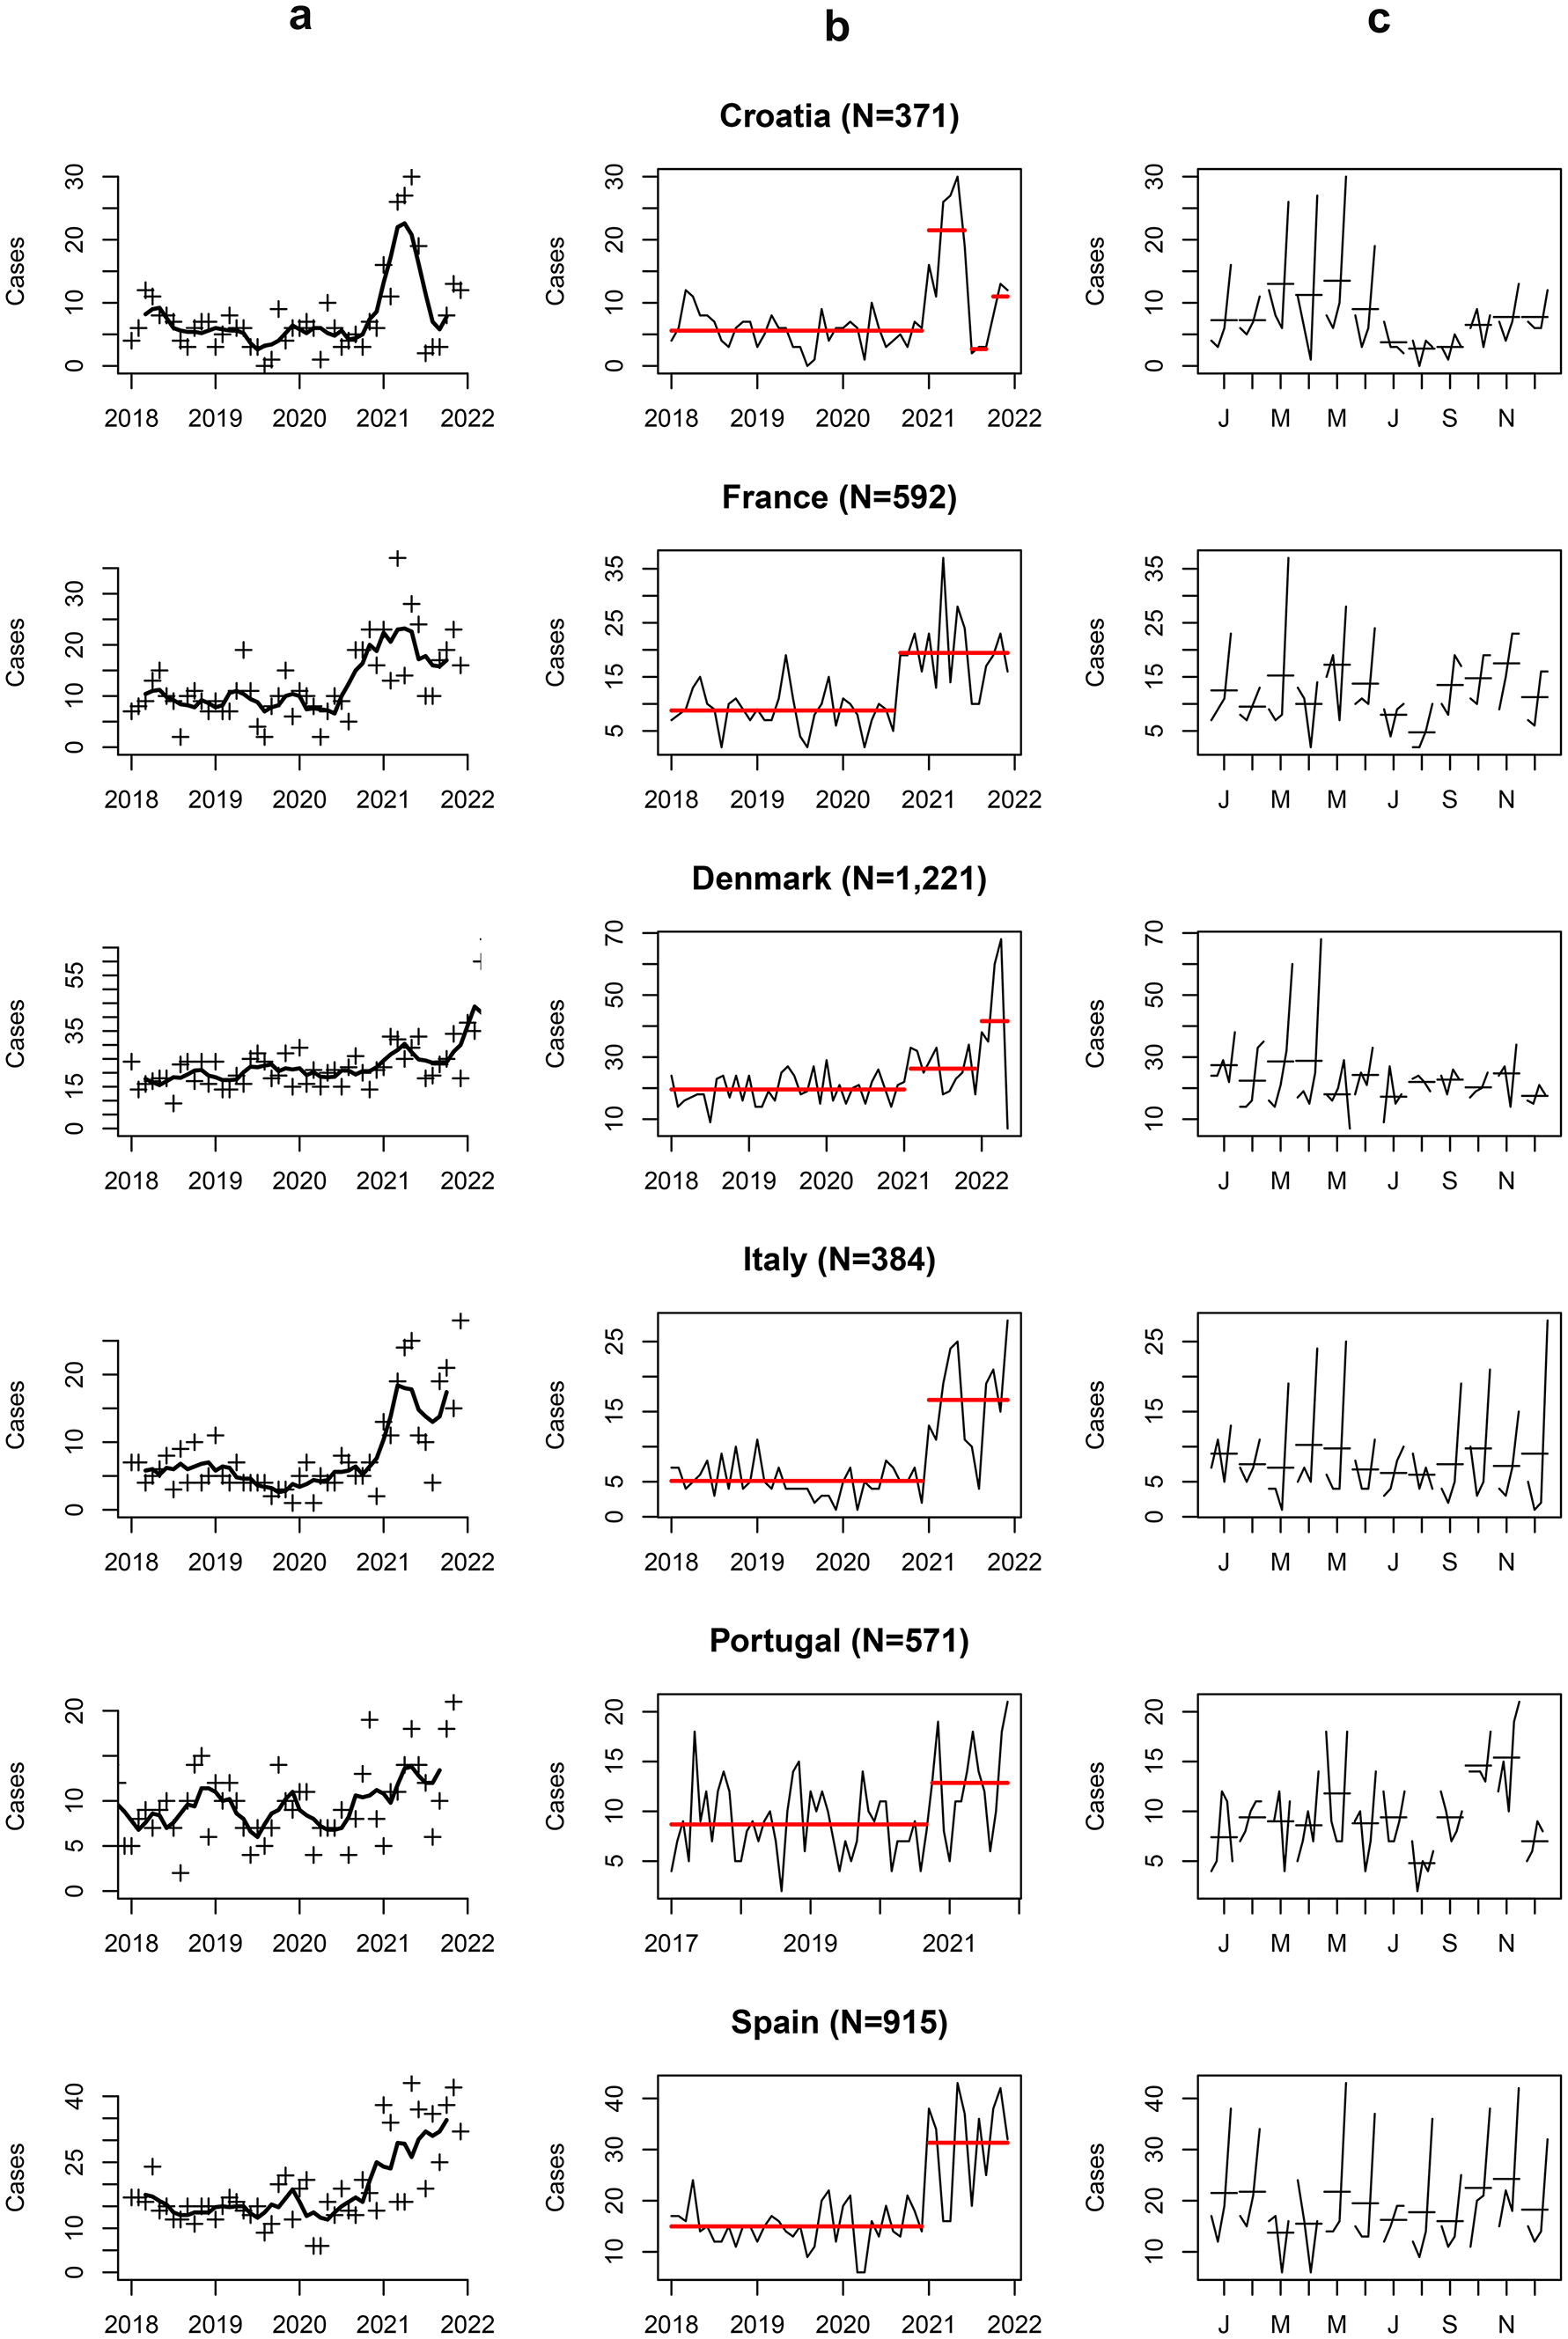
Trends in SA and changepoint detectionVariations in SA rates over time were detected when analyzing data for each country separately (Fig. 1a). The onset of the initial lockdown occurred at approximately the same date, March 2020, for all the participating countries. A significant increase (p < 0.05) in SA was observed in all countries after lockdown, but breakpoints differed: 6 months later (September 2020) for France and Portugal, and 10 months later (January 2021), for Croatia, Denmark, Italy, and Spain (Fig. 1b; Table 1). Plots of SA by months across the studied period (Fig. 1c) provided information regarding seasonal variations. Except for spring 2020, a peak in SA incidence was observed during spring and a nadir at the end of summer.
Fig. 1
Trends in variations of suicide attempts across included countries over the studied period. Denmark fluctuations concern females only. a Trends as captured by the mobile mean; b mean rupture as measured by change point; c Month plot of the studied period; each subplot corresponds to a specific month (e.g., January, February, etc.). Data points within each month are shown over the study period, allowing for the comparison of the same month across different years and the identification of outliers on a month-by-month basis
Table 1 Sample description per country according to the time-period (before and after the breakpoints)Children’s profile before and after the peakWe aimed to assess the clinical profile of children before and after the identified SA breakpoints. For Croatia, we brought together the last three periods (i.e., from January 2020), as the decrease observed in summer 2021 seemed temporary and matched with the seasonality expected in SA time-series [17, 18]. To a lesser extent, similar patterns were observed in Italy and France but not detected by the PELT algorithm. Results, organized by covariate, are comprised of (a) country-specific logistic regression models’ findings [univariate, Odds-ratio (OR); and multivariate, adjusted-OR (aOR)] (Table 2); and (b) multilevel logistic regression models’ findings (univariate, OR; and multivariate, aOR) (Table 3).
Table 2 Odds-ratios with 95% confidence intervals and p-values for univariate and multivariate country-specific logistic regression modelsTable 3 Odds-ratios with 95% confidence intervals and p-values for univariate and multivariate multilevel logistic regression modelsAgeCountry specific univariate models revealed trends (p < 0.20) regarding age in Croatia, Italy, Portugal and Spain, where younger children presented for SA at the hospital during the second period (OR = 0.86 [95% CI: 0.76–0.97], p = 0.017; 0.88 [95% CI: 0.76–1.01], p = 0.068, 0.92 [95% CI: 0.82–1.04], p = 0.19 and 0.92 [95% CI: 0.85–1.01], p = 0.071, respectively), where in France they were older during the second period (OR = 1.15 [95% CI: 1.03–1.28], p = 0.013). (Table 2). In the multivariate analysis children tended to be older during the second period in France (aOR = 1.2 [95% CI:1.06–1.36], p = 5.5e-3), but younger in Italy (aOR = 0.76 [95% CI: 0.63–0.91], p = 4.0e-3). (Table 2). In the multilevel analysis of the whole sample, compared with previously, children after the breakpoints tended to be younger (OR = 0.96 [95% CI: 0.91–1.01], p = 0.064) (Table 3), but the difference is modest, and significance is lost through multivariate model analysis.
SexThe proportion of females increased after SA breakpoints in all studied countries (Table 1). Yet, it only reached statistical significance in two countries, Croatia (OR = 4.61 [95% CI: 2.57; 8.75], p = 8.6e-7 and aOR = 6.32 [95% CI: 2.71; 16.91], p = 6.6e-5) and Spain (OR = 2.19 [95% CI: 1.45; 3.4], p = 3.0e-4 and aOR = 2.13 [95% CI: 1.4; 3.32], p = 5.5e-4) (Table 2). Multilevel analysis confirmed this highly significant (p < 0.01) trend (OR = 1.82 [95% CI: 1.45; 2.29], p = 2.1e-7); aOR = 1.77 [95% CI: 1.34; 2.34], p = 6.0e-5 (Table 3). Although females were overrepresented during the whole studied period, this significantly increased during periods of SA peaks.
SA methodsThe proportion of self-poisoning was lower in Croatia and France (aOR = 3.57 [95% CI: 1.96–6.66], p = 4.3e-5 and aOR = 1.84 [95% CI: 1.21–2.83], p = 4.9e-3, respectively) during the second period. Multilevel analysis confirmed this change and more SA methods “other than self-poisoning” (OR = 1.34 [95% CI: 1.10–1.63], p = 4.1e-3; aOR = 1.34 [95% CI: 1.05–1.7], p = 0.018) (Table 3) were used during the second period.
History of family mental illness and previous ER visitDuring the second period, children with SA were less likely to have a family history of mental illness in Portugal and Spain (aOR = 0.32 [95% CI: 0.120.81], p = 0.017 and aOR = 0.73 [95% CI: 0.55–0.96], p = 0.025 respectively) (Table 2). Multilevel analysis showed no significance in family history of mental illness between the two studied periods (Table 3). The proportion of those who had had a previous ER visit for SA did not change significantly across the studied periods, neither in single countries nor at the general level.
Impact of contingency measures in Europe and SA in childrenIn the univariate analysis, OxCGRT indicators related to contingency measures affected the incidence of SA. We identified ‘optimal lags’ for all indicators, associated with incidence rate ratios (IRR) significantly > 1, with the exception of restrictions of gatherings, international travels, and facial covering (Table S2 Supplementary Material). Among the quantitative variables, the highest IRR among the lagged indicator we explored was the monthly number of COVID-19 deaths (IRR = 1.28 [95% CI: 1.22–1.33], p = 1.7e-7) (Table S2) with a 3-months lag. When considering the qualitative variables, we obtained IRR > 3 for the restrictions on very large gatherings (IRR = 3.12 [95% CI: 1.40-; 4.84], p = 1.2e-3), quarantine arrivals from some or all regions (IRR = 4.6 [95% CI: 2.1; 7.11], p = 7.9e-5), and comprehensive contact tracing done for all identified cases (IRR = 3.05 [95% CI: 2.43–3.66], p = 1.5e-7) (Table S2). Finally, the forward selection process selected two indicators in the multivariate model. The first corresponds to the worsening of the pandemic which is represented in our study by the logarithmic number of COVID-19 deaths, and was associated with an increased number of SA (IRR = 1.13 [1.07; 1.2], p = 7.4e-4) after a 3-months delay. The second, the beginning of the pandemic, which is represented by the implementation of partial and complete contact tracing policies, that were associated with an increased number of SA after an 11-month delay (IRR = 1.37 [1.1; 1.65], p = 8.3e-3; IRR = 2.24 [1.71; 2.77], p = 1.5e-5, respectively) (Table 4; Fig. 2). We also observed that the model was significantly affected by seasonality, data overdispersion and, more importantly, there seem to be additional, country-specific factors that modulate the number of SA (Table 4).
Table 4 Parameters estimates with 95% confidence interval affecting significantly the risk of suicide attempts in children based on a negative-binomial regression modelFig. 2
Graphical representation—association between the environmental indicators and the number of SA over time by country. a Contact tracing with an 11-month lag (in red), and the number of SA reported (in black). 0 = no contact-tracing, 1 = not done for all cases, 2 = done for all identified cases. The variable was shifted by 11 months (lag used in the statistical analysis) to make the changes coincide with the number of SA observed. b Reported number of COVID-19 deaths on a logarithmic scale with a 3-month lag, in red, and the number of SA reported (in black). The variable was shifted by 3 months (lag used in the statistical analysis) to make the changes in value coincide with the number of SA observed
留言 (0)