
記住我


According to the United Nations 2019 World Population Prospects report, the world population will reach 8.5 billion in 2030 and 10.9 billion in 2100. Therefore, the demand for food and energy, and the amount of generated organic wastes (OWs) will continue to increase (Hoornweg et al., 2013). Currently, the burning of fossil fuels to produce energy generates about two-thirds of global greenhouse gas emissions (Energy and climate change — European Environment Agency, 2017). Moreover, the natural decomposition of OWs releases greenhouse gases directly into the atmosphere, which contributes to global warming. Thus, a large-scale application of ecological methods to treat OWs and produce energy without generating greenhouse gases is needed. Anaerobic digestion (AD) of OWs, which produces renewable energy while reducing OW volume and methane emissions, is well-suited for this purpose (Energy and climate change — European Environment Agency, 2017). The resulting methane (CH4) can be converted into heat and electricity and the other main output (called digestate) can be used to amend agricultural land (Fagerström et al., 2018).
The AD process is driven by a diverse community of microbes (mainly bacteria and archaea). In the absence of oxygen, AD comprises a series of complex microbiological processes, including hydrolysis, acidogenesis, acetogenesis, and methanogenesis (Manyi-Loh et al., 2013; Abdelgadir et al., 2014). Many parameters, such as temperature, pH, volatile fatty acid (VFA) concentrations and ammonia concentrations, affect the ability of microorganisms to convert biomass to methane and impact the bacterial composition of the end products (Al Seadi et al., 2008). The bacterial community structure in digestates is also influenced by the origin of the raw OWs used in the digestion process. Aigle et al. (2021) showed that two different bacterial structures are present in raw OWs depending on their origin. In urban OWs (mainly activated sludge), Proteobacteria and Bacteroidetes were the most abundant phyla. In contrast, agricultural waste (mainly manure), contained Firmicutes, Proteobacteria, and Bacteroidetes. After AD, taxa from activated sludge increased among urban digestates. In contrast, taxa from raw agricultural OWs decreased in agricultural digestates (Aigle et al., 2021). This reshuffling of the bacterial community indicates that the origin of raw OWs plays an important role in the final bacterial content of digestates. However, the fecal matters frequently used as feedstock for AD (activated sludge and manure) are often contaminated with pathogenic bacteria (Hutchison et al., 2004; Sidhu and Toze, 2009). Therefore, it is important to understand the impact of the AD process on the fate of pathogenic bacteria in different OWs.
To address this question, many parameters, such as temperature, pH, and hydraulic retention time, have been investigated (Avadí et al., 2022). Temperature is crucial in AD processes because it affects the richness and diversity of the microbial community in digestates (Gou et al., 2014). Thermophilic digestion (55°C) is assumed to be more efficient than mesophilic digestion (35°C) in reducing pathogens such as Escherichia coli and Salmonella spp. (Smith et al., 2005). Also, with a high residence time, batch reactors ensure better sanitation than continuously fed processes (Jiang et al., 2018, 2020).
Beside pathogenic bacteria, other indicators such as helminth eggs can be used to evaluate the sanitary quality of digestates. Soil transmitted helminth infections are particularly widespread in tropical and sub-tropical countries where lack of drinking water and inadequate sanitary conditions favor their transmission (Riaz et al., 2020). Pathways of contamination may involve contaminated water, soil amended with contaminated digestate, and food grown on that soil (Nag et al., 2019). While full-scale thermophilic digestion seems to be sufficient to inactivate helminth eggs (Seruga et al., 2020), mesophilic digestion can be insufficient (Harroff et al., 2019). In some regions (e.g., Latin America), AD is often operated under mesophilic or psychrophilic conditions using, e.g., low-cost plastic tubular digesters (Garfí et al., 2016; Tavera-Ruiz et al., 2023). In these conditions, regardless of the feedstock (cow manure alone or in combination with cheese whey, pig manure, food waste), the AD process was insufficient to eliminate helminth eggs, and viable eggs were found in digestates at concentrations ranging from 5 to 50 per 4 g (Cucina et al., 2021; Parra-Orobio et al., 2021). However, Parra-Orobio et al. (2021) highlighted the effect of the anaerobic reactor configuration (single vs. two-stage configurations) on the parasitological properties of digestates. Interestingly, the best quality digestates were obtained using the anaerobic two-stage configuration. These studies highlight the importance of considering the configuration of anaerobic reactors but also the origin of organic waste and the region of their production in the choice of indicators that could be used to evaluate the health quality of digestates.
However, previous studies have shown conflicting results regarding the fate of pathogenic bacteria, even in similar digestion conditions. For example, Tápparo et al. (2020) showed that, during batch lab-scale mesophilic digestion using agricultural waste as feedstock, E. coli enumerated at 5–6 logs CFU/mL in raw waste and Salmonella at more than 6 logs CFU/mL. Both bacteria were removed in digestates within 8–10 days. However, in similar conditions, Alfa et al. (2014) found that 30 days were needed to reduce coliforms by 1 log and were insufficient to completely remove Salmonella from digestates. While E. coli and Salmonella are often used to estimate the hygienization effect of AD, the fate of other pathogens usually detected in raw OW has rarely been investigated in digestates. These pathogens include Mycobacterium tuberculosis complex (Santos et al., 2015), Yersinia enterocolitica, Yersinia pseudotuberculosis (Falcão et al., 2004), and Acinetobacter baumannii (Seruga Music et al., 2017). In addition to their pathogenicity, these bacteria may carry antibiotic resistance genes (ARGs), conferring resistance to antibiotics commonly used to treat food-production animals, such as tetracycline and aminoglycosides (van Hoek et al., 2011). Microbial communities mainly acquire ARGs via horizontal transfer of mobile genetic elements (MGEs), such as plasmids, transposons, and integrons (von Wintersdorff et al., 2016). Several studies have reported that AD processes have a variable effect on MGEs and ARGs, depending on the feedstock and digestion conditions. For example, Zou et al. (2020) showed that the abundance of class 1 integrons (intI1) decreased by 0.9 log copies/g dry manure after 60 days of mesophilic digestion in batch lab-scale reactors. In contrast, in a feedstock composed of food waste and sewage sludge, intI1 increased from 10−4 to 10−3 gene copies/16S rRNA copies after 33 days of mesophilic digestion (Zhang et al., 2016). Similarly, the total abundance of seven tet genes significantly increased after mesophilic AD of tetracycline-spiked livestock manure (Agga et al., 2020). However, the abundance of the resistome and MGEs was reduced in municipal sludge after thermophilic AD, even under high oxytetracycline concentrations (Tian et al., 2019).
Therefore, the fate and distribution of different pathogens, MGEs, and ARGs remain unclear, and more research is required to assess the biosafety of digestates. In this study, we assessed 77 sanitary indicators, including pathogenic bacterial species and ARGs, as well as new indicators of health hazards, such as virulence factors carried by MGEs. We first validated detection by real-time PCR and quantification by droplet digital PCR (ddPCR) for 40 and 31 sanitary indicators, respectively, in raw OWs and digestates. We then investigated the sanitary performance of AD according to the type of process (feeding mode, number of stages, temperature, pH) and the nature of the raw OWs (fecal matter with or without supplementation with straw and/or zeolite).
2 Materials and methods 2.1 Sample collection from full-scale anaerobic reactorsWe selected three full-scale anaerobic OW treatment plants (Ter1, Ter2, and Ter3) with reactors representative of the most common treatment processes used in France. All reactors were fed with a similar OW of agricultural origin. The operating parameters of each reactor are described in Table 1. Three biological replicates including raw OWs (inputs) and digestates (outputs) were collected for each reactor, except Ter3, for which three input samples and five output samples were collected. All samples were transported on ice to the laboratory. For solid matrices (e.g., manure, silage), up to 24 sub-samples from different places were gathered to obtain a representative biological sample of 5 kg (dry mass). Each sample was mixed and then a homogenized 1 kg sample was collected. Liquid biological samples (e.g., slurry) were sampled from stirred tanks to obtain a representative 1 L sample. Samples were then mixed in a blender to obtain a composite sample of the raw OWs used to feed each reactor. Outputs were directly collected from the anaerobic reactors. All samples were stored at −20°C on the day of sampling.
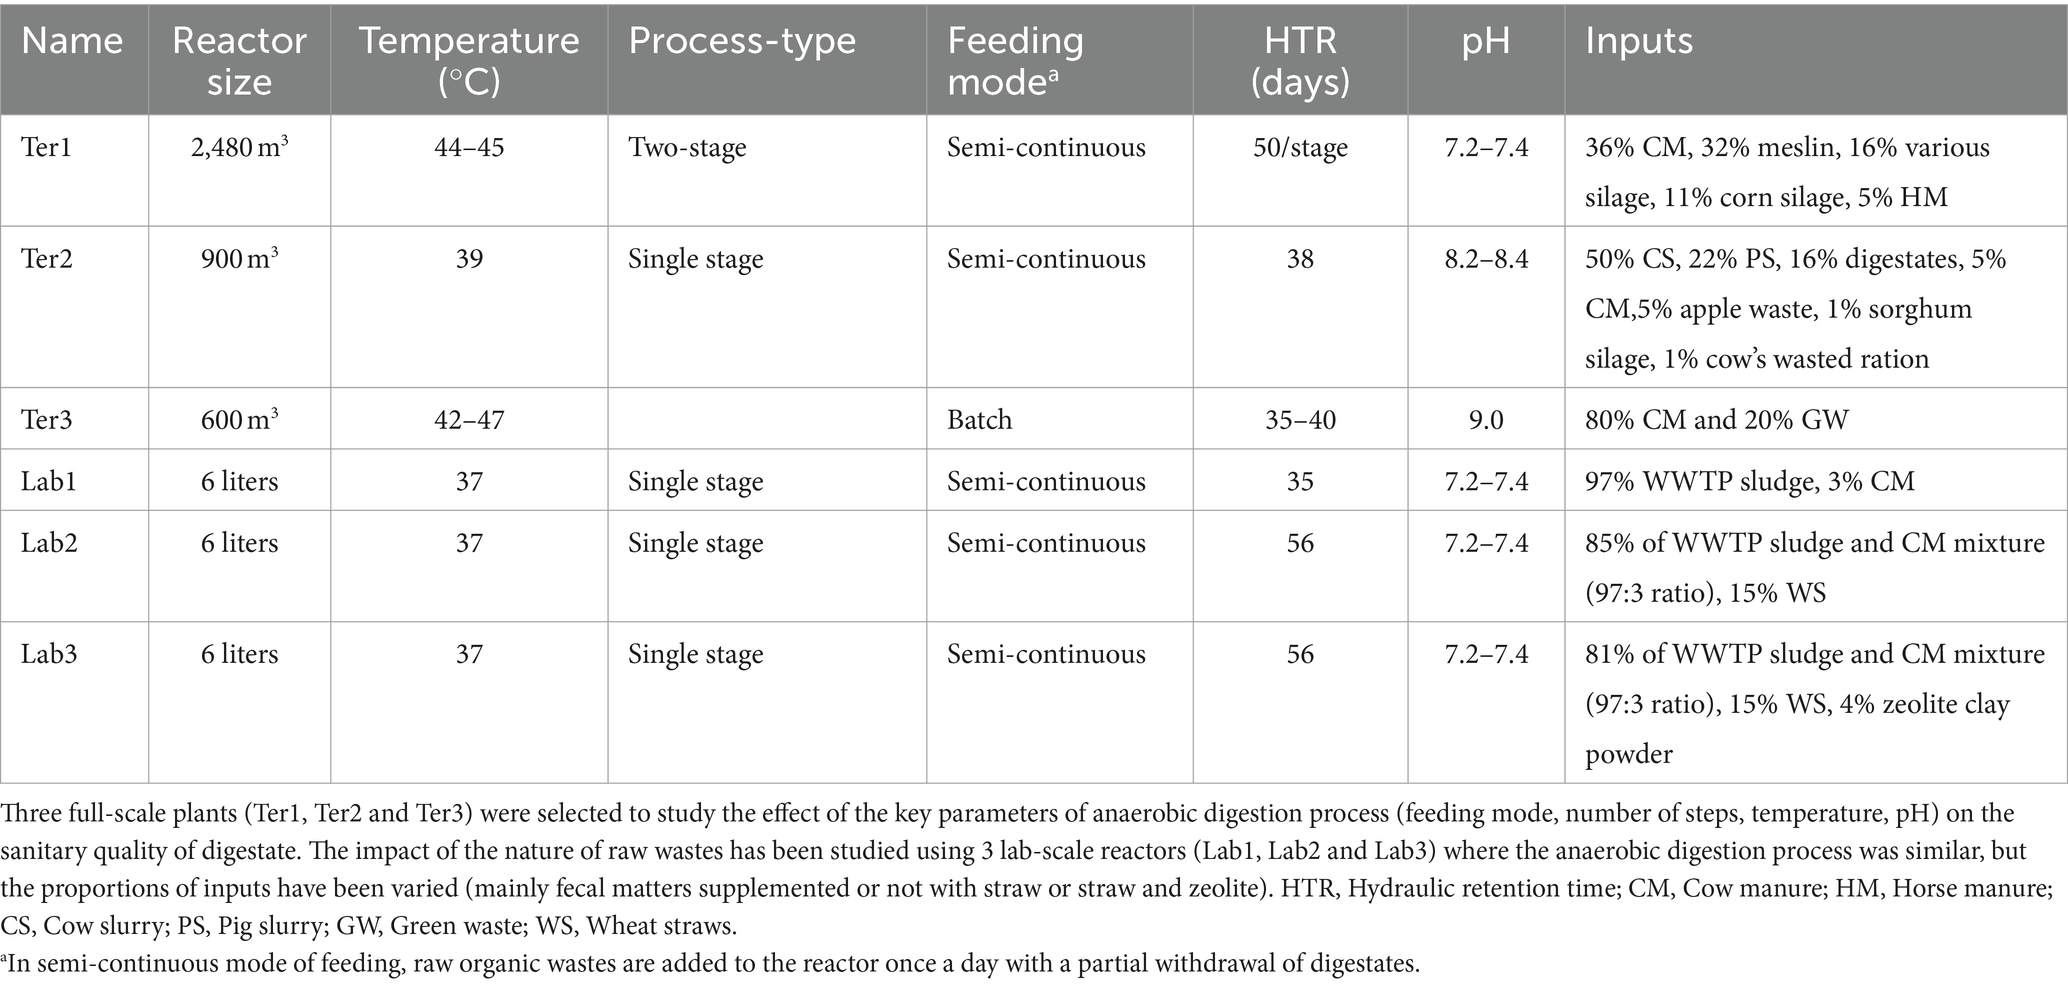
Table 1. Operating parameters of anaerobic reactors sampled in this study.
2.2 Sample collection from lab-scale anaerobic reactorsThe digestion experiment was conducted in three lab-scale (6 L) stainless steel reactors (Lab1, Lab2, and Lab3). Digested secondary sludge from a wastewater treatment plant (WWTP) in the center of France (285,000 population equivalents) was used to launch the AD process before starting the experiments. The reactors were continuously mixed at 90 rpm during at least three hydraulic retention time cycles at a constant 37.5°C maintained by hot water circulation (Table 1 and Supplementary Table S1). Lab1 was fed with 97% activated sludge (Limoges, France) considered as urban waste and 3% cow manure (farm in Chateauroux, France). Lab2 was fed with 85% of the same mixture, supplemented with 15% commercial wheat straw (WS). Lab3 was fed with 81% of the same mixture, supplemented with 15% WS and 4% zeolite powder (ZP) (aluminosilicate mineral, Merck, France). A frozen stock of WWTP activated sludge, cow manure, and wheat straws was kept at 4°C and used to manually feed the reactors each day to produce an equal amount of discharged digestates. Lab1 was run for 18 weeks with an organic loading rate of 2.8 g volatile solids (VS)/L/day. Lab2 and Lab3 were run for 38 weeks with the same organic loading rate for 12 weeks (2.8 VS/L/day), then, due to VFA accumulation, the organic loading rate was then lowered to 1.3 g VS/L/day until the end of the experiment (Supplementary Table S2). Analysis of volatile solids/dry matter (VS/DM) was continuously performed to assess matter reduction during treatment. Gas flow and composition and pH were also monitored (Aemig et al., 2019). After manual collection, digestates were kept at 4°C until mixing to obtain one sample per week. For Lab2 and Lab3, biological samples of inputs were collected on weeks 27, 35, and 40. Biological samples of digestates were collected on weeks 26, 34, and 38. For Lab1, inputs and outputs were collected on weeks 10, 14, and 17 (Supplementary Table S1). All samples were stored at −20°C.
2.3 Analysis of volatile solids/dry matterDry matter and volatile solids contents were measured in triplicate by calculating the mass difference after 24 h at 105°C and after an additional 2 h at 550°C. The remaining ashes were considered to be mineral matter (MM) (Supplementary Tables S2, S3). The pH was directly measured on liquid samples or according to ISO 10390.
2.4 Analysis of pharmaceutical products and polycyclic aromatic hydrocarbonsAnalysis of pharmaceutical products (PHPs) and polycyclic aromatic hydrocarbons (PAHs) were performed on samples from lab-scale anaerobic reactors. PAHs were extracted from a 1 g subsample according to Trably et al. (2004) and Mailler et al. (2017). Control matrices with known PAH concentrations were extracted in parallel. Solvent extracts were then evaporated and dissolved in 100% acetonitrile. Each extract was analyzed using a Waters Alliance 2,695 High-Performance-Liquid-Chromatography system coupled to a fluorescence detector as described by Sertillanges et al. (2020). Pharmaceutical products and biocides were extracted using the method described by Ferhi et al. (2016). Ultrasonic extraction was performed only on dry matter. Sludge was extracted in an acetonitrile/McIlvaine buffer/EDTA mix. After purification, pharmaceutical products and biocides were quantified in samples using high-performance liquid chromatography and mass spectrometry with a Xevo TQD Triple Quadrupole mass spectrometer (Waters). In order to assess both purification/extraction losses and potential matrix effects in mass spectrometry (MS), the compound concentrations were determined by internal quantification-isotope dilution as described by Sertillanges et al. (2020). Limits of quantification (LOQs) for each compound were estimated as the concentration corresponding to a signal-to-noise ratio of 10. Limits of detection (LODs) were considered equivalent to LOQ/3. Concentrations of all organic micropollutants are expressed on a DM basis.
2.5 DNA extractionThree independent DNA extractions per sample were performed using the FastDNA Spin Kit For Soil (MP Biomedicals), following the manufacturer’s instructions. DNA quantity and quality were measured using a NanoDrop One (Eurobio Scientific) and then kept at −20°C until further analysis. All DNA used in this project was tested for the presence of PCR inhibitors as described in Voisin et al. (2020). Briefly, 2 μL of plasmid carrying the intI2 gene (105 copies per μl) was added to 16 μL of Brilliant II SYBR® Green QPCR Master Mix (Agilent) and 2 μL of target DNA. The number of cycles required to observe a significant signal was compared with that of samples containing only the plasmid with the intI2 gene and the real-time PCR (RT PCR) mix. Samples were processed in the same way as for real-time PCR (see section 2.6). When a higher number of cycles was required to obtain a signal, indicating potential PCR inhibition, DNA samples were diluted by 5- or 10-fold and another run was realized to confirm the absence of PCR inhibition after dilution.
2.6 Real-time PCRReal-time PCR was used to detect specific DNA fragments from the targeted sanitary indicators in inputs and outputs from anaerobic reactors. The 20 μL real-time PCR reaction mix contained a final concentration of 500 nM of forward and reverse primers, 10 μL of Brilliant II SYBR® Green QPCR Master Mix (Agilent), and 2 μL of target DNA. Amplification was run on a CFX96™ Real-Time System (BioRad) thermal cycler. The steps for real-time PCR amplification were as follows: 1 cycle at 95°C for 10 min; followed by 40 cycles of 95°C for 15 s and an amplification step for 30 s at optimal hybridization temperature for each primer pair (Supplementary Table S4). Melting curve analysis was conducted between 65°C and 95°C with 0.5°C increments and 5 s/increment. Negative controls were performed in triplicate for each run, using H2O instead of DNA. A list of the primers used, the expected size of each amplified DNA fragment, and hybridization temperatures are shown in Table 2 and Supplementary Table S4. All primers were synthesized by Invitrogen (Paris, France).
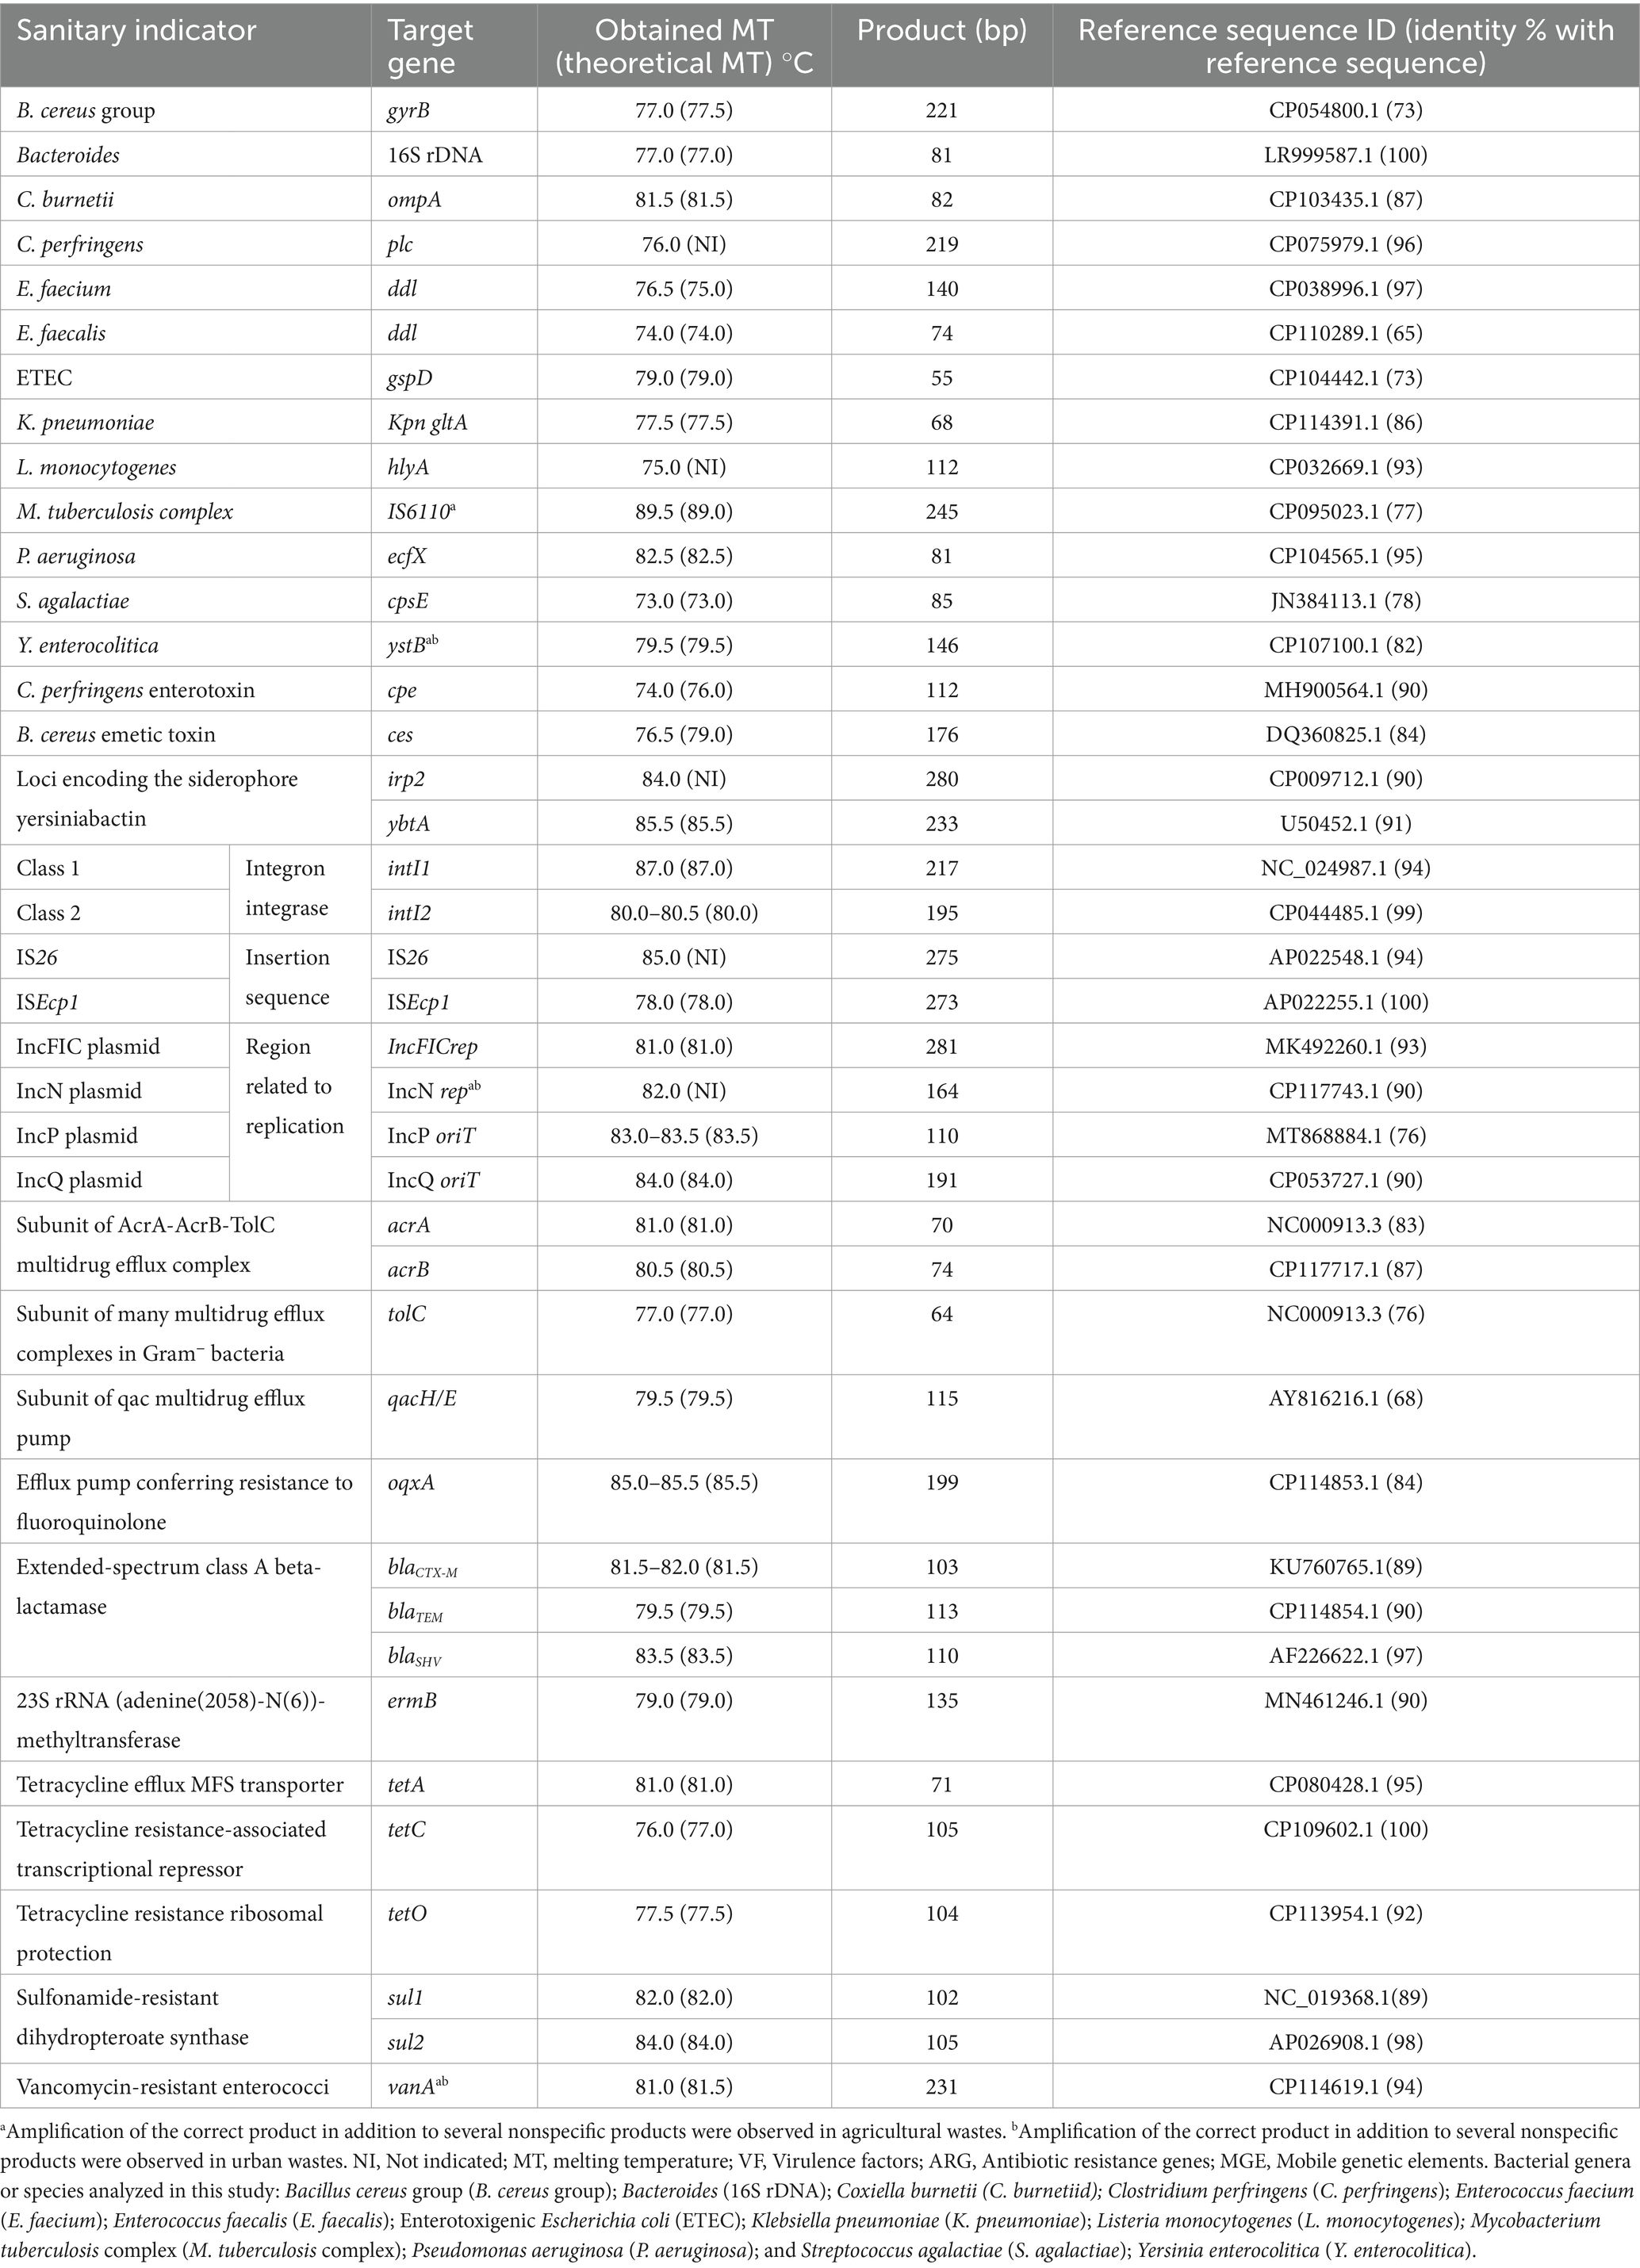
Table 2. Specific detection by real-time PCR of 40 sanitary indicators of public health concern in organic waste bacterial communities from agricultural and urban origin.
2.7 Sequencing of PCR products and validation of primer specificityThe identities of amplified gene targets were evaluated through analysis of the melting curve. For each run, the size of the amplified DNA fragment was estimated after electrophoresis at 6 v/cm using a TBE buffer [89 mM Tris-borate, 89 mM boric acid, and 2 mM EDTA (pH 8.0)] through a 2% (w/v) agarose gel. A 50 bp DNA ladder from Thermo Scientific was used as a molecular weight marker. Gels were imaged and analyzed using Molecular Imager Gel Doc XR+ (BioRad, France). Then, at least one replicate from the positive sample was submitted for Sanger sequencing with the forward and/or the reverse primer (GenoScreen, France). Our samples were only considered positive for targeted genes if they demonstrated all of the following: (1) no-template controls performed as expected; (2) the DNA sample displayed an amplification curve; (3) the DNA sample displayed the expected melting curve peak; (4) the DNA sample displayed the expected DNA size on agarose gel, and (5) Sanger sequencing produced a clean chromatogram that matched the expected sequence for each gene with a high similarity percentage. To estimate the similarity percentage between the amplified sequence and the target sequence, sequenced DNA was compared with reference sequences of each targeted gene obtained from the NCBI database (Table 2). For each sample that met all of these criteria, the corresponding DNA was considered positive and specific for the prevalence real-time PCR assay (Supplementary Table S4). If any of these criteria was not met, the sample was included in prevalence analysis but was removed from the ddPCR quantification assay (Table 2).
2.8 Droplet digital PCRAbsolute quantification of targeted genes was performed in a QX200 Droplet Digital PCR System (Bio-Rad Laboratories, CA), according to the manufacturer’s instructions (Hindson et al., 2011). Each test was prepared in 22 μL of the reaction mixture, which contained 11 μL QX200 EvaGreen ddPCR Supermix (2X), 1.1 μL forward primer (2 μM), 1.1 μL reverse primer (2 μM), 4 μL target DNA, and 4.8 μL H2O. Negative controls without DNA template were performed in duplicate for each ddPCR run. For microdroplet generation, 70 μL droplet generation oil and 20 μL mixture were added to the DG8™ cartridge (Bio-Rad), then loaded into a QX200 Droplet Generator (Bio-Rad). Then, microdroplets were transferred to a ddPCR 96-well plate and heat-sealed with an aluminum film. PCR was performed in a T100 (BioRad) thermal cycler under the following conditions: 95°C for 5 min; followed by 40 cycles of 95°C for 30 s and hybridization/elongation temperature for 60 s. The post-cycling protocol (signal stabilization) was 4°C for 5 min and 90°C for 5 min. After amplification, droplets were kept at 4°C. Finally, the fluorescence signal in each microdroplet was quantified by the QX200 Droplet Reader (BioRad) and analyzed with QuantaSoft software Version 1.7.4 (BioRad) (Cheng et al., 2019; Zeng et al., 2020).
2.9 Statistical analysisStatistical analysis was performed using Rstudio software (R version 4.1.3). Principal component analysis was performed using FactoMineR v2.7 package (Lê et al., 2008) and missing values were imputed using the missMDA v1.18 package (Josse and Husson, 2016). Kruskal-Wallis non-parametric tests with Dunn’s post-hoc tests were performed on PHP and PAH concentrations. Fisher tests were performed on the prevalence measurements of the sanitary indicators to compare the inputs and outputs. Values of absolute abundance equal to 0 were replaced by 0.1 and data were log10 transformed before statistical analysis. To test the influence of the technological process or the nature of raw waste on the absolute abundance of sanitary indicators, generalized linear models (GLMs) were fitted with a gamma likelihood [formula: Absolute abundance ~ Process or nature of raw waste * Nature of the sample (input or output)]. Pairwise comparisons between inputs and outputs of each reactor were performed using the estimated marginal means and p-values were adjusted using Bonferroni’s Holm method with emmeans_test function from rstatix package. For statistical analysis, p < 0.05 was considered to be statistically significant.
3 Results 3.1 Physico-chemical characterization of raw organic wastes and digestatesThree full-scale reactors (Ter1, Ter2, Ter3) representative of the most common AD processes used in France were identified in the Auvergne Rhône-Alpes region. Samples were collected from these reactors to investigate the effect of different AD processes. The impact of the type of OW input was studied using three lab-scale reactors (Lab1, Lab2, Lab3), in which the AD process was fixed and the proportions of inputs were varied (for more details, see Table 1). The key parameters of each reactor and the physicochemical characteristics of the OWs were measured (Table 1 and Supplementary Tables S2, S3). The average pH was 7.3 for the Ter1, Lab1, Lab2, and Lab3 reactors. The Ter2 and Ter3 reactors had a more basic pH (8.3 for Ter2 and 9.0 for Ter3). OWs from Ter1 and Ter2 had similar dry matter content (20.8 and 17.1%, respectively), while the input from Ter3 had a higher dry matter content (26.9%). Organic matter represented between 69 and 76% of the dry matter in the inputs of the three full-scale reactors (Ter1, Ter2, and Ter3). A significant decrease (16.2%) in the amount of organic matter in the outputs, compared with the inputs, was observed in Ter3 (batch reactor). This decrease was significantly lower for the semi-continuous reactors Ter1 and Ter2 (0.8 and 3.9%, respectively). This reduction can be explained by the partial transformation of organic matter into biogas (in the form of CO2 and CH4) during the AD process. For the laboratory-scale reactors, the percentage of dry matter was lower, ranging from 6.7% (Lab2, with added straw), to 8.2% (Lab1) and 8.3% (Lab3, with added straw and zeolite powder). The amount of organic matter in the dry matter was between 72.5% (Lab3) and 85.0% (Lab2). The decrease in organic matter after AD was higher in the Lab1 reactor (8.2%) than in the Lab2 and Lab3 reactors (3.8 and 1.3%, respectively).
3.2 Organic micropollutants in raw organic wastes and digestatesThirteen PHPs, including seven antibiotics (three from the fluoroquinolone-quinolone family, three from the tetracycline family, and trimethoprim), one antidepressant (fluoxetine), one antiepileptic (carbamazepine), two anti-inflammatories (diclofenac and ibuprofen), and two antibacterial molecules (triclosan and triclocarban), were measured in raw OWs and digestates from the laboratory reactors Lab1, Lab2, and Lab3 (Supplementary Table S5). In addition to the PHPs, thirteen PAHs were also identified (Supplementary Table S6). Principal component analyses (PCAs) were performed on both types of pollutant (PAHs and PHPs, Figure 1). The first two axes of these PCAs explain a significant portion of the variability (84.1%) among reactors. The first component alone explains 73.9% of this variability and is correlated with PHP and PAH concentrations. Lab1 samples (raw OWs and digestates) were differentiated from Lab2 and Lab3 samples by higher concentrations of both pollutants. Kruskal-Wallis non-parametric tests with Dunn’s post-hoc tests were performed to further investigate the observed distributions (Supplementary Tables S5, S6).
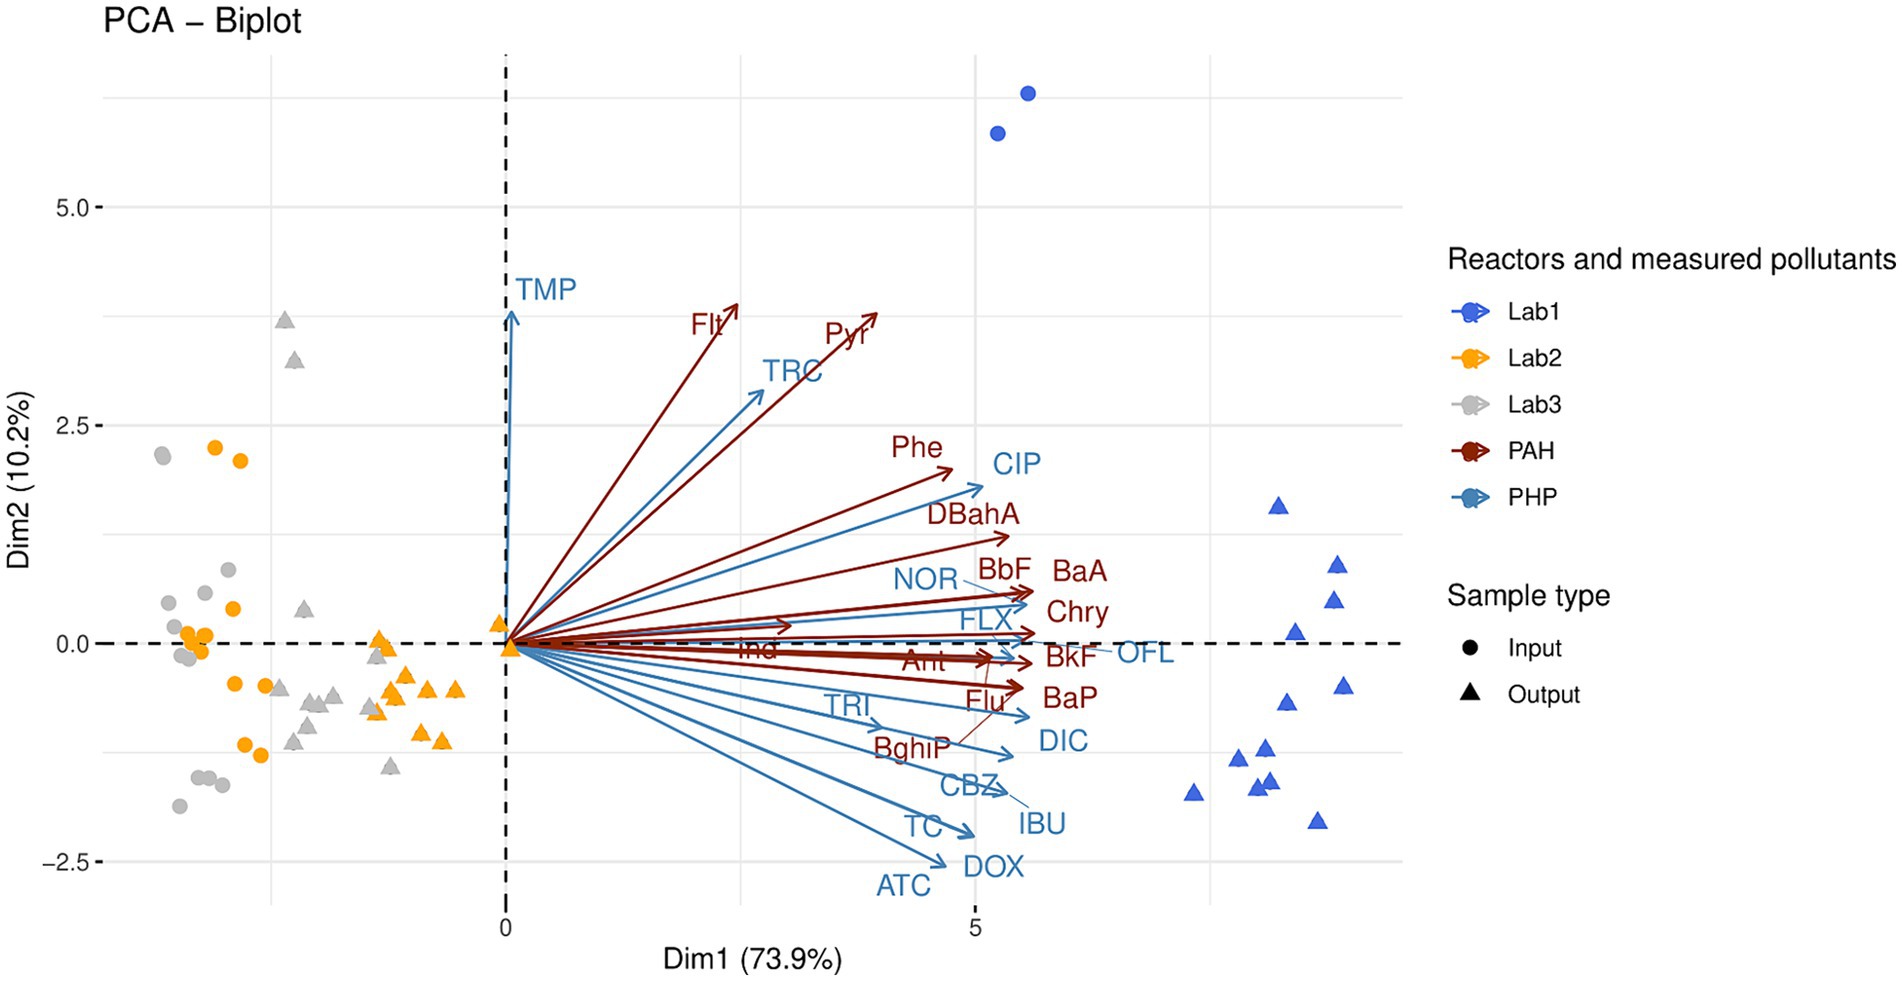
Figure 1. Principal component analysis of 13 polycyclic aromatic hydrocarbons (PAH) and 13 pharmaceutical products (PHP) measured in the raw organic wastes (input) and their corresponding digestates (output). The anaerobic digestion process was similar in the three reactors (Lab1, Lab2, and Lab3) but the proportions of inputs varied (see Table 1 for more information on operating parameters of Lab1, Lab2, and Lab3). Kruskal-Wallis non-parametric tests with Dunn’s post-hoc tests were performed to further investigate the observed distributions (see text and Supplementary Tables S5, S6). Abbreviations of polycyclic aromatic hydrocarbons: Anthracene (Ant); Benzo.a.Anthracene (BaA); Benzo.a.Pyrene (BaP); Benzo.b.Fluoranthene (BbF); Benzo.g.h.i.Perylene (BghiP); Benzo.k.Fluoranthene (BkF); Chrysene (Chry); DiBenzo.a.h.Anthracene (DBahA); Fluoranthene (Flt); Fluorene (Flu); Indeno.1.2.3.c.d.Pyrene (Ind); Phenanthrene (Phe); Pyrene (Pyr). Abbreviations of pharmaceutical products: Norfloxacin (NOR); Ofloxacin (OFL); Ciproflaxin (CIP); Doxycycline (DOX); Tetracycline (TC); Anhydrotetracycline (ATC); Trimethoprim (TMP); Fluoxetine (FLX); Carbamazepine (CBZ); Diclofenac (DIC); Ibuprofen (IBU); Triclosan (TRI); Triclocarban (TRC).
The Lab1 samples (digested or not) could be differentiated from both Lab2 and Lab3 samples by a set of pollutants, including 11 PHPs (norfloxacin, ofloxacin, ciprofloxacin, doxycycline, tetracycline, anhydrotetracycline, fluoxetine, carbamazepine, diclofenac, ibuprofen, and triclosan), and 11 PAHs (anthracene, benzo(a)anthracene, benzo(b)fluoranthene, benzo(ghi)perylene, benzo(k)fluoranthene, chrysene, dibenzo(ah)anthracene, fluorene, phenanthrene, and pyrene, KW– Dunn’s post hoc tests; p < 0.05, Supplementary Tables S5, S6). Interestingly, AD had a moderate impact on the concentration of norfloxacin in Lab1 and on the concentration of trimethoprim in both Lab1 and Lab2. The concentration of the other PHPs was not significantly impacted by this process. Therefore, their concentrations in raw OW samples were compared between the three reactors Lab1, Lab2, and Lab3 (Supplementary Table S5). Ibuprofen and triclosan were only detected in Lab1 inputs, at 43.4 ± 3.3 μg/kg and 2100.0 ± 707.1 μg/kg, respectively. Moreover, compared with Lab2, Lab1 showed significantly higher concentrations (p < 0.05) of two other PHPs: norfloxacin (1318.6 ± 36.5 μg/kg in Lab1 vs 132.4 ± 20.0 μg/kg in Lab2) and fluoxetine (51.2 ± 5.7 μg/kg in Lab1 vs 17.3 ± 6.9 μg/kg in Lab2). Compared with Lab3, Lab1 also showed significantly higher concentrations of ciprofloxacin (2645.7 ± 205.9 μg/kg in Lab1 vs 775.7 ± 85.7 μg/kg in Lab3), anhydrotetracycline (41.9 ± 16.9 μg/kg in Lab1 vs 0.0 μg/kg in Lab3), and diclofenac (123.9 ± 9.7 μg/kg in Lab1 vs 38.7 ± 10.5 μg/kg in Lab3). Finally, ofloxacin, doxycycline, tetracycline, trimethoprim, and carbamazepine were significantly higher in Lab1 and Lab2 inputs, compared with Lab3.
PAH concentrations were also compared between the three reactors Lab1, Lab2, and Lab3. Generally, the overall PAH concentration (sum of the 13 PAHs measured in this study) was higher in raw OWs used to feed Lab1 (1274.9 ± 11.7 μg/kg) than in raw OWs supplemented with straw and used to feed Lab2 (426.9 ± 63.3 μg/kg) or raw OWs supplemented with straw and zeolite and used to feed Lab3 (422.4 ± 58.8 μg/kg). After AD, the PAH concentrations were unchanged in Lab1 outputs (1297.7 ± 137.8 μg/kg), but were increased in Lab2 (678.7 ± 58.9 μg/kg, p < 0.01) and Lab3 (607.5 ± 103.0 μg/kg, ns) outputs, compared with PAH concentrations in the respective raw OW of each reactor (Supplementary Table S6).
3.3 Impact of anaerobic digestion on sanitary indicators 3.3.1 Specific amplification of sanitary indicators in organic waste bacterial communities from agricultural and urban originWe validated specific real-time PCR amplification of 40 of the 77 sanitary indicators tested in raw OWs, and digestates, from agricultural and urban origin (Table 2 and Supplementary Table S4). These PCR assays targeted: (1) bacterial pathogens; (2) virulence genes; (3) MGEs; and (4) ARGs. Four sanitary indicators (the EHEC hemolysin operon, the insertion sequence IS6/257, A. baumanii, and Salmonella hadar) were not detected in the OW samples (n = 38) analyzed in this study (Supplementary Table S4). Targeted genes from 13 pathogenic species/genera, four virulence factors, eight MGEs, and 15 ARGs were specifically amplified in at least one sample (Table 2). Their specific amplification was evaluated by melt curve analysis and amplicon length estimated on agarose gel electrophoresis. Moreover, the specificity of each target gene was validated by nucleotide sequence analysis of at least one amplified product. Obtained sequences were closely related (more than 68%) to accurate annotated bacterial genes present in GenBank as verified by Clustal Omega multiple sequence alignments (Table 2).
Only primer pairs that produced a unique product verified by real-time PCR were used in ddPCR assays to quantify the target gene. This is because fluorescence linked to the amplification of nonspecific products can be identified in real-time PCR, but not in ddPCR. Thus, Y. enterocolitica, IncN, and vanA could not be analyzed by ddPCR because we observed real-time PCR amplification of several products in samples from agricultural and urban origin (Table 2). Furthermore, as acrA, acrB, and tolC genes are part of the same multidrug efflux complex, only tolC subunit primers were used to investigate this mechanism by ddPCR. Of the three genes implicated in tetracycline resistance tetA (encoding for efflux protein), tetO (encoding for ribosomal protection protein), and tetC (resistance-associated transcriptional repressor) only tetA and tetO were investigated by ddPCR.
3.3.2 Prevalence of sanitary indicators in raw organic wastes and digestatesWe compared the prevalence of the 40 validated sanitary indicators in raw OWs and digestates after AD (Figure 2 and Supplementary Table S7).
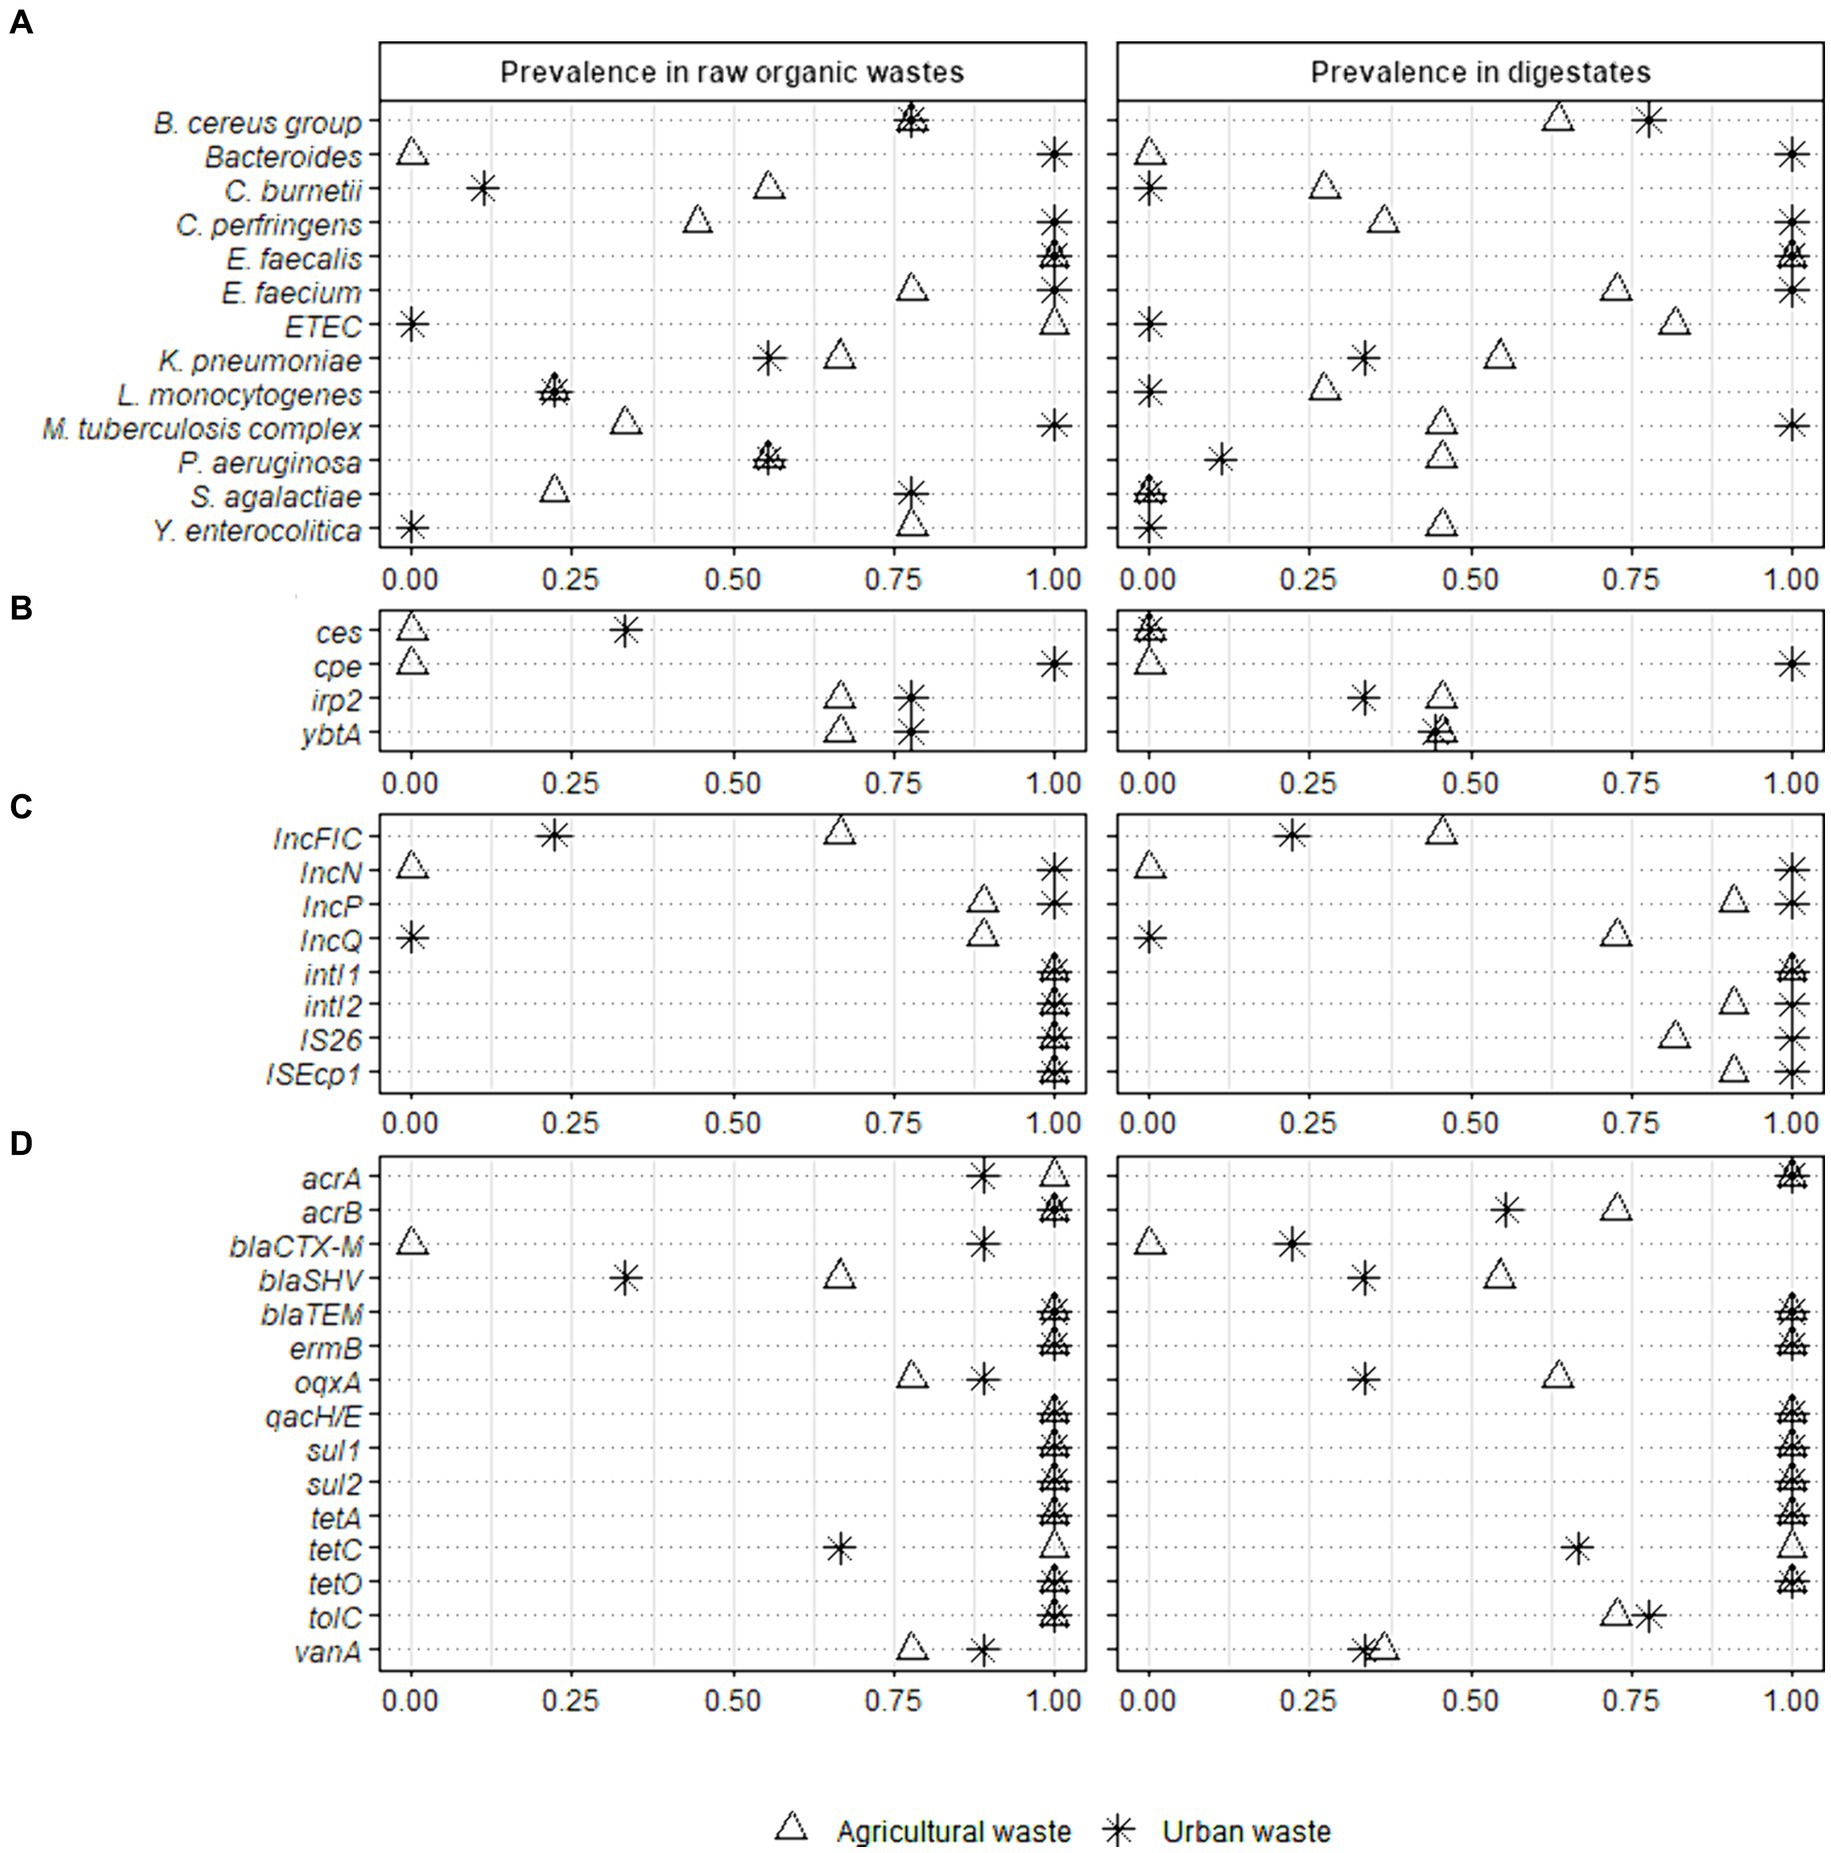
Figure 2. Prevalence of 40 sanitary indicators of public health concern in raw organic wastes from agricultural and urban origin and their derivative digestates. Full-scale reactors (Ter1, Ter2, and Ter3) were used to study the effect of the key parameters of anaerobic digestion while lab scale reactors (Lab1, Lab2, and Lab3) were used to investigate the impact of the nature of raw wastes on the sanitary quality of digestates. Fisher test was performed on raw organic wastes from agricultural (n = 9) and urban (n = 9) origin versus their respective digestates (11 and 9 samples analyzed from agricultural and urban origin, respectively) (* p < 0.05; ** p < 0.01). The sanitary indicators were classified into 4 categories: (A) bacterial genera or species, (B) virulence factors genes, (C) mobile genetic elements, and (D) antimicrobial resistance genes (see Table 2 for more information on these indicators genes).
3.3.2.1 Sanitary indictors in raw organic wastesThe 40 indicators were classified into three categories according to their prevalence in raw OW samples (n = 18): (i) high prevalence (found in more than 75% of samples); (ii) medium prevalence (found in 25 to 75% of samples); (iii) low prevalence (present in less than 25% of analyzed samples), or absence (Figure 2 and Supplementary Table S7). The E. faecalis, E. faecium, and B. cereus group had a high prevalence (1.00, 95% CI 0.82–1.00; 0.89, 95% CI 0.67–0.97; and 0.78, 95% CI 0.55–0.91, respectively) in all raw OW samples (Supplementary Table S7). In contrast both Y. enterocolitica and enterotoxigenic E. coli (ETEC) were found only in raw agricultural wastes (0.78, 95% CI 0.45–0.94 and 1.00, 95% CI 0.70–1.00, respectively), and were not detected in wastes mainly composed of WWTP sludge (Figure 2 and Supplementary Table S7). Also, 25 to 75% of raw agricultural waste samples (n = 9) were positive for Klebsiella pneumoniae (0.67, 95% CI 0.35–0.88), Clostridium perfringens (0.44, 95% CI 0.19–0.73), Pseudomonas aeruginosa (0.56, 95% CI 0.27–0.81), the M. tuberculosis complex (0.33, 95% CI 0.12–0.65), and Coxiella burnetii (0.56, 95% CI 0.27–0.81, Figure 2 and Supplementary Table S7). Listeria monocytogenes and Streptococcus agalactiae were found with a low prevalence (<25%), while Bacteroides were not detected in the raw agricultural samples from the three full-scale reactors (Figure 2).
In the waste mainly composed of WWTP sludge, >75% of samples (n = 9) were positive for S. agalactiae (0.78, 95% CI 0.45–0.94), C. perfringens (1.00, 95% CI 0.70–1.00), Bacteroides (1.00, 95% CI 0.70–1.00), and the M. tuberculosis complex (1.00, 95% CI 0.70–1.00, Figure 2). Both K. pneumoniae and P. aeruginosa were found with a medium prevalence (0.56, 95% CI 0.27–0.81), L. monocytogenes and C. burnetii were weakly present (<25%), while Y. enterocolitica and ETEC were not detected (Figure 2 and Supplementary Table S7).
The irp2 gene, encoding an iron regulatory protein involved in biosynthesis of the siderophore yersiniabactin, and ybtA, encoding a transcriptional regulator of the same gene cluster, were both found with a medium prevalence (0.67, 95% CI 0.35–0.88) in raw agricultural OWs and a high prevalence (0.78, 95% CI 0.45–0.94) in samples mainly composed of WWTP sludge (Figure 2). The other two virulence genes, ces, which is involved in cereulide biosynthesis and is produced by the B. cereus group, and cpe, which encodes an enterotoxin produced by C. perfringens, were not found in OWs from agricultural origin (n = 9). In contrast, the cpe and ces genes were detected with a high (1.00, 95% CI 0.70–1.00) and medium (0.33, 95% CI 0.12–0.65) prevalence, respectively (Figure 2 and Supplementary Table S7), in the OWs composed mainly of WWTP sludge (n = 9).
Interestingly, all raw OW samples (n = 18) were positive (1.00, 95% CI 0.82–1.00) for both integrons intI1 and intI2, and the insertional sequences IS26 and ISEcp1 (Figure 2 and Supplementary Table S7). Several broad-host-range plasmids of the IncP, IncQ, IncN, and IncFIC groups were also present in the raw OWs. IncP-specific sequence was found with a high prevalence (0.94, 95% CI 0.74–0.99) in raw OWs regardless of their origin, while the prevalence of the IncQ- and IncN-specific sequences varied with the origin of the OW sample (Figure 2 and Supplementary Table S7). The IncQ plasmids were detected with a high prevalence (0.89, 95% CI 0.57–0.98) in waste of agricultural origin, while the IncN plasmids were detected mainly in waste composed principally of WWTP sludge (1.00, 95% CI 0.70–1.00). Interestingly, IncN plasmids were not detected in agricultural waste and IncQ plasmids were not detected in waste composed mainly of WWTP sludge (Figure 2). The IncFIC plasmids were found with a medium prevalence (0.67, 95% CI 0.35–0.88) in agricultural waste and a low prevalence (0.22, 95% CI 0.06–0.55) in waste composed mainly of WWTP sludge.
We then assessed the prevalence of 15 ARGs. The multidrug resistance genes acrB, tolC, and qacH/E, the sulfonamide resistance genes sul1 and sul2, the tetracycline resistance genes tetA and tetO, and the macrolide resistance gene ermB were found in all (18/18) raw OW samples (1.00, 95% CI 0.82–1.00, Figure 2 and Supplementary Table S7). We also found a high prevalence of acrA (0.94, 95% CI 0.74–0.99), tetC (0.83, 95% CI 0.61–0.94), the quinolone resistance gene oqxA (0.83, 95% CI 0.61–0.94), and the vancomycin resistance gene vanA (0.83, 95% CI 0.61–0.94) in raw OWs regardless of their origin. Similarly, the beta-lactam resistance gene, blaTEM was detected with a high prevalence (1.00, 95% CI 0.82–1.00) in both agricultural (n = 9) and urban OWs (n = 9) (Figure 2 and Supplementary Table S7). The blaCTX-M gene was detected mainly in waste composed of WWTP sludge (0.89, 95% CI 0.57–0.98) and was not found in waste of agricultural origin. The blaSHV gene was found with a medium prevalence in both agricultural (0.67, 95% CI 0.35–0.88) and urban wastes (0.33, 95% CI 0.12–0.65, Figure 2).
3.3.2.2 Effect of anaerobic digestion on the prevalence of sanitary indicatorsThe prevalence of only one pathogenic bacterial species, S. agalactiae, was significantly altered by the AD process. S. agalactiae was detected with a high prevalence in raw urban waste (0.78, 95% CI 0.45–0.94) and with a low prevalence (0.22, 95% CI 0.06–0.55) in raw agricultural OWs. The decrease in S. agalactiae prevalence was significant (p < 0.01) in digestates of the urban wastes composed mainly of WWTP sludge with or without straw +/− zeolite supplementation (n = 9) (Figure 2 and Supplementary Table S7).
There was no significant decrease in the prevalence of virulence factors and MGEs in digestates, regardless of the OW origin (Supplementary Table S7). Similarly, no significant change in the prevalence of ARGs could be detected in the digestates derived from OWs of agricultural origin (n = 11). However, in the digestates of urban wastes composed mainly of WWTP sludge (n = 9), the prevalence of three ARGs (oqxA, blaCTX-M, and vanA) was significantly reduced (p < 0.05, Supplementary Table S7).
3.3.3 Effect of anaerobic digestion on absolute concentrations of sanitary indicatorsWe then used ddPCR to quantify the 31 sanitary indicators detected in more than 33% of raw samples from agricultural or urban origin and persistent in digestates (Figures 3, 4 and SupplementaryTables S8, S9). AD did not significantly alter the total bacterial abundance (16S rRNA gene) in any of the reactors (Supplementary Tables S8, S9). The average bacterial abundance was 10.0 ± 0.6 log10 copies/g in raw wastes and 10.2 ± 0.7 log10 copies/g in digestates from full-scale reactors (Supplementary Table S8). Similarly, the average bacterial abundance was 10.5 ± 0.5 log10 copies/g in the raw wastes composed mainly of WWTP sludge and 10.7 ± 0.3 log10 copies/g in the corresponding digestates obtained from laboratory-scale reactors (Supplementary Table S9). Therefore, the sanitary indicator specific gene count is expressed in log10 copies/g of dry matter, without normalization to 16S rRNA gene copy numbers.
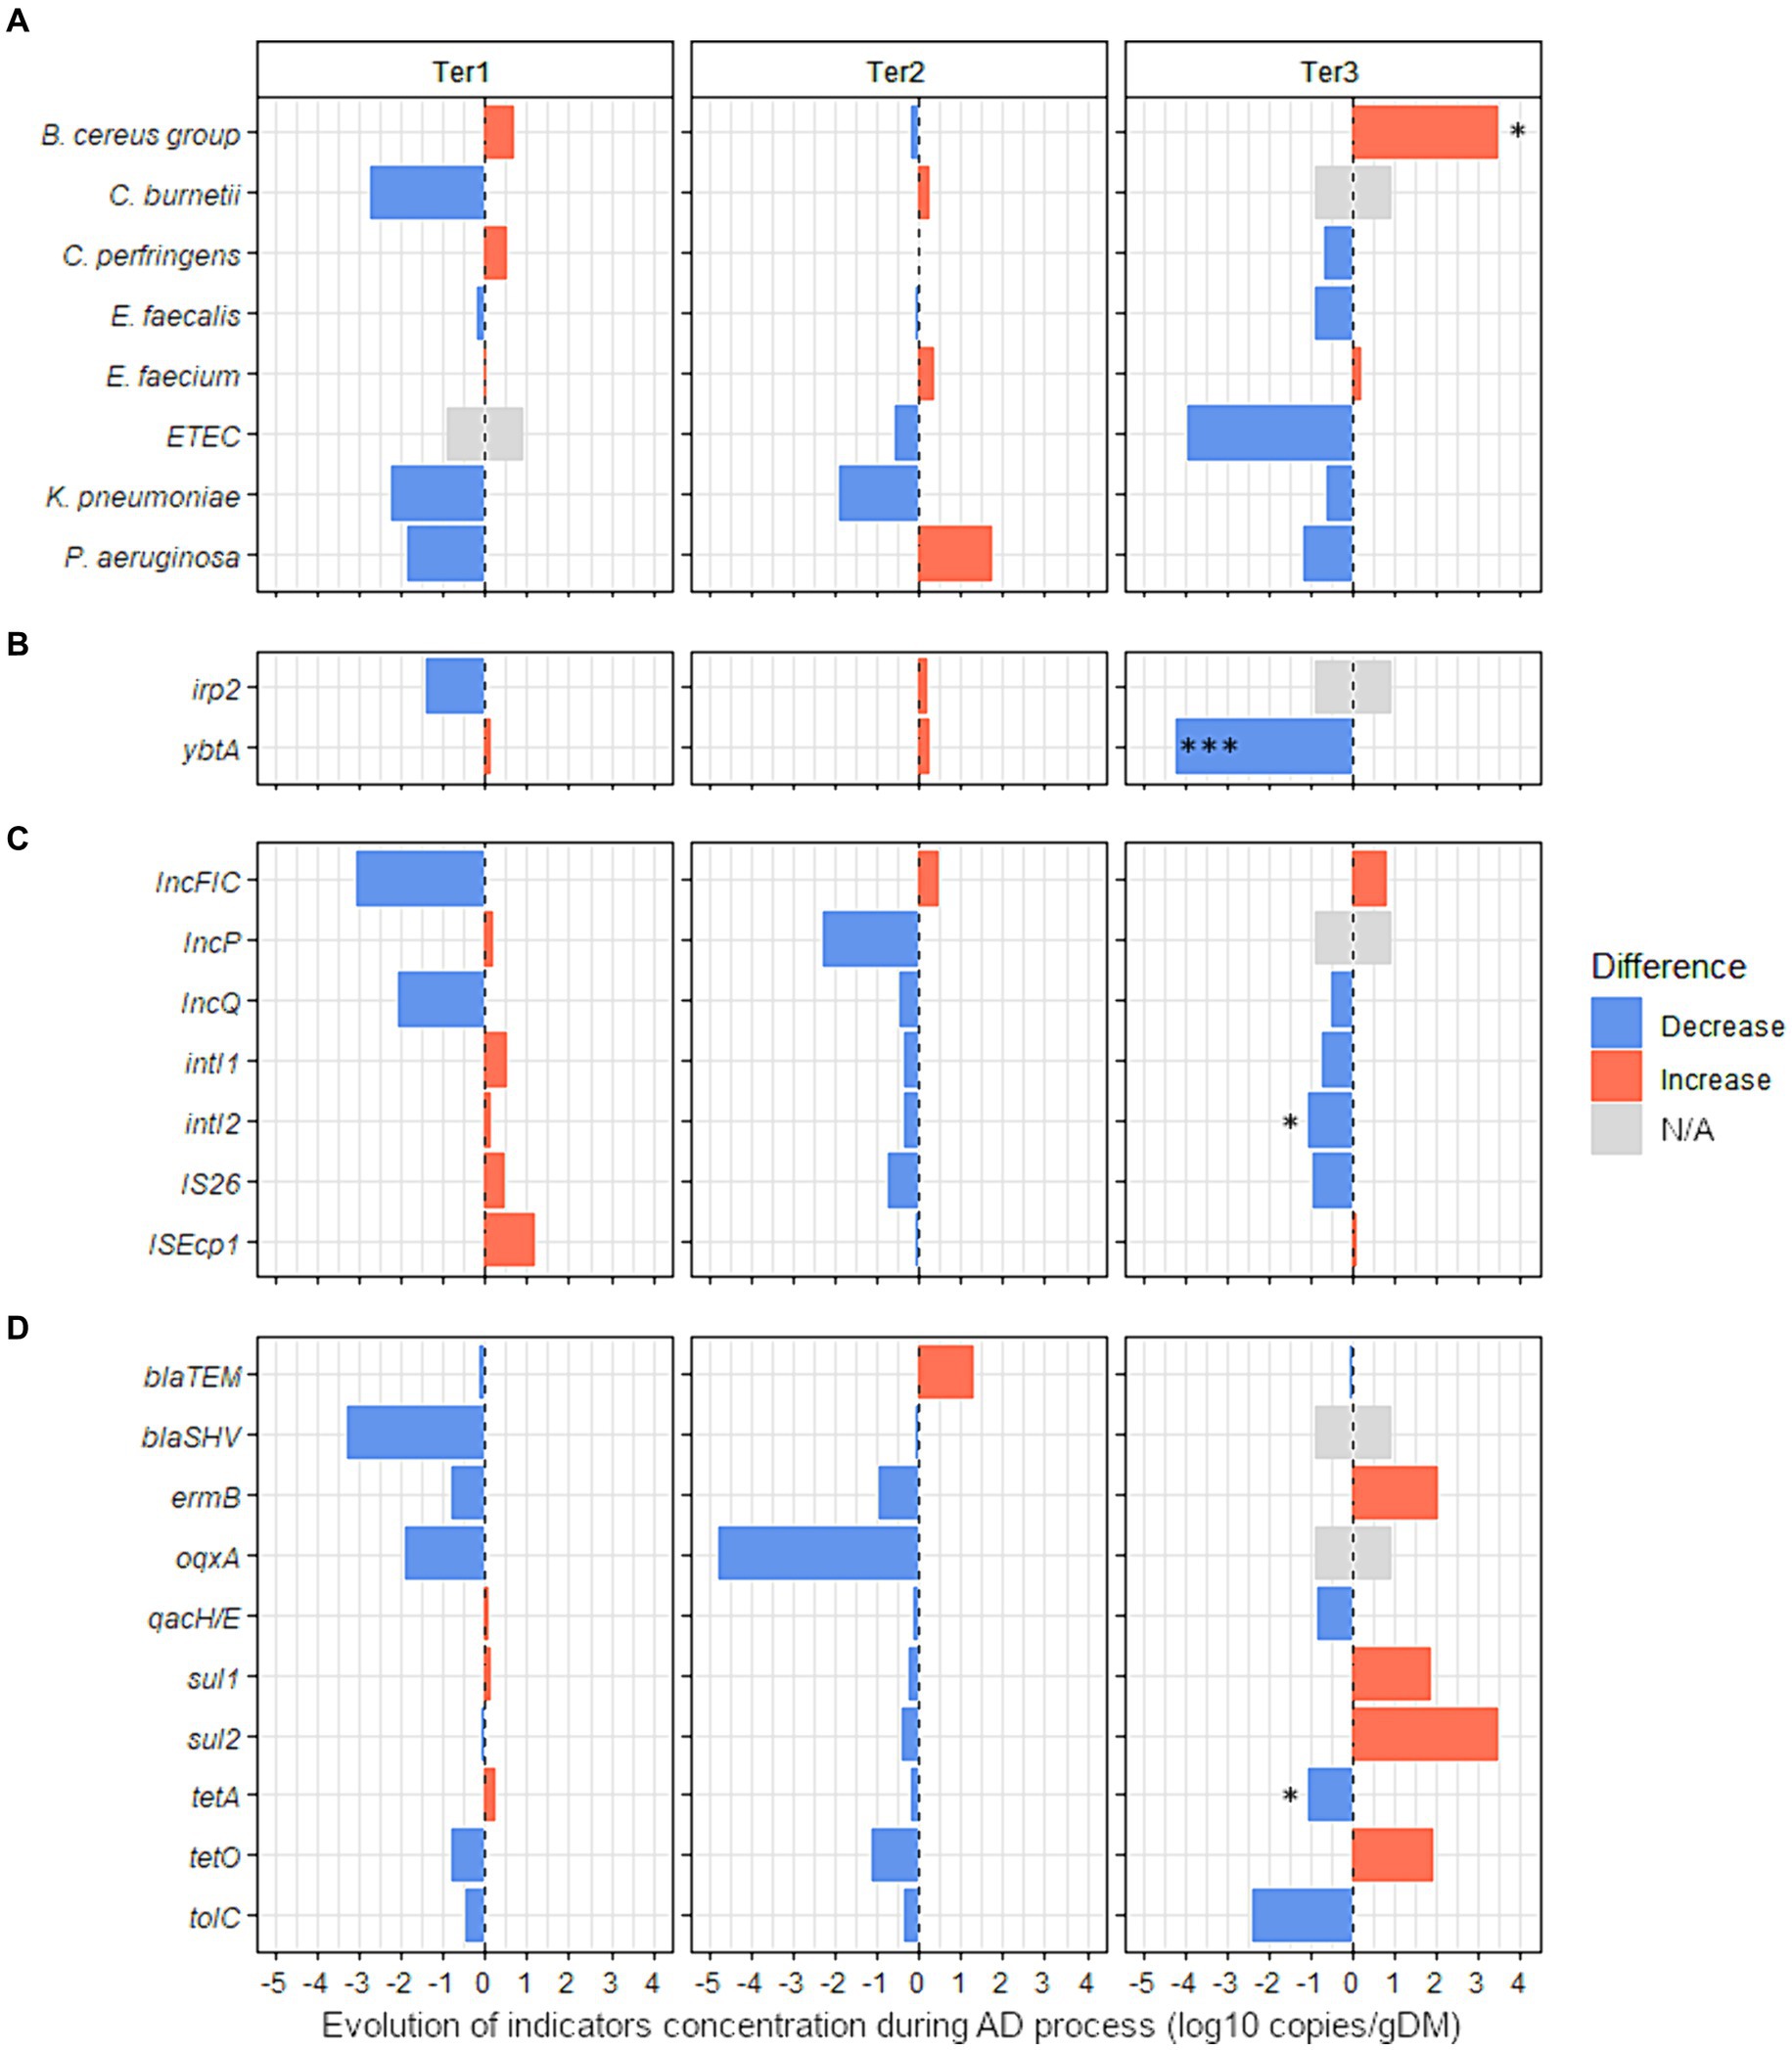
Figure 3. Effect of anaerobic digestion processes on the evolution of 27 sanitary indicators in organic wastes from agricultural origin. The absolute abundance of each sanitary indicator was evaluated by Droplet Digital PCR in the digestates and compared with their quantities in the corresponding raw organic wastes (see Supplementary Table S8 for more details). The effect of the key parameters of process (feeding mode, number of steps, temperature, pH) was studied using three full-scale anaerobic digestion plants (Ter1, Ter2, and Ter3) (see Table 1 for more information on operating parameters of these reactors). Blue bars represent positive effects, and red bars represent negative effects. The significance of the effect was investigated by fitting GLM with a gamma likelihood. p-values were adjusted using Bonferroni’s Holm method (p < 0.05*; p < 0.01**; p < 0.001***). N/A: Indicator non-quantifiable by ddPCR because of either a low prevalence of the indicator or an amplification of several nonspecific products by RT-PCR (see supplementary Table S8 for more information). The sanitary indicators were classified into 4 categories: (A) bacterial genera or species, (B) virulence factors genes, (C) mobile genetic elements, and (D) antimicrobial resistance genes (see Table 2 for more information on these indicators genes).
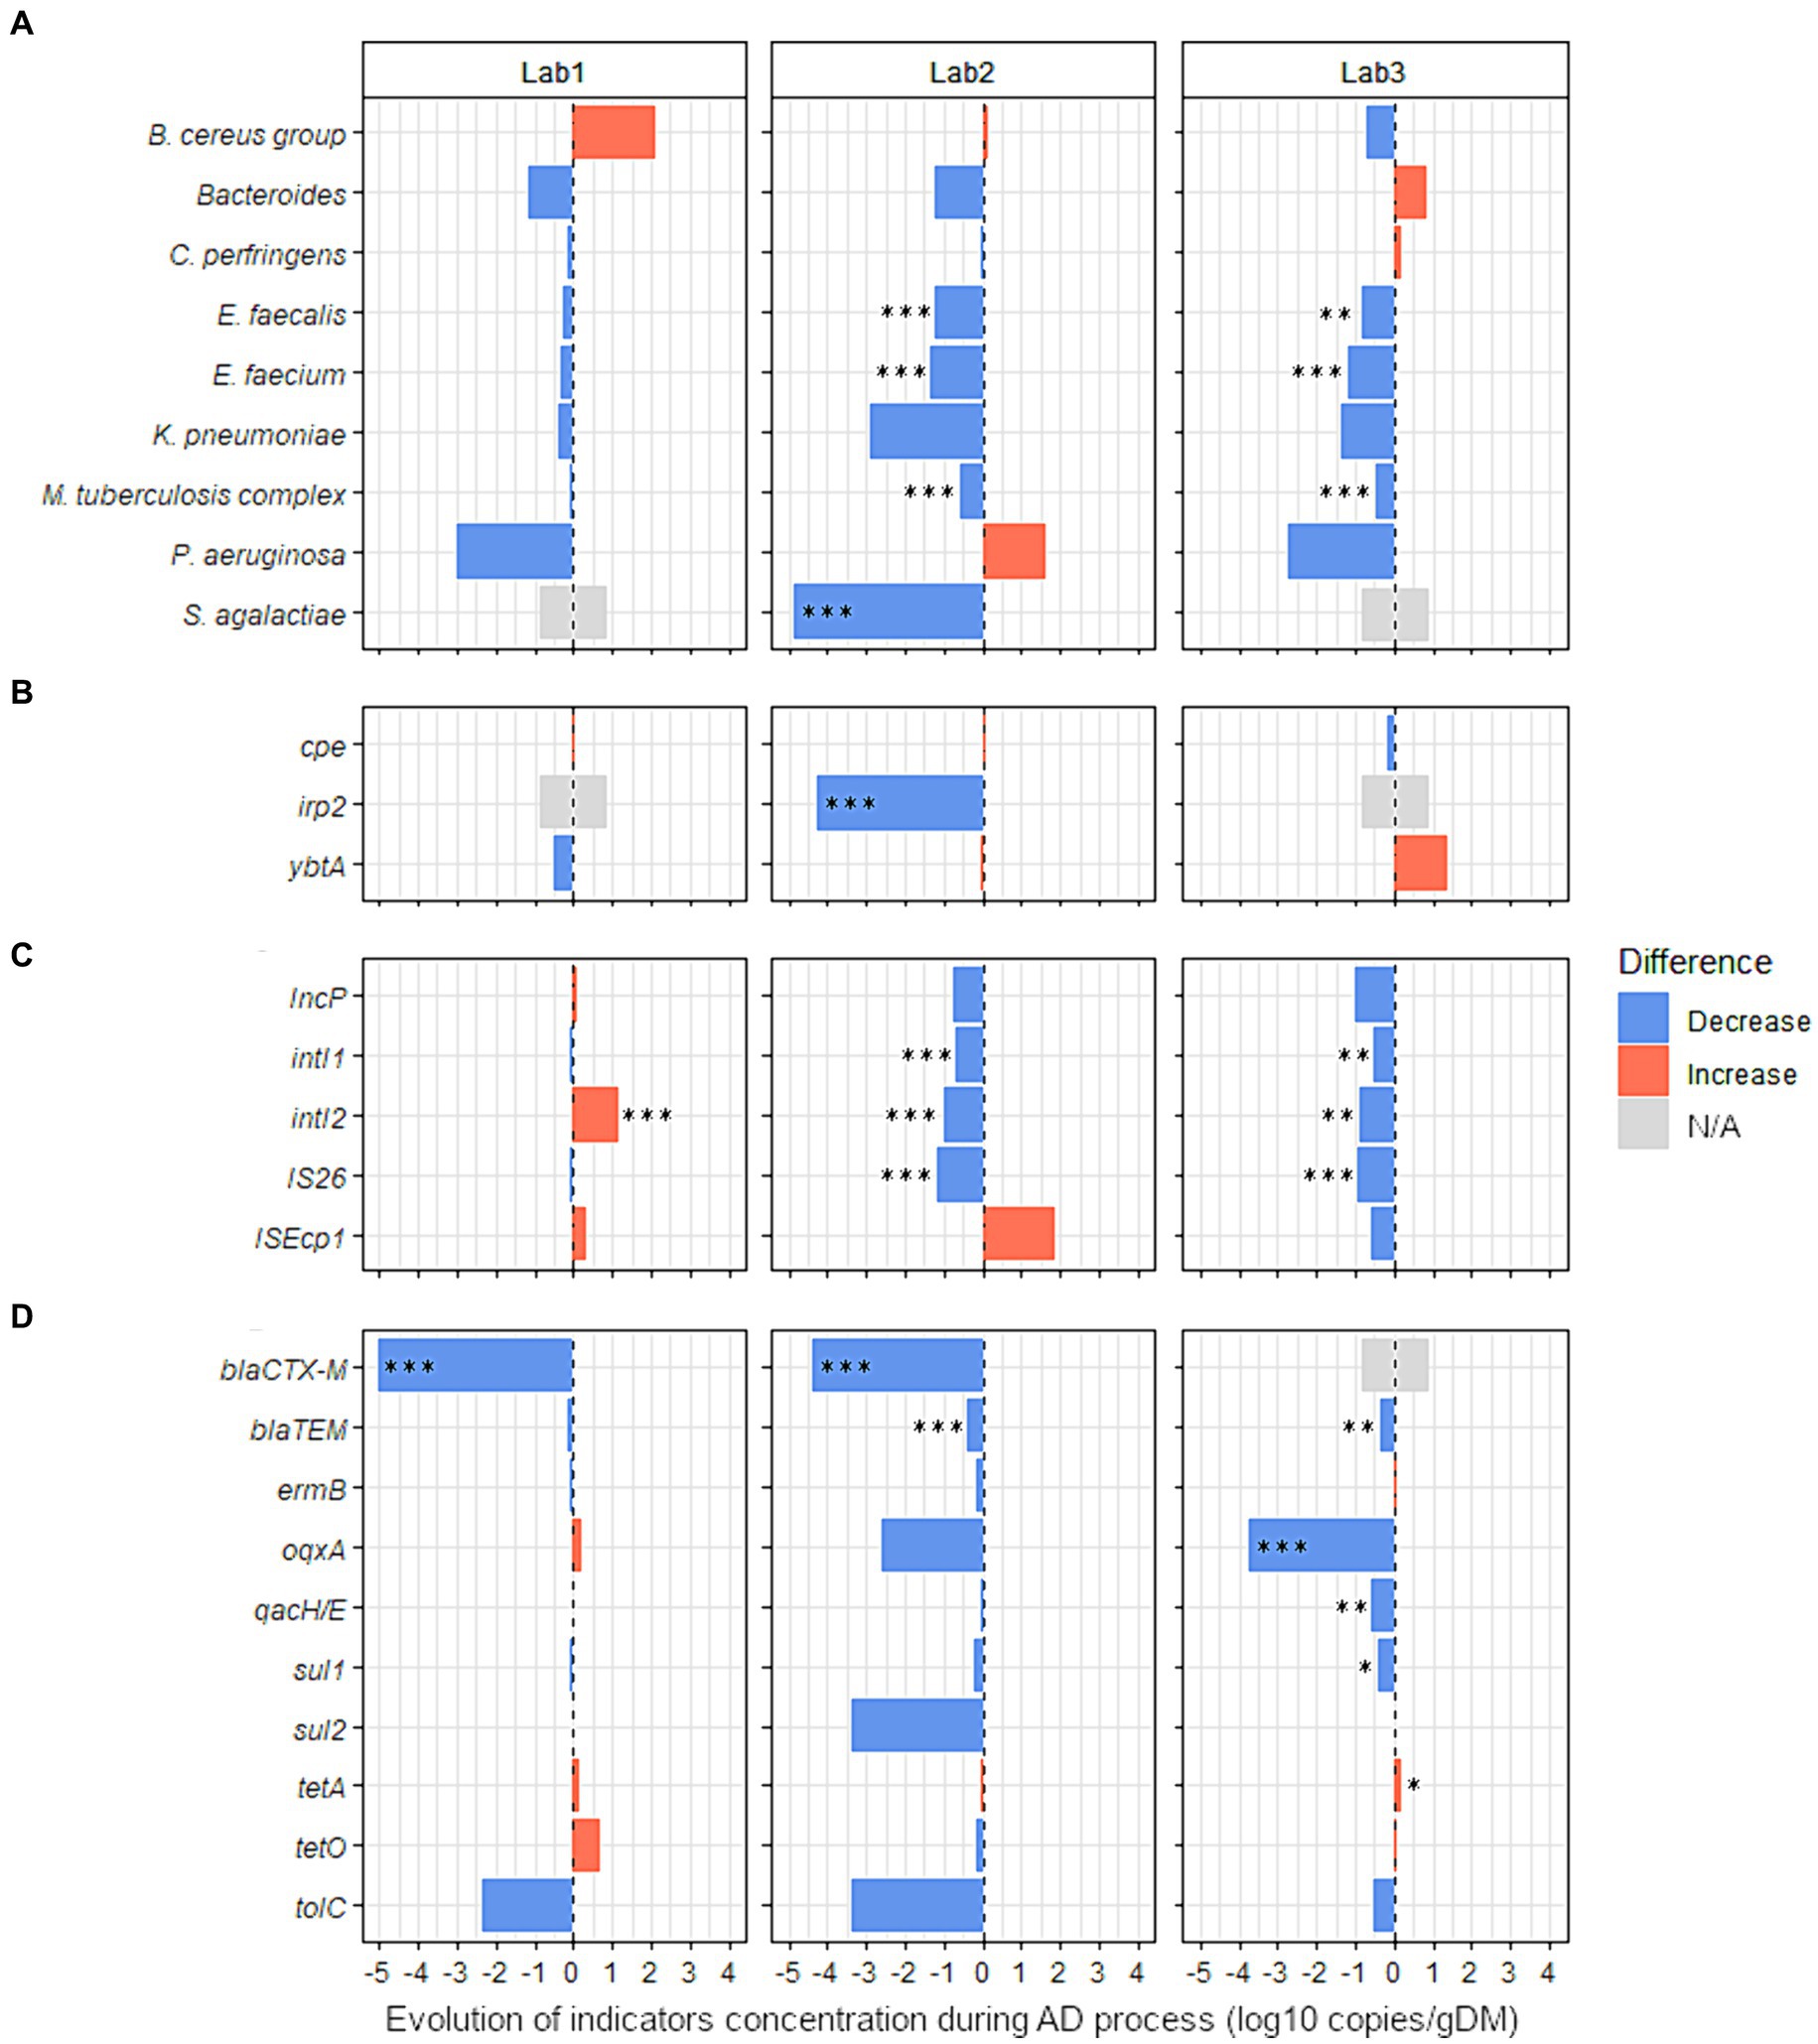
Figure 4. Effect of the nature of raw organic wastes on the evolution of 27 sanitary indicators during anaerobic digestion process. The absolute abundance of each sanitary indicator was evaluated by Droplet Digital PCR in the digestates and compared with their quantities in the corresponding raw organic wastes (see Supplementary Table S9 for more details). Three lab-scale mesophilic reactors (Lab1, Lab2, and Lab3) were used where the anaerobic digestion process was similar, but the proportions of inputs were varied (see Table 1 for more information on operating parameters of anaerobic reactors Lab1, Lab2, and Lab3). Lab1 was fed with 97% activated sludge (urban waste) and 3% cow manure. Lab2 was fed with 85% of the same mixture, supplemented with 15% wheat straw. Lab3 was fed with 81% of the same mixture, 15% wheat straw, and 4% zeolite powder. Blue bars represent positive effects, and red bars represent negative effects. The significance of the effect was investigated by fitting GLM with a gamma likelihood. p-values were adjusted using Bonferroni’s Holm method (p < 0.05*; p < 0.01**; p < 0.001***). N/A: Indicator non-quantifiable by ddPCR because of either a low prevalence of the indicator or an amplification of several nonspecific products by RT-PCR (see Supplementary Table S9 for more information). The sanitary indicators were classified into 4 categories: (A) bacterial genera or species, (B) virulence factors genes, (C) mobile genetic elements, and (D) antimicrobial resistance genes (see Table 2 for more information on these indicators genes).
3.3.3.1 Influence of different technological processesThree full-scale reactors with different technologies (Ter1, Ter2, and Ter3) were used to study the impact of different AD processes on the levels of 27 sanitary indicators in OWs from agricultural origin. First, the impact of AD on the absolute concentration of sanitary indicators in OWs was measured without differentiating between the different reactors (Supplementary Table S8). Of the 27 quantified indicators in raw OWs and corresponding digestates from Ter1, Ter2, and Ter3, only oqxA was significantly changed (−3.3 log10 gene copies/g, p < 0.05) by AD.
Second, raw OWs and digestates from each reactor were compared independently to identify the hygienic effect specific to each technological process (Figure 3 and Supplementary Table S8). No significant change between inputs and outputs was observed in Ter1 (two-stage, semi-continuous feeding, 44.5°C) or Ter2 (single-stage, semi-continuous feeding, 39°C). In the Ter3 reactor (batch, 45°C), a significant enrichment of 3.5 log10 copies/g was observed for the B. cereus group (p < 0.05, Figure 3 and Supplementary Table S8). In contrast, the virulence associated gene ybtA was completely removed by AD in this reactor, with a reduction of −4.2 log10 gene copies/g (p < 0.001, Figure 3). Similarly, the MGE intI2 was less abundant in the digestate than in raw OWs, with a reduction of 1.1 log10 copies/g (p < 0.05, Figure 3 and Supplementary Table S8). The ARG tetA was also less abundant (p < 0.05) in digestate (6.6 log10 copies/g) than in raw OWs (7.7 log10 copies/g).
3.3.3.2 Influence of the type of raw wasteThree laboratory-scale reactors fed with feces with or without wheat straw and/or zeolite powder supplementation were used to investigate the effect of the type of waste input on the level of sanitary indicators in digestates. The effect of AD (single-stage, semi-continuous feeding, 37°C), was first studied without considering the nature of the added waste. Sanitary indicators were quantified and compared between raw wastes and digestates from the three studied reactors (Supplementary Table S9). S. agalactiae was totally removed (−4.9 log10 copies/g, p < 0.001) by AD and the concentration of three other species were also significantly reduced: E. faecalis (−0.8 log10 copies/g, p < 0.001); E. faecium (−1.0 log10 copies/g, p < 0.001); and M. tuberculosis complex (−0.4 log10 copies/g, p < 0.01). In addition, the concentration of three MGEs was also significantly reduced by AD: intI1 (−0.5 log10 copies/g, p < 0.05); IS26 (−0.7 log10 copies/g, p < 0.001); and IncP (−0.6 log10 copies/g, p < 0.05). Significant reductions were also noted for the ARGs blaCTX-M (total removal of 4.7 log10 copies/g, p < 0.001) and blaTEM (−0.3 log10 copies/g, p < 0.05).
Then, with the aim of identifying the potential variations related to the nature of waste used, the raw OWs and digestates were compared for each reactor independently (Lab1, Lab2, and Lab3, Figure 4 and Supplementary Table S9). No sanitary indicators were enriched in the digestates from Lab2. In digestates from Lab3, only tetA was moderately increased (0.2 log10 copies/g, p < 0.05). In both reactors where straw was added (Lab2 and Lab3), seven indicators were significantly less abundant in digestates than in raw OWs (Figure 4 and Supplementary Table S9). E. faecium was reduced by 1.4 and 1.2 log10 copies/g (p < 0.001) and E. faecalis was reduced by 1.2 and 0.8 log10 copies/g (p < 0.01) in Lab2 and Lab3, respectively. The M. tuberculosis complex also decreased by 0.6 and 0.5 log10 copies/g (p < 0.001) in Lab2 and Lab3, respectively. Three MGEs (intI1, intI2, and IS26) were also reduced in the digestates of both reactors Lab2 and Lab3 (Figure 4 and Supplementary Table S9). The intI1 gene was reduced by 0.7 and 0.5 log10 copies/g (p < 0.01) and intI2 was reduced by 1.0 and 0.9 log10 copies/g (p < 0.01) in Lab2 and Lab3, respectively. IS26 decreased by 1.1 and 1.0 log10 copies/g (p < 0.001) in Lab2 and Lab3, respectively. Also, blaTEM was decreased by 0.4 log10 copies/g (p < 0.001) and 0.3 log10 copies/g (p < 0.01) in Lab2 and Lab3, respectively. Similarly, in Lab2, S. agalactiae and irp2 were significantly less abundant in digestates than in raw OWs, with a reduction of 4.9 and 4.3 log10 copies/g, respectively (p < 0.001, Figure 4, and Supplementary Table S9). In Lab3, fed with feces supplemented with wheat straw and zeolite powder, an MGE (IncP) and three ARGs (qacH/E, oqxA, and sul1) were decreased by −1.0, −0.6, −3.8, and − 0.4 log10 copies/g (p < 0.05), respectively, in digestates, compared with raw OWs (Figure 4 and Supplementary Table S9). Moreover, the beta-lactamin resistance gene blaCTX-M was reduced by 4.4 log10 copies/g (p < 0.001) in Lab2 digestates. A similar effect was also observed (−5.0 log10 copies/g; p < 0.001) in digestates obtained from Lab1 (Figure 4 and Supplementary Table S9). However, contrary to what we observed in Lab2 and Lab3, intI2 was increased by 1.2 log10 copies/g (p < 0.001) in the digestates obtained from Lab1 (Figure 4 and Supplementary Table S9).
4 DiscussionIn France, raw OWs from different origins (agricultural or urban) can be mixed in the same anaerobic reactor (Avadí et al., 2022). Depending on their origin, these OWs may be contaminated by metallic and/or organic micropollutants and by pathogenic organisms (Aigle et al., 2021). In the anaerobic environment inside a reactor, opportunistic pathogenic bacteria can be enriched, especially if they have the functional traits necessary for their survival and/or growth. The main goal of this study was to evaluate the impact of the nature of raw OWs (using three laboratory-scale reactors Lab1, Lab2, and Lab3) and different AD processes (using three full-scale reactors Ter1, Ter2, and Ter3) on the levels of sanitary indicators in digestates. First, we selected a high number of health indicators (77) that are most often found in raw OWs including new indicators of health hazards, such as virulence factors carried by MGEs. At least, one gene from the most frequently detected ARG classes in livestock waste (sulfonamides, tetracyclines, β-lactams, macrolide-lincosamid-streptogramin B and fluoroquinolone) was selected (He et al., 2020; Zalewska et al., 2021; Tian et al., 2022). Similarly, the ARGs found frequently in activated sludge (e.g., sul1, sul2, tetA, tetO, tetC, qnrA, vanA, qacE) were also selected (Redhead et al., 2020; Shin et al., 2020; Mutuku et al., 2022).
The specific detection of 40 indicators including 13 pathogenic species/genera, four virulence factors, eight MGEs, and 15 genes implicated in antimicrobial resistance were validated in raw OWs, and their digestates, from agricultural and urban origin. We then assessed whether the origin of raw OWs affects the levels of sanitary indicators. We classified the prevalence of 40 indicators in raw OWs of different origin (agricultural vs urban) into three groups (high, medium, and low prevalence). From these results, three different profiles were identified.
Some sanitary indicators were highly prevalent in all raw OWs tested in this study, despite their diverse origin, including 23% (3/13) of the pathogenic species/genera (E. faecalis, E. faecium, and B. cereus group), 86.7% (13/15) of the antimicrobial resistance genes, and 62.5% (5/8) of the MGEs analyzed. These results are consistent with earlier studies reporting that both livestock manure and sludge can be an important reservoir of ARGs (Li et al., 2015; Karkman et al., 2018). Interestingly, the high concentrations of pharmaceutical products detected in our study could explain the high prevalence of ARGs which is likely associated with selection phenomena (Hughes and Andersson, 2012; Bengtsson-Palme et al., 2018) and horizontal gene transfers (Jutkina et al., 2018). In the mixture of activated sludge and cow manure (97:3) used to feed the Lab1 (100%), Lab2 (85%), and Lab3 (81%) reactors, three pharmaceutical classes were detected at high concentrations (antibiotics>antimicrobials>anti-inflammatory drugs). Fluoroquinolones were present at the highest concentrations, reaching values of up to 3.5 mg/kg for ofloxacin and 2.6 mg/kg for ciprofloxacin. Mailler et al. (2017) found similar concentrations of fluoroquinolones in activated sludge in France (up to 6.7 mg/kg for ofloxacin and 12.8 mg/kg for ciprofloxacin). In our study, antimicrobial products were also detected with a wide concentration range, from 160 μg/kg for triclocarban to 2.1 mg/kg for triclosan. This is lower than the concentration of triclocarban in activated sludge reported in a previous study (mean of 13 mg/kg) (Mejías et al., 2021).
Other sanitary indicators were only present in either agricultural or urban waste (Figure 5). While Bacteroides were not detected in the raw agricultural samples used in the thre
留言 (0)