
記住我


Hypertensive heart disease (HHD) and hypertrophic cardiomyopathy (HCM) are both characterized by left ventricular hypertrophy (LVH) but have distinct pathogenesis and clinical management strategies. HHD results from prolonged hypertension leading to left ventricular remodeling, and its treatment focuses on controlling blood pressure for a generally better prognosis (1). In contrast, HCM is an inherited disorder caused by mutations in myocardial sarcomere genes, requiring management of symptoms and prevention of sudden cardiac death, often involving invasive interventions, leading to a variable prognosis depending on disease severity and risk factors (2). However, distinguishing between HHD and HCM remains a significant clinical challenge, particularly because overlapping LVH and multiple forms of HCM (3), often resulting in diagnostic ambiguity when relying on a single morphological index. This challenge is compounded by the high prevalence of hypertension in HCM patients (4), frequent absence of family history in HCM (5), and limitations in genetic testing (6). These challenges underscore the need for precise diagnostic tools and comprehensive clinical evaluation to ensure optimal patient outcomes.
Cardiovascular Magnetic Resonance (CMR) has emerged as a pivotal tool in the diagnosis of cardiomyopathies, providing detailed insights into the etiology and pathophysiology of these conditions (7). Current studies increasingly explore HHD and HCM using CMR, focusing on (1) extent of diffuse fibrosis (8, 9), native T1mapping and myocardial extracellular volume (ECV); (2) myocardial deformation damage: global radial strain (GRS), global circumferential strain (GCS), and global longitudinal strain (GLS); (3) hypertrophy patterns and systolic-diastolic disorders: left ventricular mass index (LVMI), maximal left ventricular wall thickness (maximal LVWT), and end-diastolic and end-systolic volume index (ESVI, EDVI). Despite these advancements, there is no consensus on the utility of these CMR parameters in reliably distinguishing HHD from HCM or their ability to reflect distinct pathophysiological characteristics.
This study is the first to perform a quantitative meta-analysis of the utility of CMR in discriminating HHD from HCM and to explore potential influencing factors using subgroup and regression analyses. This study aims to (1) evaluate CMR’s effectiveness in differentiating HHD from HCM for clinical application, and (2) investigate their potential pathophysiological differences.
2 Methods 2.1 Search strategy and study selectionThe protocol of this meta-analysis is available at PROSPERO (CRD42023470557). Relevant literature was methodically retrieved from PubMed, Embase, Web of Science, and Cochrane Library up to September 2023, following the PRISMA guidelines (10). To avoid erroneous omissions, the search strategy encompassed three core themes of this article: HHD, HCM, and CMR (see Supplementary Table S1). Inclusion criteria for studies were: (1) inclusion of human subjects with clearly defined HHD and HCM criteria; (2) comparison of HHD and HCM; (3) provision of specific quantitative MRI parameters (T1mapping, ECV, GRS, GCS, GLS, LVMI, Maximal LVWT, ESVI, EDVI); (4) clear description of MRI techniques and protocols used for parameter measurements; and (5) publication as a peer-reviewed article in English. Exclusion criteria included: (1) reviews, guidelines, conference proceedings, animal experiments, or case reports; (2) absence of HHD or HCM data; (3) MRI parameters outside the research scope; (4) incomplete or unclear methodology regarding MRI parameter acquisition; and (5) overlapping data from the same research group without clear distinction or unique data. Two reviewers (Q.Z. and Z.C.) independently conducted literature searches and study selection.
2.2 Quality assessmentRisk of bias and concerns over applicability of the included studies were assessed by two reviewers separately using the Joanna Briggs Institute Critical Appraisal tools (JBI) (11), which evaluates the credibility, relevance, and results of studies via eight questions, detailed in Supplementary Table S2. The visual inspection method for funnel plot symmetry (12) and egger's test (13) were used to assess the potential publication bias. For analyses where publication bias existed (two-tailed p < 0.05), we used Duval and Tweedie's “trim and fill” method to adjust the impact of publication bias (14).
2.3 Data extractionData from eligible studies were extracted by one author (Q.Z.) and double-checked by a second (Z.C.). Following data were extracted from the included studies: (1) study characteristics: author, year, institution, study design (retrospective or prospective); (2) patient characteristics: inclusion/exclusion criteria, subgroups, sample sizes, age, gender, ejection fraction (EF), and complications (diabetes, dyslipidemia, smoking); (3) parameters: T1 mapping, ECV, GRS, GCS, GLS, LVMI, Maximal LVWT, ESVI, EDVI; (4) MR features: field strength, vendor, scanner, scan sequence; (5) post-processing features: software, method. Studies subdividing HCM into subgroups (15, 16), were consolidated into one group according to Supplementary Methods A. For studies reporting median, minimum and maximum rather than mean and SD (17, 18, 19), mean, and if necessary SD, were calculated according to Supplementary Methods B. For a study reporting mean and standard error of the mean (SEM) (20), conversion was performed according to Supplementary Methods C. The multicenter study (21) provided independent T1 mapping values for HHD and HCM patients at different centers and different field strengths, and was therefore considered as multiple studies.
2.4 Data analysisAll statistical analyses were conducted using Comprehensive Meta Analysis (Version 3.3) software. For each parameter, Hedges'g values within 95% confidence intervals (CI) were calculated for the included studies and then were pooled through a random-effects model to account for between-study heterogeneity. Compared to the fixed effects model, the random effects model is more conservative, yields wider CIs for the pooled effects, and allows conclusions to be generalized to a wider range of situations (22). Hedges'g was preferred over Cohen's d for computing standardized mean difference (SMD), as the latter may inaccurately estimate effect sizes in studies with small sample sizes (23). Hedges'g values of 0.2, 0.5, and 0.8 correspond to small, medium, and large effect sizes (24).
The significance of heterogeneity was obtained by Q test, τ2 and I2 values, which measure the true heterogeneity resulting from between-study variance rather than sampling error or chance. I2 values of 25%, 50% and 75% indicate low, medium and high proportions of heterogeneity (25), respectively. High heterogeneity indicates substantial variability among included studies, potentially undermining the analysis's conclusion reliability. Variability may stem from diverse factors, including different study designs, patient characteristics and technical approaches. Subgroup and regression analyses were used to explore potential influencing factors and to find sources of heterogeneity. The covariates are considered influencing factors if they lead to inconsistency with the overall effect. If no significant intragroup heterogeneity (P > 0.05) emerged in all subgroups, the covariate used for grouping were deemed a source of heterogeneity. Subgroup-analyses were conducted for MR field strength (1.5 T or 3 T), vendors of MR (Philips or Siemens or GE), software used for post-processing (Cvi42 or notCvi42), slices for measuring T1mapping (=1 or >1), region where the institute is located (Asia or Western), and difference in EF between HHD and HCM (ΔEF ≤ 5 or ΔEF > 5). Regression-analyses were conducted for mean age of the participants, percentage of males and mean EF of participants. A random-effects model is used to combine studies within each subgroup for subgroup-analysis and regression-analyses were performed with the Knapp-Hartung adjustment (26). Sensitivity analysis using the one-study-removed method to evaluate the impact of individual studies on the overall effect to assess whether the results were stable.
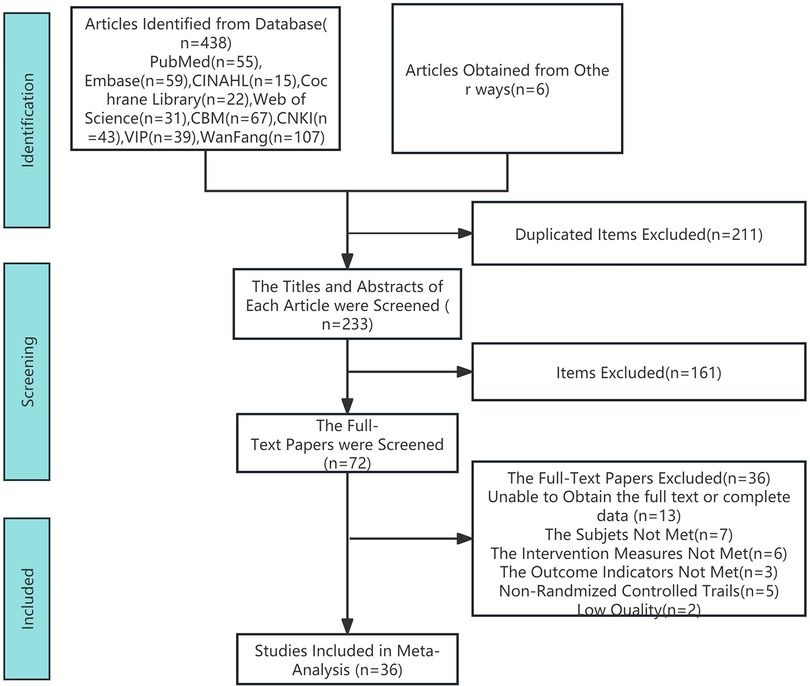
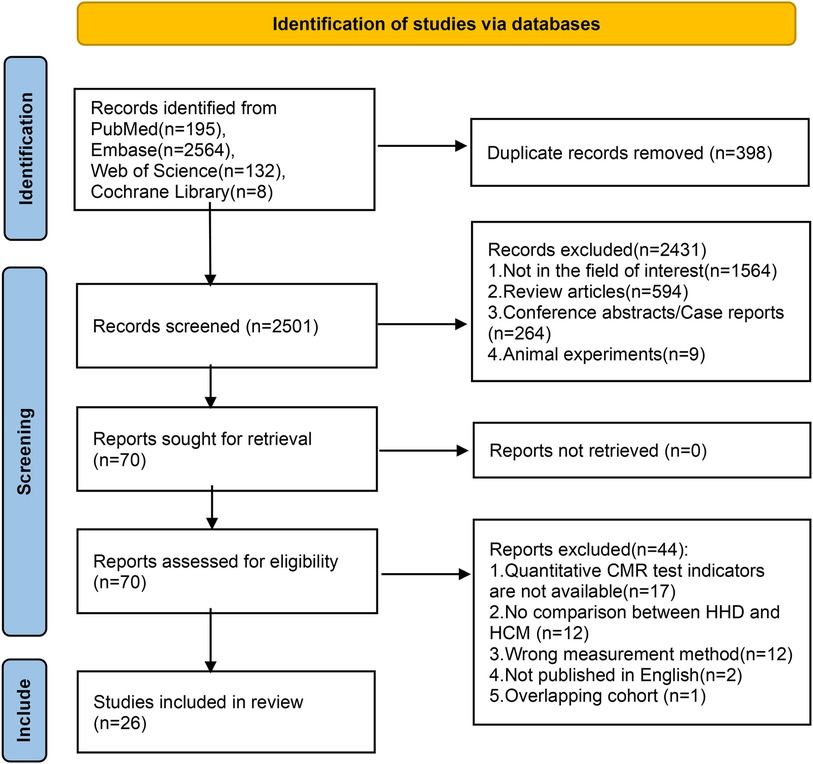
3 Results 3.1 Search results and selectionThe specific retrieval process and results are depicted in the workflow diagram (Figure 1). Initially, 2,899 articles were retrieved, including 398 duplicates. Screening of titles and abstracts led to the exclusion of 2,431 articles, yielding 70 articles for full-text review. By performing an in-depth assessment, 17 articles were excluded for not mentioning quantitative CMR data, 12 for not comparing HHD and HCM, 12 due to incorrect measurements, 2 for not publishing in English, 1 for duplicate cohorts (27), leaving 26 articles for quantitative meta-analysis. There was almost perfect agreement (Cohen's kappa = 0.878) (28) between the two reviewers, and any discrepancies [notably a study (29) disputed in the study inclusion session] have been resolved by discussion or consulting a third senior investigator (Y.Z.).

Figure 1. PRISMA flow diagram. HHD, hypertensive heart disease; HCM, hypertrophic cardiomyopathy.
3.2 Characteristics of the included studiesThe characteristics and demographics of the 26 included studies are detailed in Table 1, while images acquisition and post-processing details are in Table 2. These studies collectively involved 2,930 patients, comprising 1,349 with HHD and 1,581 with HCM. The mean age ranges were 45–66.2 years for HHD and 39.4–64.4 years for HCM. Excluding one study (40) that did not report the male proportion in the HHD group, the HHD group comprised 69.8% males, and the HCM group 65.3% males. The mean EF, reported in all but three studies (40, 46, 44), ranged from 28.2%–76% for HHD and 44.2%–76.1% for HCM. Excluding one study (33) that did not report the MR field strength, 14 studies used 3 T, 9 studies used 1.5 T, and 2 studies used both 1.5 T and 3 T. Most studies employed the MOLLI sequence for T1 mapping, but one study (38) used the STONE sequence. For measuring T1mapping, most studies selected 3 LV short-axis slices (basal, mid, and apex), but four studies (21, 33, 42, 36), selected a single mid-ventricular slice, and one study (38) selected 5 slices.
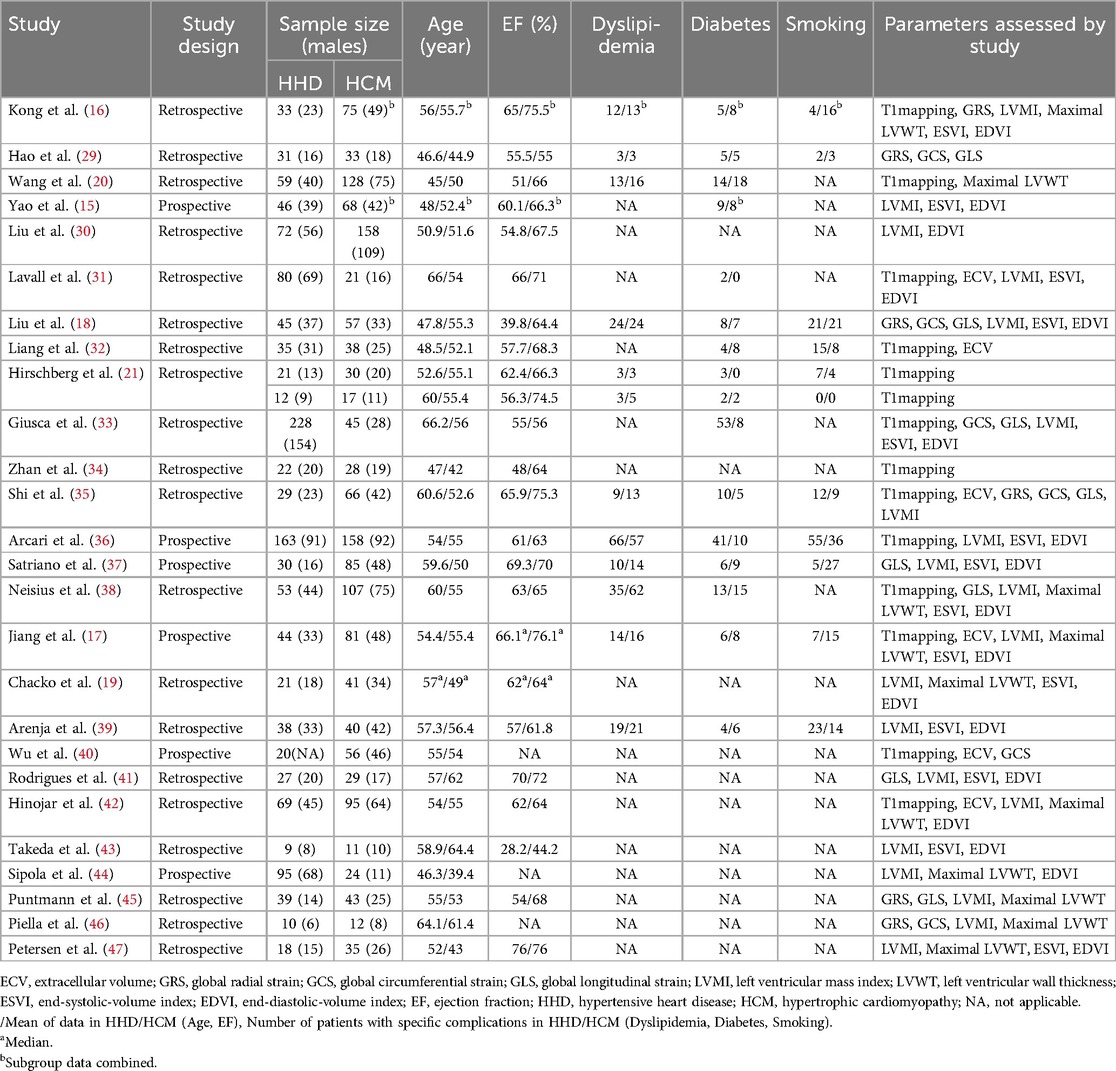
Table 1. The study characteristics and demographic characteristics of patients with HHD and HCM in 26 studies.
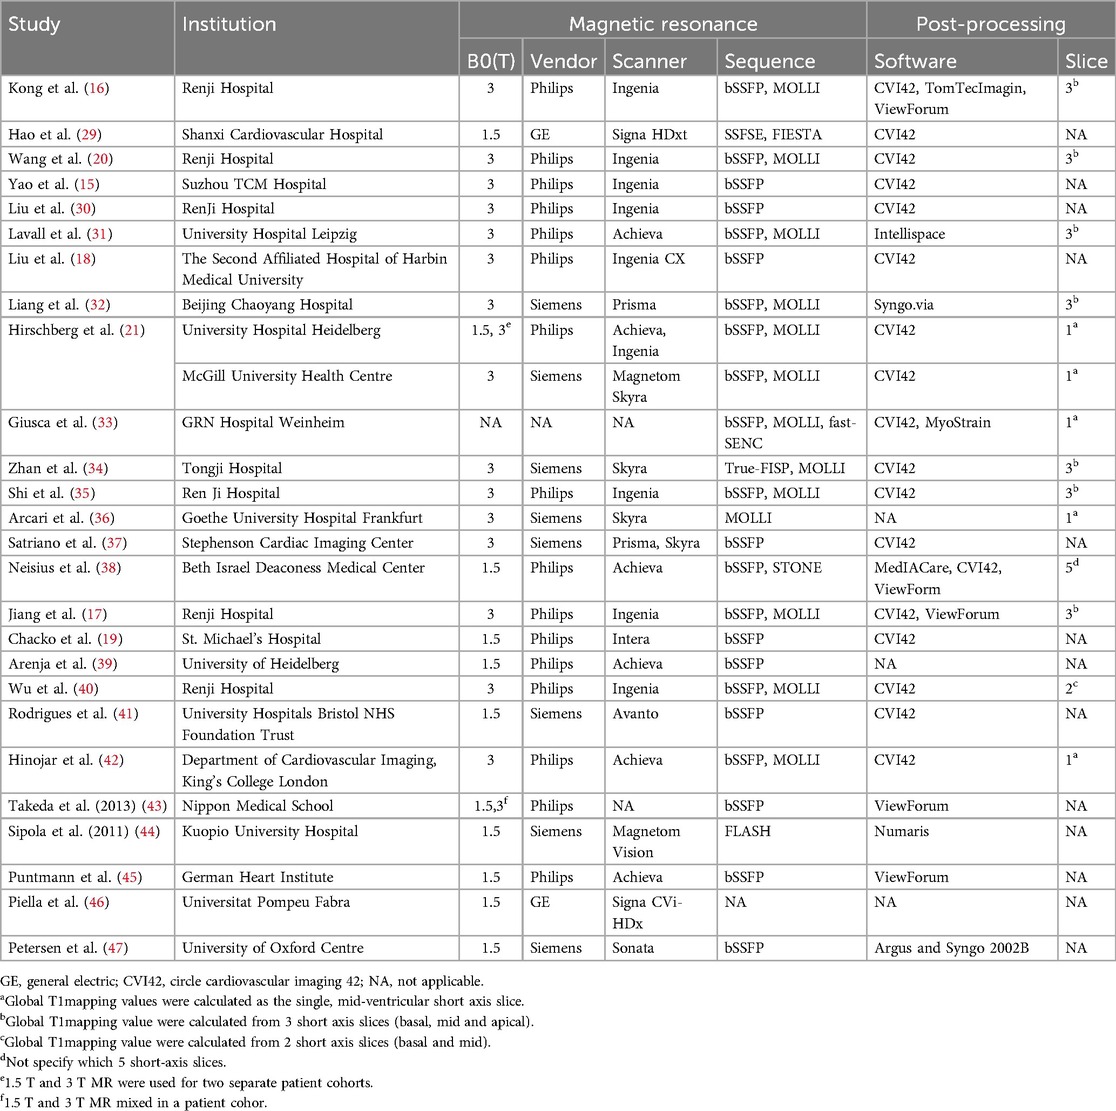
Table 2. Image acquisition and post-processing details in the 26 studies.
3.3 Main meta-analysisThe key findings from the meta-analyses of nine CMR parameters are summarized in Figure 2; Table 3, with subgroup-analyses in the Supplementary Table S3, and regression-analysis in the Supplementary Table S4. Specific results are detailed below by grouping.
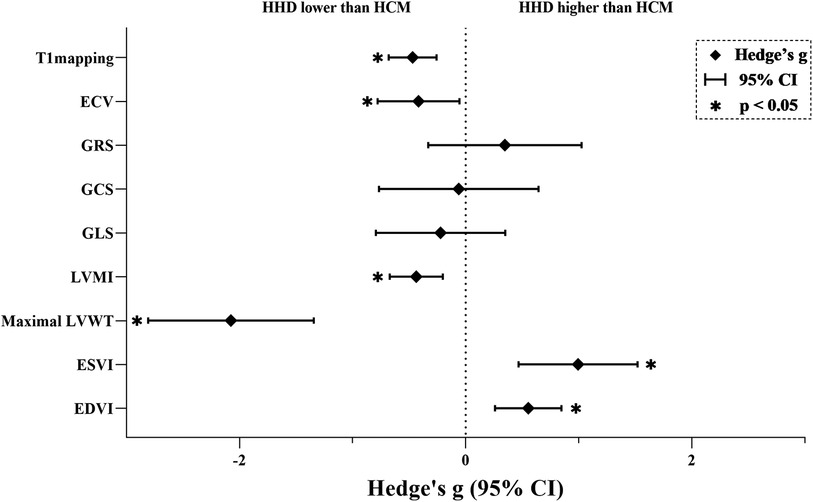
Figure 2. Results of the main meta-analyses. An asterisk indicates a statistically significant effect size for the parameter. ECV, extracellular volume; GRS, global radial strain; GCS, global circumferential strain; GLS, global longitudinal strain; LVMI, left ventricular mass index; LVWT, left ventricular wall thickness; ESVI, end-systolic-volume index; EDVI, end-diastolic-volume index; HHD, hypertensive heart disease; HCM, hypertrophic cardiomyopathy.
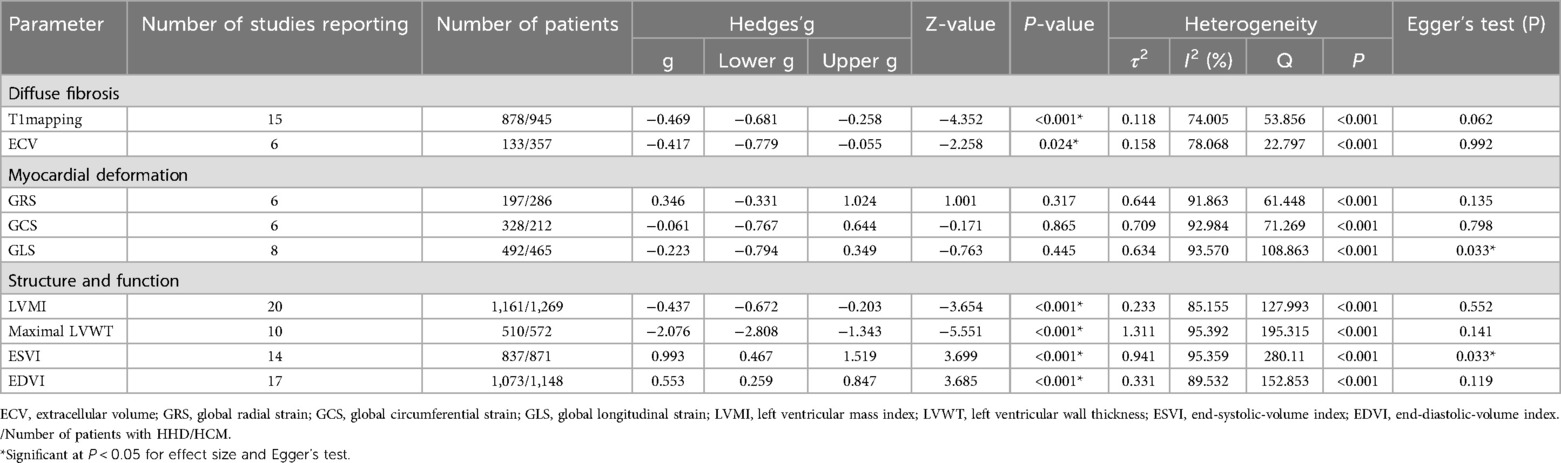
Table 3. Meta-analysis effect size, heterogeneity and publication bias in the 26 studies of patients with HHD and HCM.
3.3.1 Analysis of diffuse fibrosisT1mapping (Nstudy = 15, NHHD = 878, NHCM = 945) is significantly lower in HHD compared to HCM (g = −0.469, 95% CI: −0.681 to −0.258, P < 0.001). However, this effect had high heterogeneity (I2 = 74.005%, P < 0.001) and no evidence of publication bias (P = 0.062, Supplementary Figure S1A). In the T1 mapping subgroup analyses, reduced heterogeneity was observed in several subgroups: 1.5 T (n = 2, I2 < 0.001%), notCvi42 (n = 3, I2 = 34.503%), Asia (n = 7, I2 = 2.800%), slice >1 (n = 9, I2 = 33.644%), both ΔEF ≤ 5 (n = 6, I2 = 50.182%) and ΔEF > 5 (n = 8, I2 < 0.001%). Other subgroups still maintained higher levels of heterogeneity.
ECV (Nstudy = 6, NHHD = 133, NHCM = 357) is significantly lower in HHD compared to HCM (g = −0.417, 95% CI: −0.779 to −0.055, P = 0.024). However, this effect had high heterogeneity (I2 = 78.068%, P < 0.001) and no evidence of publication bias (P = 0.992, Supplementary Figure S1B).
3.3.2 Analysis of myocardial deformationGRS (Nstudy = 6, NHHD = 197, NHCM = 286) has no significant difference in HHD compared to HCM (g = 0.346, 95% CI: −0.331 to 1.024, P = 0.317). This effect had high heterogeneity (I2 = 91.863%, P < 0.001) and no evidence of publication bias (P = 0.135, Supplementary Figure S1C). In the GRS subgroup analysis, heterogeneity decreased in notCvi42 (n = 2, I2 < 0.001%) and GE (n = 2, I2 < 0.001%), while remaining unchanged in other subgroups.
GCS (Nstudy = 6, NHHD = 328, NHCM = 212) has no significant difference in HHD compared to HCM (g = −0.061, 95% CI: −0.767 to 0.644, P = 0.865). This effect had high heterogeneity (I2 = 92.984%, P < 0.001) and no evidence of publication bias (P = 0.798, Supplementary Figure S1D). In the GCS subgroup analysis, a decrease in heterogeneity was noted in Western (n = 2, I2 < 0.001%), with other subgroups showing consistent heterogeneity.
GLS (Nstudy = 8, NHHD = 492, NHCM = 465) has no significant difference in HHD compared to HCM (g = −0.223, 95% CI: −0.794 to 0.349, P = 0.445). This effect had high heterogeneity (I2 = 93.570%, P < 0.001) and evidence of publication bias (P = 0.033, Supplementary Figure S1E). Duval and Tweedie's “trim and fill” yielded 3 potential missing studies on the left side, reducing Hedges'g to −0.705 (95% CI: −1.300 to −0.111). In the GLS subgroup analysis, both Philips (n = 4, I2 = 59.862%) and Siemens (n = 2, I2 = 68.600%) exhibited decreased heterogeneity, as did ΔEF > 5 (n = 4, I2 = 57.057%), while other subgroups maintained.
3.3.3 Analysis of structure and functionLVMI (Nstudy = 20, NHHD = 1,161, NHCM = 1,269) is significantly lower in HHD compared to HCM (g = −0.437, 95% CI: −0.672 to −0.203, P < 0.001). However, this effect had high heterogeneity (I2 = 85.155%, P < 0.001) and no evidence of publication bias (P = 0.552, Supplementary Figure S1F).
Maximal LVWT (Nstudy = 10, NHHD = 510, NHCM = 572) is significantly lower in HHD compared to HCM (g = −2.076, 95% CI: −2.808 to −1.343, P < 0.001). However, this effect had high heterogeneity (I2 = 95.392%, P < 0.001) and no evidence of publication bias (P = 0.141, Supplementary Figure S1G).
ESVI (Nstudy = 14, NHHD = 837, NHCM = 871) is significantly higher in HHD compared to HCM (g = 0.993, 95% CI: 0.467–1.159, P < 0.001). However, this effect had high heterogeneity (I2 = 95.359%, P < 0.001) and evidence of publication bias (P = 0.033, Supplementary Figure S1H). Duval and Tweedie's “trim and fill” yielded 4 potential missing studies on the left-hand side, reducing Hedges'g to 0.370 (95% CI: −0.234 to 0.973).
EDVI (Nstudy = 16, NHHD = 1,073, NHCM = 1,148) is significantly higher in HHD compared to HCM (g = 0.553, 95% CI: 0.259–0.847, P < 0.001). However, this effect had high heterogeneity (I2 = 89.532%, P < 0.001) and no evidence of publication bias (P = 0.119, Supplementary Figure S1I). In the EDVI subgroup analysis, reduced heterogeneity was observed in Siemens (n = 5, I2 = 34.854%), with other subgroups showing no change.
3.4 Subgroup analyses and regression analysisIn the subgroup-analysis for T1mapping, results from Siemens (n = 4, P = 0.294) diverged from the overall effect. Similarly, notCvi42 (n = 2, p = 0.488) and Western (n = 2, p = 0.496) differed in ECV analyses. Philips (n = 4, p < 0.001) varied from the overall effect in GRS analyses. Western (n = 2, p < 0.001) showed a deviation in GCS analyses. The GLS analysis revealed a difference in Philips (n = 4, p = 0.020) from the overall effect. LVMI subgroup analyses indicated differences in Cvi42 (n = 9, p = 0.114), Siemens (n = 5, p = 0.465), and Asia (n = 7, p = 0.145). In ESVI and EDVI analyses, Siemens (n = 4, p = 0.940 and n = 5, p = 0.084, respectively) showed discrepancies. For all other subgroups, the results were consistent. Some of the subgroups not performed were due to the small number of studies (n < 2). T1 mapping, LVMI, Maximal LVWT, ESVI, and EDVI were subjected to regression-analysis revealing no significant moderating effects (all p > 0.05). Others were not analyzed via meta-regression due to a limited number of included studies (n < 10).
3.5 Sensitivity analysesSensitivity analyses, detailed in Supplementary Figure S2, showed that individual studies could impact the statistical significance in ECV. Excluding three studies (32, 40, 42), respectively led to significant changes in ECV's result. However, no individual study significantly altered the statistical overall result in other parameters.
4 DiscussionIn this study, we conducted a comprehensive assessment of various CMR parameters to differentiate between HHD and HCM, representing the first systematic review encompassing all pertinent studies. Our findings indicated that T1mapping, ECV, LVMI, and Maximal LVWT were significantly lower in HHD than in HCM, while ESVI and EDVI were higher. In contrast, GRS, GCS, GLS showed no significant differences between the two conditions.
We further investigated various covariates potentially influencing these results through subgroup and regression analyses. Both MR machine and post-processing affect the image quality and thus the accuracy and reliability of the parameters (48), with the magnetic field strength and the vendor reflecting the former, and the post-processing software and the slices representing the latter. Moreover, differences in disease severity and basic patient characteristics also affect the final outcome, as reflected by the difference in EF between HHD and HCM and the patient's region, age, sex, and mean EF. Most analysis results aligned with the overall effect; however, discrepancies were observed in T1 mapping, GRS, GLS, LVMI, ESVI, and EDVI across different vendors, and in ECV and LVMI across software and in ECV, GCS, and LVMI across region subgroups. Vendors, post-processing software and region moderated specific parameters, which further emphasizes the multifactorial nature of variation in CMR parameters. This underscores the need for standardized CMR protocols and the importance of considering these multiple factors in clinical interpretation and future research.
Sensitivity analyses demonstrated substantial stability in parameters other than ECV. Three studies that could significantly affect the result concluded that ECV was statistically different between HHD and HCM, while the remaining three concluded that it was not statistically significant. Given that the small number of included studies results in each study playing a high effect weight in the overall result, removing any of the positive studies would further reduce the already modest result.
4.1 Diffuse fibrosisIncreased T1 mapping, used to quantify the longitudinal relaxation time of tissues (49), is mainly due to edema and expanded interstitial space (50). Because both HHD and HCM pathologically exhibit myocyte hypertrophy and interstitial fibrosis (51, 52), without significant myocardial edema, T1 mapping may predominantly reflect interstitial fibrosis levels, with HCM showing more fibrosis than HHD. However, as T1 mapping combines signals from both myocytes and extracellular volume (50), differences in hypertrophic patterns and degrees could influence T1 mapping. ECV, derived from pre- and post-contrast T1 mapping of myocardium and blood (50), might be a more reliable indicator of diffuse interstitial fibrosis, minimizing the influence of cardiomyocytes (53–55). Hence, lower ECV in HHD compared to HCM more confidently indicates increased interstitial fibrosis in HCM than T1 mapping alone. However, the accuracy and stability of both are contingent on various factors like field strengths, sequences, vendors, post-processing software and methods, contributing to heterogeneity. Postprocessing with multilayer averaging has less heterogeneity and obtains more stable results than single-layer, probably due to the former better reflecting the heart as a whole. The majority of Asia group studies likely used exactly identical machines and protocols due to being from the same institution, contributing to their notably lower heterogeneity. Grouping T1 mapping by EF difference significantly lowered heterogeneity, indicating that it may reflect severity difference between HHD and HCM (56, 57) is a source of heterogeneity and influences T1 mapping variability and stability.
4.2 Myocardial deformationMyocardial strain, a dimensionless index measuring myocardial deformation (58), is superior to EF in describing myocardial deformation and identifying abnormalities of function (59, 60). Myocardial strains (GRS, GCS and GLS) are primarily computed using CMR feature tracking (CMR-FT) with semi-automatically outlining the myocardial contour on cine sequences (61). Myocardial strain is influenced by intracellular, extracellular (62), and molecular myocardial components (63). Despite known differences in these components between HHD and HCM (1, 2), our study found no statistical significance in global strains across all three directions. It's possible that global strains lost subtle information, like variations in specific segments, cardiac layers and strain rate, leading to the non-appearance of differences. For instance, in HCM, early subendocardial layer involvement (64) and asymmetric hypertrophy resulting in uneven segmental effects are not precisely captured by global strain. GLS was significantly less heterogeneous in both subgroups of vendor, highlighting it as a significant source of heterogeneity. Additionally, semi-automatic human contouring (65) of the myocardium, image quality, post-processing software and different regions lead to variability in the data, which affects the final pooled effect and heterogeneity.
4.3 Structure and functionCardiomyocyte hypertrophy and interstitial hyperplasia, stemming from different etiologies, lead to increased ventricular mass and wall thickness (66), affecting diastolic and systolic function (67). HHD shows LV hypertrophy as a response to increased afterload, initially maintaining normal wall stress and function (concentric hypertrophy) (68) but eventually causing LV dilatation and reduced function (eccentric hypertrophy) (57). And this hypertrophy is usually moderate, especially in the early stages of the disease. HCM, due to genetic mutations (69), typically characterized by asymmetric LV thickening without chamber dilatation (70), exhibits normal or supernormal systolic function but impaired diastolic function (71). LVMI primarily indicates the extent of cardiac hypertrophy, commonly assessing heart remodeling in HHD, whereas Maximal LVWT gauges the ventricular wall's peak thickness, often used in diagnosing HCM and its subtypes. ESVI and EDVI adjust for individual differences and more accurately reflect systolic and diastolic functions. In our study, HCM exhibited higher LVMI and Maximal LVWT, but lower ESVI and EDVI than HHD, indicating greater myocardial hypertrophy and more pronounced diastolic function impairment but better systolic function in HCM. However, the substantial overlap in cardiac hypertrophy and diastolic-systolic alterations between HHD and HCM implies no absolute value can definitively differentiate them. To the best of our knowledge, high heterogeneity likely stems from variations in disease duration, complications, medication, ethnic backgrounds of patients, image quality and operator variability in myocardial contouring.
Apart from the previously mentioned factors, about 50% of the included studies reported late gadolinium enhancement (LGE); however, its presence or absence was not a continuous variable, so it could not be meta-analyzed. Nonetheless, we discovered that the majority of the research reported the presence of LGE in 25%–35% of HHD and more than 80% of HCM, indicating that HCM is more likely to be associated with myocardial fibrosis or scarring.
The absolute value of Hedges'g represents the discrimination power, with high effect for Maximal LVWT and ESVI, medium for EDVI, and low for T1mapping, ECV and LVMI. Unfortunately, the current study's limitations prevent us from establishing a strong specific value to quasi-differentiate them. However, by combining data from multiple studies, this meta-analysis enhances statistical power and reliability, providing a comprehensive overview that makes the conclusions more robust and dependable than those of individual studies. Our study demonstrates that HCM patients exhibit significantly higher levels of diffuse fibrosis, as indicated by elevated T1 mapping and ECV. High T1 mapping and ECV values serve as reliable biomarkers for HCM, enhancing early diagnostic accuracy and helping clinicians differentiate between HCM and HHD more effectively, thus reducing the risk of misdiagnosis. Early detection of higher diffuse fibrosis levels in patients with HCM facilitates timely antifibrotic interventions that have the potential to slow disease progression, reduce complication rates, and improve patient prognosis. Although strain parameters did not show significant differences, highlighting the importance of integrating multiple CMR parameters in clinical evaluations remains crucial. Additionally, structural and functional indices aid in disease differentiation and severity assessment, guiding risk evaluation and management strategies to enhance long-term outcomes. Overall, these CMR parameters improve diagnostic precision and treatment personalization, leading to better patient care and outcomes.
5 LimitationsConcerning limitations, (1) this review predominantly included observational and retrospective studies, whose inherent limitations may affect result interpretation. Observational studies are prone to confounding factors and retrospective studies may suffer from selection bias and missing data, impacting the accuracy and consistency of the results; (2) the reliability of the results may be weakened by a high degree of heterogeneity, and the results should be interpreted with caution. Despite extensive subgroup and regression analyses, the source of heterogeneity for some indicators remains unclear; (3) the publication bias in GLS and ESVI analyses, instability of ECV in sensitivity analysis, and limited number of studies in certain subgroups call for confirmation of these findings in further studies; (4) the clinical heterogeneity and slight differences in diagnostic criteria of HHD and HCM, and our lack of focus on specific subgroups like obstructive and nonobstructive HCM, may affect results; (5) many studies lacked sufficient data for exploring potential covariates such as complications and disease duration; (6) while meta-analysis is a useful tool, our limited statistical power means the results should be interpreted cautiously.
6 Future directionsAlthough certain CMR parameters exhibit statistical differences between HHD and HCM, their limited discriminatory capacity highlights the need for integrated and enhanced approaches like algorithms combining multiple parameters (16) or deep learning (20). Considering the heterogeneity of myocardial hypertrophy, better stability and differentiation can be achieved by measuring T1 mapping and ECV in more myocardial layers. And comprehensive analysis using bull’s-eye plots of segmental strain (18, 29), strain rate (18, 35), multilayer strain (subendocardial, mid-myocardial, subepicardial) (16) and left atrial strain (15) may reveal differences obscured by global strains. Future research should also validate discriminatory efficacy of indicators like steep left ventricle to aortic root angle (72), diastolic septal perforator flow velocities (73). Additionally, three-dimensional heart modelling based on MR, proven to be highly reproducible and more informative (74–76), may differentiate myocardial morphology between HHD and HCM (77). Moreover, cardiac diffusion tensor imaging (DTI) (78, 79), may effectively distinguishes between HHD and HCM by analyzing myocardial fiber bundle features (like alignment, orientation, and integrity), especially given the disordered cardiomyocyte arrangement in HCM (80). Investigating these diseases across subgroups and stages will improve diagnostic accuracy and understanding of disease progression. In conclusion, the evolving CMR technology and increasing patient population underscores the importance and potential for future research in this field.
7 ConclusionOur meta-analysis reveals that multiple CMR parameters play an important role in distinguishing HHD from HCM, underscores the pathophysiological distinctions underlying these parameter differences, and highlights the importance of considering specific multiple factors in clinical interpretation. The findings also underscore the importance of standardized CMR protocols due to the impact of certain relevant variables on outcomes. These insights are essential for enhancing diagnostic precision and optimizing treatment strategies for HHD and HCM patients, while further research is needed to advance the diagnosis and understanding of these conditions.
Data availability statementPublicly available datasets were analyzed in this study. This data can be found here: this was a meta-analysis and all included articles were carefully cited.
Author contributionsQZ: Conceptualization, Data curation, Formal Analysis, Investigation, Methodology, Project administration, Resources, Software, Validation, Visualization, Writing – original draft, Writing – review & editing. ZC: Investigation, Supervision, Validation, Writing – review & editing. CQ: Software, Validation, Writing – review & editing. SX: Supervision, Validation, Writing – review & editing. RR: Software, Supervision, Writing – original draft. WL: Software, Supervision, Writing – review & editing. XZ: Software, Supervision, Writing – review & editing. YZ: Funding acquisition, Project administration, Supervision, Writing – review & editing.
FundingThe author(s) declare financial support was received for the research, authorship, and/or publication of this article.
This study has received funding by the Major Science and Technology Innovation Projects of Shandong Province (No. 2021SFGC0104).
Conflict of interestThe authors declare that the research was conducted in the absence of any commercial or financial relationships that could be construed as a potential conflict of interest.
Publisher's noteAll claims expressed in this article are solely those of the authors and do not necessarily represent those of their affiliated organizations, or those of the publisher, the editors and the reviewers. Any product that may be evaluated in this article, or claim that may be made by its manufacturer, is not guaranteed or endorsed by the publisher.
Supplementary materialThe Supplementary Material for this article can be found online at: https://www.frontiersin.org/articles/10.3389/fcvm.2024.1421013/full#supplementary-material
References2. Ommen SR, Mital S, Burke MA, Day SM, Deswal A, Elliott P, et al. 2020 AHA/ACC guideline for the diagnosis and treatment of patients with hypertrophic cardiomyopathy: a report of the American College of Cardiology/American Heart Association joint committee on clinical practice guidelines. Circulation. (2020) 142(25):e558–631. doi: 10.1161/CIR.0000000000000937
PubMed Abstract | Crossref Full Text | Google Scholar
3. Rodrigues JCL, Amadu AM, Dastidar AG, Hassan N, Lyen SM, Lawton CB, et al. Prevalence and predictors of asymmetric hypertensive heart disease: insights from cardiac and aortic function with cardiovascular magnetic resonance. Eur Heart J Cardiovasc Imaging. (2016) 17(12):1405–13. doi: 10.1093/ehjci/jev329
PubMed Abstract | Crossref Full Text | Google Scholar
4. Wang A. Hypertension and hypertrophic cardiomyopathy. In: Naidu SS, editor. Hypertrophic Cardiomyopathy. Cham: Springer International Publishing (2019). p. 221–30. doi: 10.1007/978-3-319-92423-6_16
Crossref Full Text | Google Scholar
5. Ingles J, Burns C, Bagnall RD, Lam L, Yeates L, Sarina T, et al. Nonfamilial hypertrophic cardiomyopathy. Circ Cardiovasc Genet. (2017) 10(2):e001620. doi: 10.1161/CIRCGENETICS.116.001620
PubMed Abstract | Crossref Full Text | Google Scholar
6. Marian AJ, Braunwald E. Hypertrophic cardiomyopathy: genetics, pathogenesis, clinical manifestations, diagnosis, and therapy. Circ Res. (2017) 121(7):749–70. doi: 10.1161/CIRCRESAHA.117.311059
PubMed Abstract | Crossref Full Text | Google Scholar
7. Mavrogeni SI, Kallifatidis A, Kourtidou S, Lama N, Christidi A, Detorakis E, et al. Cardiovascular magnetic resonance for the evaluation of patients with cardiovascular disease: an overview of current indications, limitations, and procedures. Hellenic J Cardiol. (2023) 70:53–64. doi: 10.1016/j.hjc.2023.01.003
PubMed Abstract | Crossref Full Text | Google Scholar
8. Gaasch WH, Aurigemma GP. CMR imaging of extracellular volume and myocardial strain in hypertensive heart disease. JACC Cardiovasc Imaging. (2015) 8(2):181–3. doi: 10.1016/j.jcmg.2014.12.002
PubMed Abstract | Crossref Full Text | Google Scholar
9. Puntmann VO, Voigt T, Chen Z, Mayr M, Karim R, Rhode K, et al. Native T1 mapping in differentiation of normal myocardium from diffuse disease in hypertrophic and dilated cardiomyopathy. JACC Cardiovasc Imaging. (2013) 6(4):475–84. doi: 10.1016/j.jcmg.2012.08.019
PubMed Abstract | Crossref Full Text | Google Scholar
10. Page MJ, McKenzie JE, Bossuyt PM, Boutron I, Hoffmann TC, Mulrow CD, et al. The PRISMA 2020 statement: an updated guideline for reporting systematic reviews. BMJ. (2021) 372:n71. doi: 10.1136/bmj.n71
PubMed Abstract | Crossref Full Text | Google Scholar
14. Duval S, Tweedie R. Trim and fill: a simple funnel-plot–based method of testing and adjusting for publication bias in meta-analysis. Biometrics. (2000) 56(2):455–63. doi: 10.1111/j.0006-341X.2000.00455.x
PubMed Abstract | Crossref Full Text | Google Scholar
15. Yao B, Wu R, Chen BH, Wesemann LD, Xu J-R, Zhou Y, et al. Cardiovascular magnetic resonance myocardial feature tracking for the determination of left atrial strain in hypertensive left ventricular hypertrophy and hypertrophic cardiomyopathy. Clin Radiol. (2023) 78(5):e409–16. doi: 10.1016/j.crad.2022.12.016
PubMed Abstract | Crossref Full Text | Google Scholar
16. Kong L-C, Wu L-M, Wang Z, Liu C, He B. An integrated algorithm for differentiating hypertrophic cardiomyopathy from hypertensive heart disease. J Magn Reson Imaging. (2023) 58(4):1084–97. doi: 10.1002/jmri.28580
PubMed Abstract | Crossref Full Text | Google Scholar
17. Jiang M, Wang Z, Su X, Gong X, Pu J, Wu L, et al. The significance of interstitial fibrosis on left ventricular function in hypertensive versus hypertrophic cardiomyopathy. Sci Rep. (2018) 8(1):9995. doi: 10.1038/s41598-018-27049-1
PubMed Abstract | Crossref Full Text | Google Scholar
18. Liu S, Li Y, Zhao Y, Wang X, Wu Z, Gu X, et al. The combination of feature tracking and late gadolinium enhancement for identification between hypertrophic cardiomyopathy and hypertensive heart disease. Front Cardiovasc Med. (2022) 9:865615. doi: 10.3389/fcvm.2022.865615
PubMed Abstract | Crossref Full Text | Google Scholar
19. Chacko BR, Karur GR, Connelly KA, Yan RT, Kirpalani A, Wald R, et al. Left ventricular structure and diastolic function by cardiac magnetic resonance imaging in hypertrophic cardiomyopathy. Indian Heart J. (2018) 70(1):75–81. doi: 10.1016/j.ihj.2016.12.021
PubMed Abstract | Crossref Full Text | Google Scholar
20. Wang Z-C, Fan Z-Z, Liu X-Y, Zhu M-J, Jiang S-S, Tian S, et al. Deep learning for discrimination of hypertrophic cardiomyopathy and hypertensive heart disease on MRI native T1 maps. J Magn Reson Imaging. (2024) 59(3):837–48. doi: 10.1002/jmri.28904
PubMed Abstract | Crossref Full Text | Google Scholar
21. Hirschberg K, Braun SM, Paul O, Ochs M, Riffel J, Andre F, et al. The diagnostic accuracy of truncated cardiovascular MR protocols for detecting non-ischemic cardiomyopathies. Int J Cardiovasc Imaging. (2022) 38(4):841–52. doi: 10.1007/s10554-021-02462-2
PubMed Abstract | Crossref Full Text | Google Scholar
22. Borenstein M, Hedges LV, Higgins JPT, Rothstein HR. A basic introduction to fixed-effect and random-effects models for meta-analysis. Res Synth Methods. (2010) 1(2):97–111. doi: 10.1002/jrsm.12
PubMed Abstract | Crossref Full Text | Google Scholar
23. Hedges LV. Distribution theory for glass’s estimator of effect size and related estimators. J Educ Stat. (1981) 6(2):107–28. doi: 10.3102/10769986006002107
Crossref Full Text | Google Scholar
26. Viechtbauer W, López-López JA, Sánchez-Meca J, Marín-Martínez F. A comparison of procedures to test for moderators in mixed-effects meta-regression models. Psychol Methods. (2015) 20(3):360–74. doi: 10.1037/met0000023
PubMed Abstract | Crossref Full Text | Google Scholar
27. Neisius U, El-Rewaidy H, Nakamori S, Rodriguez J, Manning WJ, Nezafat R. Radiomic analysis of myocardial native T1 imaging discriminates between hypertensive heart disease and hypertrophic cardiomyopathy. JACC Cardiovasc Imaging. (2019) 12(10):1946–54. doi: 10.1016/j.jcmg.2018.11.024
PubMed Abstract | Crossref Full Text | Google Scholar
28. Viera AJ, Garrett JM. Understanding interobserver agreement: the kappa statistic. Fam Med. (2005) 37(5):360–3.15883903
留言 (0)