According to a report from the International Diabetes Federation (IDF), in 2019, the global count of adult diabetes patients reached 463 million. Projections suggest this number will rise to 578 million by 2030 and surge to 700 million by 2045 (Sun et al., 2022). Diabetes-Associated Cognitive Impairment (DACI) emerges as a chronic complication of type 2 diabetes (T2DM), manifesting in diminished memory, comprehension, and spatial orientation abilities, significantly impacting patients’ self-care and quality of life. DACI has now surpassed cardiovascular complications, becoming the second leading cause of death among diabetic patients (Bellia et al., 2022; Li et al., 2023). Meanwhile, epidemiological studies indicate that T2DM can elevate the risk of Alzheimer’s disease (AD) by 1.5–2.5 times (Xue et al., 2019). The primary pathogenic mechanism of DACI involves disrupted cerebral glucose metabolism, leading to overactivation of microglial cells, resulting in neuroinflammation and subsequent cognitive impairment (Dove et al., 2021; Leng and Edison, 2021). Despite this understanding, the precise mechanism linking cognitive decline and T2DM remains incompletely elucidated, with no available drugs to effectively halt disease progression. Given the crucial role of neuroinflammation induced by activated microglial cells in DACI pathogenesis, regulating glucose metabolism to prevent excessive microglial cell activation represents a novel approach for early DACI intervention.
Compared to synthetic drugs, natural products have increasingly attracted attention as therapeutic agents due to their lower cytotoxicity and reduced side effects (Zhu et al., 2022), some natural products have demonstrated significant efficacy in improving diabetes and its complications, as well as in reducing inflammatory responses (Sharma et al., 2020). Bergenia purpurascens (Hook. f. et Thoms.) Engl., a plant belonging to Saxifragaceae, Bergenia Moench, is used in traditional Chinese medicine. Its primary active component, bergenin, a C-glycoside of 4-O-methylgallic acid, exhibits diverse pharmacological effects, including the regulation of glucose and lipid metabolism, anti-inflammatory properties, and mitigation of oxidative stress (Barai et al., 2019; Villarreal et al., 2020; Zhang et al., 2023). Numerous studies have demonstrated bergenin’s role in regulating glucose metabolism and improving diabetes and its complications (Barai et al., 2019; Qiao et al., 2019; Villarreal et al., 2020; Yin et al., 2023; Zhang et al., 2023). Recent research has identified bergenin as a promising therapeutic agent for inhibiting glycolysis by downregulating Hexokinase 2 (HK2), the first glycolytic rate-limiting enzyme (Li et al., 2023). Furthermore, bergenin modulates the production of pro- and anti-inflammatory cytokines, reducing the expression of IL-1β, IL-6, and TNF-α proinflammatory cytokines, thereby ameliorating inflammatory responses (Yin et al., 2023). Additionally, bergenin exerts neuroprotective effects, improving cognitive dysfunction (Ji et al., 2019; Singla et al., 2022).
Zebrafish offer distinct advantages in studying mechanisms of glucose metabolism, sharing biological mechanisms with humans in regulating glucose homeostasis (Zang et al., 2017). Key metabolic organs and genes are conserved in zebrafish (Cox et al., 2018), which exhibit hyperglycemic symptoms and impaired glucose metabolism when fed a glucose-rich diet (Kleinert et al., 2018). The zebrafish model of type II diabetes mellitus responds positively to antidiabetic drugs like metformin and glimepiride, making them valuable models for investigating human diabetes and metabolic disorders (Mohammadi et al., 2020). Furthermore, the skin or gills of zebrafish provide a gateway for non-invasive administration of biologically active compounds, allowing precise delivery into the water surrounding hundreds of zebrafish embryos, larvae, or adults (Angom and Nakka, 2024). This feature makes zebrafish an independent system for screening antidiabetic drugs, validating their effects on type 2 diabetes mellitus (T2DM) complications, and studying pharmacokinetics (Wang et al., 2023).
The peroxisome proliferator-activated receptors (PPARs) are members of the nuclear receptor superfamily. PPARγ, a ligand-dependent nuclear transcription factor, translocates into the nucleus and binds to PPAR response elements (PPREs) upon ligand binding, thereby regulating the transcription and translation of downstream target genes involved in lipid and glucose metabolism as well as inflammation (Chen et al., 2023). This renders PPARγ an attractive pharmacological target for treating metabolic diseases such as insulin resistance, type 2 diabetes (Shehnaz et al., 2023), chronic inflammation, and degenerative disorders (Geng et al., 2018). NF-κB serves as a pivotal transcription factor in inflammation regulation. The nuclear translocation of NF-κB heterodimers plays a crucial role in microglial cell activation, induced by pro-inflammatory stimuli such as IL-1β, IL-6, and TNF-α (Poma, 2020; Peng et al., 2022). It is noteworthy that multiple experiments have demonstrated Bergenin’s role as a natural PPARγ agonist. The activation of PPARγ inhibits IκBα degradation, p65 nuclear translocation, DNA-binding activity, and phosphorylation, or indirectly inhibits NF-κB activation by competitively binding to p65, thereby reducing the production of pro-inflammatory cytokines and chemokines (Wang et al., 2017; Yang et al., 2022).
Given the pivotal roles of glucose metabolism disorder and neuroinflammation in diabetic neuropathy, this study aims to confirm bergenin’s potential protective effects against high glucose-induced glycolysis enhancement and neuroinflammatory responses, while preliminarily exploring its pharmacological mechanisms. This study employs the zebrafish model for rapid assessment of drug safety and validation of pathological mechanism hypotheses. Subsequently, a comprehensive investigation into the molecular mechanisms was conducted using rat and cell models (Supplementary Figures S1, 2).
2 Materials and methods2.1 Experimental animals and cellsWild-type zebrafish (AB line, Danio rerio) and transgenic zebrafish (CZ98:Tg (mpeg1:EGFP)ihb20Tg/+) were obtained from the China Zebrafish Resource Center and bred at the Zebrafish Breeding Platform of the Hunan Key Laboratory for Integrative Prevention and Treatment of Cardio-Cerebral Diseases, Hunan University of Chinese Medicine. Zebrafish were maintained in tanks with a water temperature of 28°C ± 0.5°C, pH 7.0–7.3, dissolved oxygen 7.3 ± 0.2 mg/L, conductivity 460 ± 50 μS/cm, water hardness 128 ± 25 mg/L, and salinity of 0.3 ng/L (Shang et al., 2024), under a light-dark cycle of 14 h:10 h with eight fish reared in each 1-L tank. They were fed twice daily at 08:30 and 17:30 with newly hatched Artemia salina. Embryos were obtained through natural breeding. Fertilized eggs were collected and incubated at 28°C in an incubator. All research protocols were approved by the Experimental Animal Ethics Committee of Hunan University of Chinese Medicine (Changsha, China), Approval number: LLBH-202205030001.
The BV2 cell line was purchased from Wuhan PuNuoSai Biotechnology Co., Ltd. and cultured in RPMI 1640 medium containing 10% fetal bovine serum and 1% penicillin-streptomycin at 37°C under 5% CO2 (He et al., 2024).
SPF-grade male SD rats (n = 50), weighing (150 ± 20) g, were purchased from Hunan Slaike Jingda Experimental Animals Co., Ltd. (License No.: SCXK(Hunan)2021–0004). The rats were housed in the SPF-grade animal barrier system at the Animal Experimental Center of Hunan University of Chinese Medicine, with three rats per cage. They were fed standard animal feed and water, maintained at a constant temperature of (25 ± 2)°C, and subjected to a 12-h light-dark cycle. The experimental procedures complied with ethical standards for animal research (LLBH202205100001).
2.2 Drugs and reagentsBergenin (MedChemExpress, HY-N0017); Metformin Hydrochloride, Hexokinase (HK), Phosphofructokinase (PFK), Pyruvate Kinase (PK) Activity Assay Kit (Beijing Solarbio Science & Technology Co., Ltd., SM9400, BC0745, BC0535, BC0545); Glucose, Lactic Acid assay kit (Nanjing Jiancheng Biotech Co., Ltd., A154-1-1, A019-2-1); β-amyloid peptides (Shanghai Aladdin Bio-Chem Technology Co., Ltd., B111464); 2-DG, DADA, DMSO (Sigma-Aldrich, D8375-1G, D135665, D2650-100 ML); Fetal bovine serum, RPMI 1640 medium (Gibc, 10099-141, 11875093); D-glucose solution, Penicillin-Streptomycin Solution (Wuhan Pricella Biotechnology Co.,Ltd., PB180418, PB180120); Serum-free freezing medium, β-actin, IL-1β, IL-6, TNF-α primers (Shanghai BioWork Biotech Co., Ltd., 05-065-1B); TRIzol Reagent (Thermo Fisher Scientific, 15596018); Isopropyl alcohol (Macklin, I811925); Reverse transcription kit (Suzhou Jinkang Protein Technology Co., Ltd., 0521751); SYBR Green Premix (Shanghai MoNa Biotechnology Co., Ltd., MQ00401); DEPC-treated Water (Beyotime, R0022); PPAR gamma Antibody, NF-κB p65 Polyclonal Antibody (Bioss, BS-0530R, RRID:AB_10860216, BS-0465R, RRID:AB_10855447); Anti-RELA (Phospho-Ser276) rabbit polyclonal antibody (Sangon Biotech, D155005); β-actin (Affinity Biosciences, AF7018, RRID:AB_2839420); Goat anti-rabbit secondary antibody (Sigma-Aldrich, AP132P); RIPA Lysis Buffer (Cwbio, CW233S); BCA Protein Quantification Kit (Multi Sciences, PQ0012); Streptozotocin (STZ, Sigma-Aldrich, S0130).
2.3 Experimental instrumentsZebHigh-throughput Observation Chamber for Zebrafish Embryo Larvae, Automated Zebrafish Analysis System for Adult Fish Observation Tower (Viewpoint, France); Conventional Brightfield Microscope (Leica, S9i); BioTek Cytation™ 5 Cell Imaging Multi-Mode Reader (Agilent Technologies Co., Ltd., China); DW-2000D Brain Locating Instrument (Chengdu Techman Software Co., Ltd.); Smart 3.0-Video Tracking System (Panlab, RRID:SCR_002852); Tri-Gas Incubator (Thermo Fisher Scientific, United States); Inverted Fluorescence Microscope (Zeiss, Germany); SorvallTM LegendTM Micro 17R Microcentrifuge (Thermo Fisher, United States); Cytation3 Multimode Reader (Bio-Tek, United States); T100TM Thermal Cycle, CFX96 Touch Real-Time PCR Detection System (Bio-Rad, United States); Mini-PROTEAN Tetra Electrophoresis System, Mini Trans-Blot Transfer System (Bio-Rad, United States); ChemiDoc XRS + Chemiluminescence Gel Imaging System (Bio-Rad, United States of America); HM 325 Paraffin microtome (Thermo Fisher, United States); Tissue-FAXS Plus Panoramic Tissue Scanning Imaging System (Tissue Gnostics GmbH, Austria).
2.4 Zebrafish experiment2.4.1 Embryo-Larvae rearing and experimental groupingThe macrophage-specific GFP transgenic zebrafish (CZ98:Tg(mpeg1:EGFP)ihb20Tg/+) were selected for the experiment. Healthy zebrafish embryos at 9 h post-fertilization (hpf) were randomly allocated to 6-well plates, with 30 embryos per well. Based on preliminary findings on glucose, bergenin, and metformin concentrations, the embryos were divided into four groups: Control (0.1% DMSO), Model (1% glucose + 0.1% DMSO), Bergenin (1% glucose + 2.5 mg/L bergenin), and Metformin (1% glucose + 3 mg/L metformin). Bergenin and metformin were dissolved in 0.1% DMSO for administration. Each group had three replicate wells. The plates were incubated in a constant temperature light incubator at 28°C ± 0.5°C, under a light-dark cycle of 14 h:10 h, with the solution changed every 24 h.
2.4.2 Hatchability, survival rate, and teratogenicity analysisThe hatching rate was calculated on day 5 post-fertilization (dpf). Zebrafish embryos were examined for abnormalities such as organ edema and spinal curvature. Survival rate was determined on day 8 post-fertilization after larval rearing. (Li et al., 2022).Tissues were phosphate-buffered saline (PBS)-washed, homogenized at 0.1 g per sample with 1 mL extraction buffer on ice, then centrifuged at 8000 g for 10 min at 4°C. The resulting supernatant was collected and stored on ice for subsequent analysis. Glucose content in the supernatant was assessed following assay kit instructions. Prompt removal of detached embryo membranes and dead larvae was ensured.
2.4.3 Zebrafish Larval brain fluorescence signal recordingMicroglial cell activation in the brain was assessed by directly detecting fluorescence in the macrophage-specific GFP transgenic zebrafish (96hpf) using a fluorescence microscope (Bruzzone et al., 2021). The intensity and aggregation of green fluorescent signals within the brain can directly reflect the degree of microglial cell activation, thereby indirectly indicating the extent of inflammation response in the brain.
2.4.4 Zebrafish Larval behavioral experimentThe locomotion patterns of zebrafish larvae were observed on the 5 th day post modeling administration. Zebrafish were grouped and placed in a 12-well plate containing 1 mL of embryo medium before being transferred to the Zebrafish High-throughput Observation Chamber. Videos and images capturing locomotion trajectories were recorded to quantify the distance (mm) and speed of movement for each fish. Movement was categorized into high-speed (>10 mm/s), medium-speed (2–10 mm/s), and low-speed (<2 mm/s) to determine their states. Zebrafish locomotion distance and trajectories were recorded and analyzed for 60 s in this experiment (Benvenutti et al., 2021).
2.4.5 The grouping and treatment of adult zebrafish experimentsA total of 240 adult zebrafish (6–8 months old) were randomly assigned to control, model, and three bergenin dose groups (1.25 mg/L, 2.5 mg/L, and 5 mg/L), as well as a metformin group (3 mg/L), with each group containing 40 fish. The control group remained in standard water conditions, while the model, bergenin, and metformin groups were immersed in a 2% glucose solution (10 fish per 1500 mL) for 28 days. (Chen and Liu, 2022). Fish were fed three times the standard amount of Artemia daily to induce hyperglycemia. Starting from day 21, the low, medium, and high-dose bergenin groups, along with the metformin group, received continuous administration for 7 days. Measurements of body length, weight, body mass index (BMI), and blood glucose levels were obtained via tail clipping. Half of the solution volume in each tank was replaced daily.
2.4.6 Zebrafish vitality and T-maze behavioral testing experimentFollowing drug administration, behavioral and T-maze experiments were conducted on zebrafish to observe changes and assess the efficacy of the model and medication. Zebrafish behavioral tests were conducted in a square tank, with each fish observed for 180 s per trial over three consecutive days. This method serves to assess zebrafish vitality and anxiety levels (Wang et al., 2023). Furthermore, the T-maze was used to evaluate zebrafish learning and memory. The T-maze consisted of horizontally equal-length left and right arms and a vertical channel. Specifically, the left arm was designated as the Enriched Chamber (EC) area, where specific enrichment was provided. The starting point was located at one end of the vertical channel, which corresponds to the end of the non-equal length left and right arms. The testing period spanned 5 days.
Formal testing began promptly at 09:00 each morning. Prior to the start, a single zebrafish designated for testing was placed in the starting zone. It was allowed 1 min to acclimate to the T-maze environment, including water quality and temperature, with the starting zone closed during this period. Following adaptation, the barrier in the starting zone was opened. The zebrafish was then allowed to freely explore the T-maze, aiming to find and remain in the Enriched Chamber (EC) area for 30 s. Zebrafish successfully entering the EC area were rewarded with food after the 6-min test. If a zebrafish failed to find the EC area within the allotted time, a correction procedure was initiated after 6 min. In this procedure, the barrier on the non-EC side of the T-maze was closed, and the experiment was repeated, guiding the zebrafish from the starting zone to the EC area and encouraging it to stay for 3 min, followed by a food reward.
During formal testing, zebrafish initiated from the starting zone and staying in the Enriched Chamber (EC) area for 30 s were considered as having entered the EC area. The testing duration was set at 6 min. Zebrafish swimming trajectories were recorded and represented by different colored lines based on their speed: white lines indicated slow movement (<2 cm/s), green lines indicated moderate movement (2–5 cm/s), and red lines indicated high-speed movement (>5 cm/s). Swimming trajectories were documented, and parameters such as total swimming distance, average swimming speed, latency to enter the EC area, and cumulative time spent in the EC area were quantified. A longer swimming distance and faster swimming speed within the designated time frame indicated higher vitality. A shorter latency to enter the EC area and longer cumulative time spent in the EC area indicated stronger recognition of the EC area, implying enhanced learning and memory capabilities (Benvenutti et al., 2021).
2.4.7 Sample collection of adult zebrafish experimentsAfter completing the T-maze behavioral test, brain tissue samples were collected. Thirty zebrafish were randomly selected from each group and anesthetized in ice water. Their brains were dissected and placed in cryovials on ice. Liver and muscle samples were also obtained, rapidly frozen in liquid nitrogen, and stored at −80°C. Additionally, 10 zebrafish from each group were anesthetized in ice water, and their heads were swiftly removed on ice. The excised heads were then placed in 1.5 mL tubes and immersed in Bouin’s solution for 24 h for fixation. Subsequently, brain tissue was dissected to prepare for subsequent H&E staining experiments, and gill samples were also collected (Luo et al., 2024).
2.4.8 Detection of glucose consumption, lactate production and the activities of Hexokinase (HK), Phosphofructokinase (PFK), pyruvate Kinase (PK)15 zebrafish brain tissues were randomly selected from each group, divided into three portions of 0.1 g tissue each. Each portion was homogenized in 1 mL of extraction buffer on ice. The homogenate was then centrifuged at 8000 g for 10 min at 4°C. The supernatant was collected and used for analysis. Glucose content, lactate production, and the activity levels of hexokinase (HK), phosphofructokinase (PFK), and pyruvate kinase (PK) were determined using commercially available assay kits following the manufacturer’s instructions (Li et al., 2022).
2.4.9 Tissue pathological analysisAfter fixation in Bouin’s solution for 24 h, brain and gills tissues were sliced in the sagittal plane using a paraffin microtome. Following deparaffinization, 1% methylene blue was applied for 25 min at 37°C, followed by 95% ethanol differentiation for 30 s. The tissues were then subjected to gradient dehydration, xylene transparency, covered with coverslips, and sealed with neutral resin. Hematoxylin and eosin (HE) staining was utilized to observe morphological pathological changes in the zebrafish brain and gills tissues (Luo et al., 2024).
2.5 Cell experimentsWhen BV2 cells reached the logarithmic growth phase, they were harvested and plated at a density of 3×10⁵ cells per well in 6-well plates (He et al., 2024). The experimental groups comprised control, model, bergenin, glycolysis inhibitor 2-deoxy-D-glucose (2-DG), and pyruvate dehydrogenase activator diisopropylamine dichloroacetate (DADA), each with 3 replicate wells. The control group received RPMI 1640 medium, while the model, bergenin, 2-DG, and DADA groups were treated with 50 mM glucose and 10 μM Aβ1-42 oligomers for 24 h to establish a BV2 model of glucose metabolism disorder and inflammation activation. After establishing the High-glucose-induced BV2 model, the bergenin group received continuous administration of 40 μg/mL bergenin, the 2-DG group received 0.2 mM 2-DG, and the DADA group received 1 mM DADA for an additional 24 h. Bergenin was dissolved in DMSO, while 2-DG and DADA were dissolved in sterile water.
2.6 Rat experiment2.6.1 Animal modeling and groupingAfter 1 week of acclimation feeding, fifty rats were randomly assigned to five groups: Control (sham surgery), Model, Low-dose (20 mg/kg/d) Bergenin, High-dose (80 mg/kg/d) Bergenin, and Metformin (150 mg/kg/d), each comprising 10 rats. Prior to modeling, rats underwent a 12-h fast, followed by anesthesia with 3% pentobarbital sodium. Using the sixth edition of the “Rat Brain Stereotaxic Atlas” as a guide, their heads were secured in a brain fixation device, with needle insertion coordinates determined relative to the anterior fontanelle: 0.8 mm posteriorly, 1.5 mm laterally to the left and right of the skull midline, and a depth of 3.7 mm from the skull surface (He et al., 2023). In groups other than the sham surgery group, rats received controlled injections of 5 μL STZ (2.4 mg/kg) into each side of the lateral ventricle at a rate of 1 μL/min (Jin et al., 2023). The sham surgery group received 5 μL of normal saline. After injection, the needle remained in place for 5 min before wound closure, and the animals were returned to their cages for observation, awaiting natural awakening. After 2 days post-modeling, intragastric administration was carried out twice daily at 9:00 a.m. and 6:00 p.m. for 14 consecutive days (Sharma et al., 2020). Both the control and model groups received equivalent volumes of normal saline.
2.6.2 Morris water mazeAfter 14 days of drug intervention, the Morris water maze was conducted. A constant-temperature swimming pool (1.6 m in diameter) was used, and rats were placed into the maze 1 day prior for a 120-s free swim for acclimatization. The maze was divided into four quadrants, and a 12 cm-diameter platform was placed at the center of the first quadrant (platform quadrant) with water added to a depth of 1 cm. Smart 3.0 software recorded the rats’ movement trajectories and time-distance data. Over the first 5 days, rats were placed facing the wall of each of the four quadrants at a fixed time each day, and the software set a 1 min search time for the platform (escape latency). If the rat remained on the platform for more than 2 s within 1 min, the test was terminated, and the time recorded. If not, the escape latency was recorded as 60 s, and the rat was guided to the platform for a 20-s stay for learning and memory. On the 6th day, the platform was removed, and rats were placed into the water from the opposite quadrant of the platform quadrant. The number of times the rats crossed the original platform area within 60 s and the time spent in the platform quadrant were recorded (He et al., 2023).
2.6.3 Sample collection and preservationThe rats were anesthetized with intraperitoneal injections of 3% pentobarbital sodium based on their body weight. Subsequently, their limbs were secured, and a U-shaped incision was made in the abdominal cavity. The right atrium was opened, and 50 mL of pre-cooled physiological saline was injected into the left ventricle until the visceral organs became pale, indicating successful cardiac perfusion (Jin et al., 2023). The head was then severed, and the left brain was fixed in 4% paraformaldehyde. The right brain was divided into the cortex and hippocampus, snap-frozen in liquid nitrogen, and then stored in a −80°C freezer.
2.6.4 Hematoxylin and eosin (HE) staining and Nissl stainingAfter fixing the left hemisphere, alcohol gradient dehydration, xylene clearing, paraffin embedding, and sectioning using a microtome at a thickness of 3 µm in the coronal plane were performed. Following deparaffinization in xylene and rehydration through a graded series of alcohols, one portion of the sections underwent 5 min staining with hematoxylin, followed by rinsing in running water and differentiation in 0.5% hydrochloric acid ethanol for 1 min, with termination of differentiation by rinsing in running water, immersion in PBS for counterstaining, and final staining with eosin for 1 min. The other portion of the sections underwent 25-min staining with 1% cresyl violet at 37°C, followed by differentiation in 95% ethanol for 30 s and termination of differentiation by rinsing in running water (He et al., 2023). Dehydration was then performed in a gradient of 70%–90% ethanol for 10 min each, followed by absolute ethanol dehydration, xylene clearing, application of neutral resin, covering with coverslips, and air-drying at room temperature. The dorsal hippocampal area was observed under an optical microscope, and photomicrographs were taken for histological analysis.
2.6.5 Detection of glucose consumption, lactate production and the activities of Hexokinase (HK), Phosphofructokinase (PFK), pyruvate Kinase (PK)Brain tissue samples from nine rats were randomly selected from each group, divided into three portions of 0.1 g tissue each. Each portion was homogenized in 1 mL of extraction buffer on ice. The homogenate was then centrifuged at 8000 g for 10 min at 4°C. The supernatant was collected and used for analysis. Glucose content, lactate production, and the activity levels of hexokinase (HK), phosphofructokinase (PFK), and pyruvate kinase (PK) were determined using commercially available assay kits following the manufacturer’s instructions (Pancera et al., 2006).
2.7 Quantitative real-time PCR (RT-qPCR)Total RNA was extracted using the TRIzol method, followed by reverse transcription into cDNA. SYBR Green dye method was utilized with the Bio-Rad CFX96 real-time PCR system for amplification. The PCR program entailed an initial denaturation at 95°C for 10 min, followed by 40 cycles of denaturation at 95°C for 5 s and annealing/extension at 58°C for 30 s (Jin et al., 2023). Melting curve analysis was performed from 65°C to 95°C with 0.5°C increments to detect fluorescence signals. β-actin served as an internal reference, and relative expression levels of target genes were analyzed using the 2−ΔΔCt method. Primer sequences are provided in Table 1.
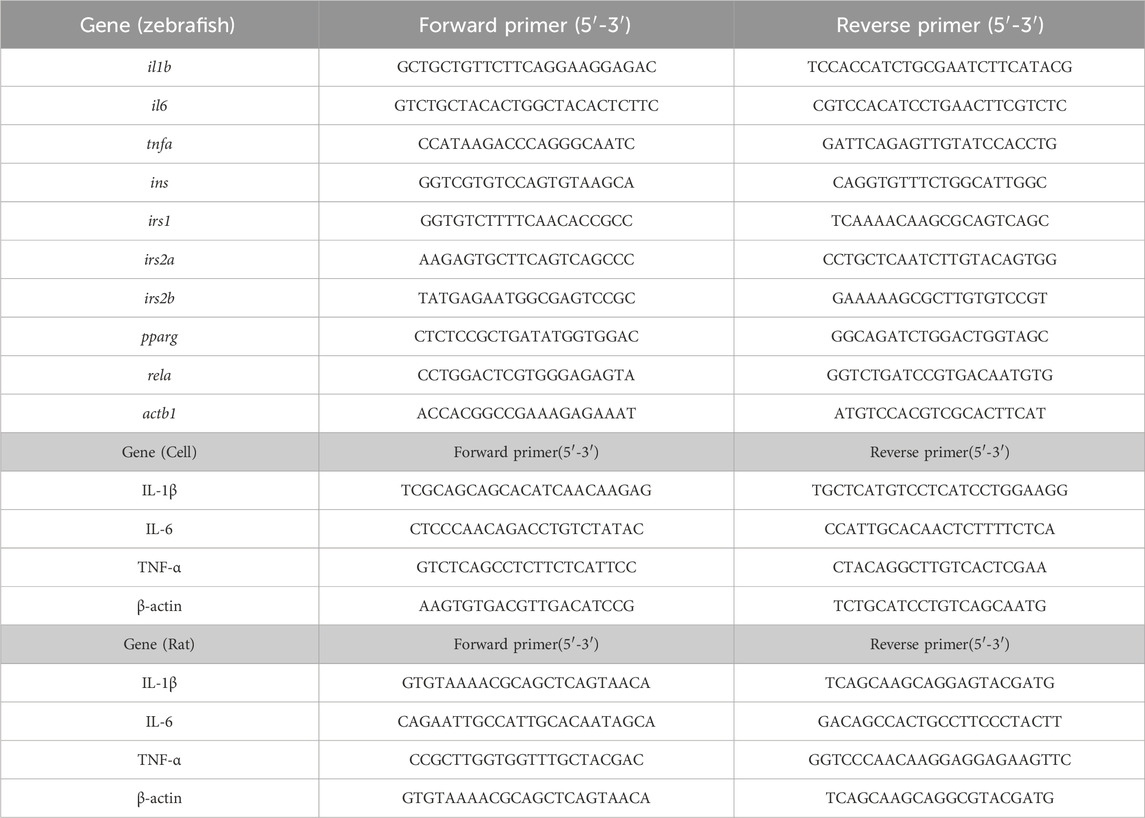
Table 1. Primer sequences of PCR.
2.8 Western blotTotal cellular proteins were extracted and quantified using the BCA assay. Protein concentrations were adjusted to 2 μg/μL for sample buffer preparation. Electrophoresis was conducted at 80 V for 30 min, followed by an adjustment to 100 V for 90 min. Wet transfer to a membrane was performed at 200 mA for 90 min. The membrane was then incubated with 5% non-fat milk (prepared in TBST) at room temperature for 1 h. Primary antibodies against GLUT1 (1:1000), HK2 (1:1000), PFKFB3 (1:2000), PKM2 (1:2000), PPARγ (1:1000), NF-κB (1:1000), P-NF-κB (1:1000) and β-actin (1:10000) were applied overnight at 4°C, followed by three washes with TBST for 10 min each. Subsequently, the membrane was incubated with goat anti-rabbit secondary antibody (1:8000) at 37°C for 1 h with shaking, followed by three washes with TBST for 10 min each (He et al., 2023). Chemiluminescence imaging was performed using a gel imaging system, and grayscale analysis was conducted using ImageJ software.
2.9 Statistical analysisThe statistical analysis was performed using GraphPad Prism 8.0. The differences between groups were analyzed using One-way analysis of variance (One Way ANOVA) and Pearson Chi-square test. All data are expressed as the mean ± SD. A probability value of P< 0.05 was considered to indicate a statistically significant difference.
3 Results3.1 The effect of bergenin on high-glucose-induced Zebrafish3.1.1 The effect of bergenin on High-Glucose-Induced Zebrafish LarvaeUsing a glucose assay kit, the glucose content in each group of zebrafish was measured to investigate the effect of bergenin on glucose levels in zebrafish larvae induced by high glucose. As shown in Figure 1A, the glucose content in zebrafish larvae in the model group was significantly elevated compared to the control group (P < 0.01), with a mean of 0.029 mmol/g protein, which was 6–7 times higher than that of the control group (0.004 mmol/g protein). After administration of bergenin (P < 0.01) and metformin (P < 0.01), the blood glucose levels significantly decreased. This indicates that the high-glucose-induced zebrafish larval model was established, and bergenin has potential hypoglycemic effects. Next, we evaluated the impact of bergenin on the development of zebrafish larvae induced by high glucose. As shown in Figure 1A, the hatching rates of zebrafish larvae in each group were minimally affected. In Figure 1A, exposure to high glucose resulted in a significant decrease in the survival rate of zebrafish larvae (P < 0.01). Conversely, the bergenin (P < 0.01) and metformin (P < 0.01) treatment groups exhibited significantly increased survival rates. Additionally, the model group displayed developmental teratogenicity such as organ edema and spinal curvature, with a teratogenicity rate of 26.7%. However, the teratogenicity rates decreased to 13.3% and 11.1% in the bergenin and metformin groups, respectively (Figures 1A,B) (Table 2).
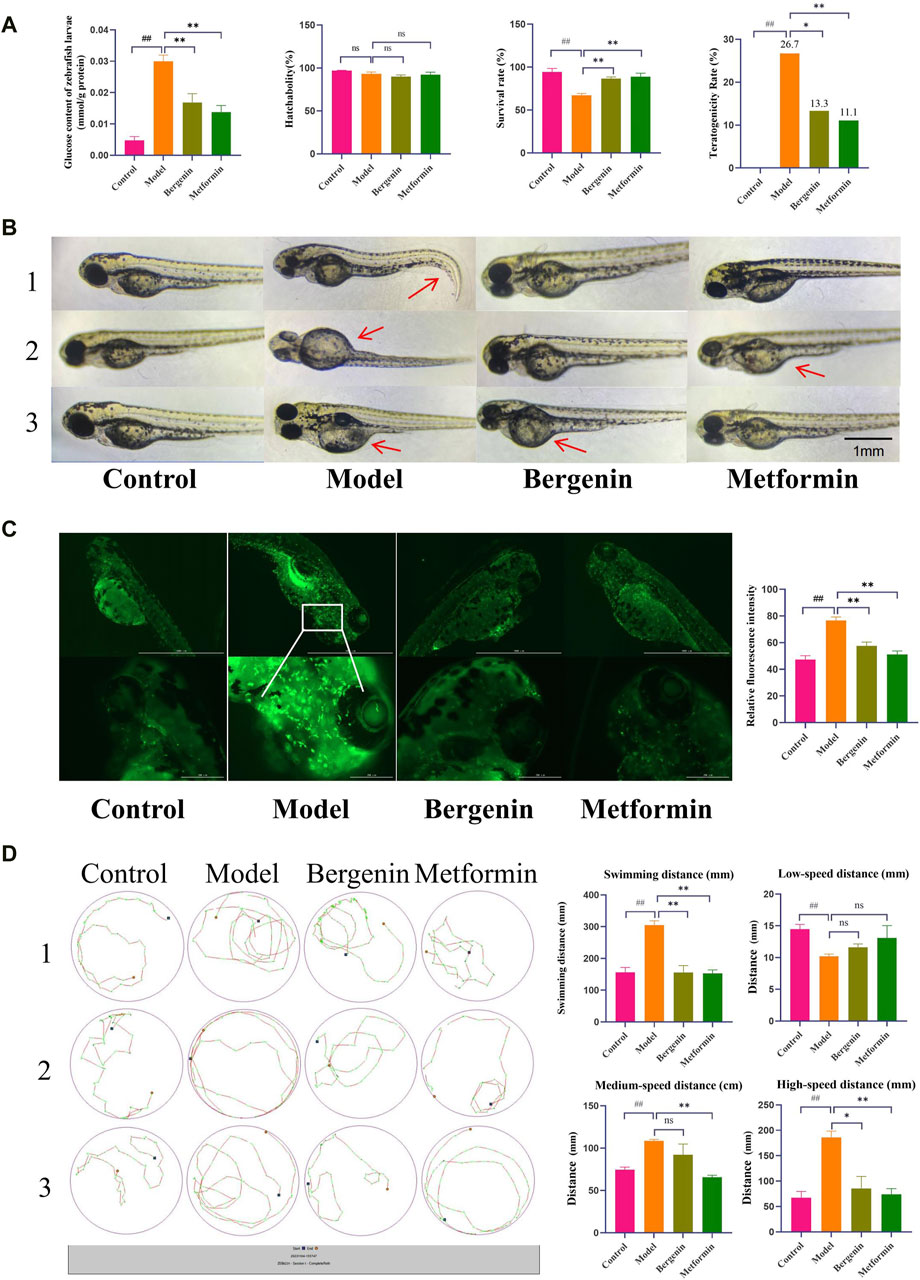
Figure 1. Effects of Bergenin on High-Glucose-Induced Zebrafish Larvae. (A) Glucose Content in Zebrafish Larvae; Hatchability, Survival Rate, Teratogenicity Rate of Zebrafish Larvae; (B) Teratogenicity in zebrafish larvae; The arrow points to teratogenic effects, such as organ edema or tail malformation; (C) Fluorescence Expression in the Brains of Zebrafish Larvae and Relative Fluorescence Intensity; (D) Behavioral Trajectory Plot of Zebrafish Larvae and Statistical Analysis of Zebrafish Larval Behavior Data: Total Swimming Distance; Low-Speed Distance (<2 mm/s); Medium-Speed Distance (2–10 mm/s); High-Speed Distance (>10 mm/s). “ns” indicates no statistical significance; ##P < 0.01 indicates significance compared to the control group; *P < 0.05, **P< 0.01 indicates significance compared to the model group. (One-way ANOVA and Pearson Chi-square test, Mean ± SD, N = 30).
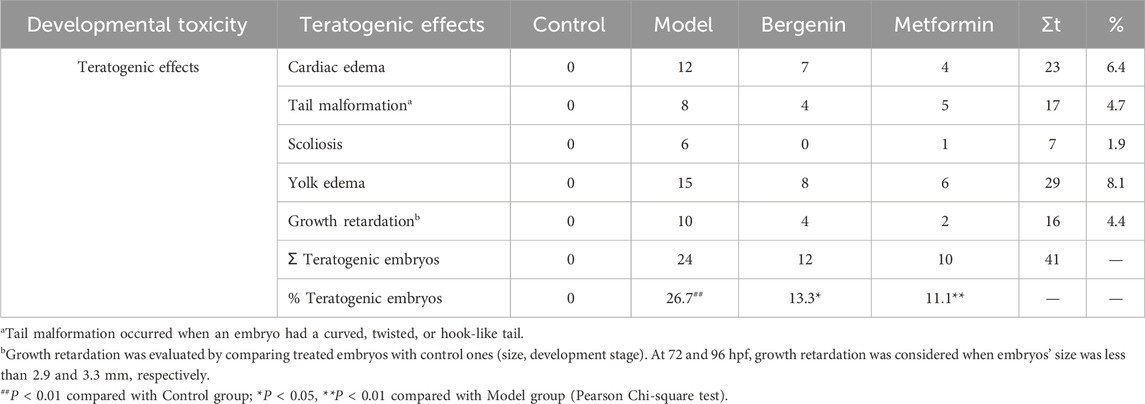
Table 2. Deformities in zebrafish larvae.
Bergenin significantly affects the activation of zebrafish larval microglial cells induced by high glucose. The transgenic zebrafish line CZ98:Tg(mpeg1:EGFP)ihb20Tg/+ expresses green fluorescent protein driven by the mpeg1 promoter, specifically labeling macrophages. Activated macrophages exhibit strong green fluorescence. As shown in Figure 1C, high glucose induces increased systemic macrophage activation in zebrafish, with significantly elevated microglial activation in the brain, as indicated by the relative fluorescence intensity (P < 0.01). Subsequent treatment with bergenin (P < 0.01) and metformin (P < 0.01) results in a marked decrease in microglial fluorescence expression in the brain.
Additionally, we also observed the effects of bergenin on the behavior of zebrafish larvae induced by high glucose. Elevated blood glucose levels may lead to increased intracellular oxygen pressure through pathways such as mitochondrial dysfunction, reactive oxygen species production, and blood flow alterations (Kashihara et al., 2022). As illustrated in Figure 1D, zebrafish larvae in the model group exhibited significantly enhanced locomotor activity, with total distance traveled and swimming speed notably higher compared to other groups (P < 0.01). High-speed swimming (>10 mm/s) was increased (P < 0.01), accompanied by abnormal behaviors such as circling near the edge of the well, known as wall-hugging behavior. Following administration of bergenin (P < 0.01) and metformin (P < 0.01), swimming speed slowed down, primarily manifesting as medium to low-speed movements (2–10 mm/s, <2 mm/s), and swimming trajectories tended towards normalcy.
3.1.2 The Effects of Bergenin on High glucose-induced Zebrafish AdultsWe first evaluated the effect of bergenin on zebrafish BMI and blood glucose induced by high glucose. As shown in Figures 2A–C, zebrafish in the model group exhibited greater abdominal fat deposition compared to other groups, with a mean BMI of 38.5 mg/cm2 and a mean blood glucose level of 5.82 mmol/L, both significantly higher than the control group (P < 0.05 and P < 0.01). The mean BMI values in the bergenin groups and the metformin group were significantly lower than those in the model group (P < 0.01), accompanied by a significant reduction in blood glucose levels compared to the model group (P < 0.01). Furthermore, we assessed the impact of bergenin on the behavior of zebrafish induced by high glucose using the adult zebrafish behavioral observation system. As observed in the behavioral swimming trajectories and statistical data presented in Figures 2D,E, zebrafish in the model group predominantly exhibited red-colored swimming trajectories, with significantly higher total distance traveled and swimming speed compared to other groups, along with an increase in high-speed swimming (>5 cm/s) (P < 0.01). In contrast, zebrafish treated with varying doses of bergenin and the metformin group showed reduced swimming speed, trending towards more green-colored trajectories, primarily characterized by medium to low-speed movements (2–5 cm/s, <2 cm/s) (P < 0.01), indicating a tendency towards normalized swimming trajectories. Finally, we evaluated the effect of bergenin on the learning and memory abilities of zebrafish induced by high glucose through the T-maze experiment. As shown in Figures 2F–H, zebrafish with normal learning and memory abilities can identify food rewards in the EC area through learning. As formal training progresses, the latency to enter the EC area decreases, while the time spent and distance traveled in the EC area increase. Compared to the control group, zebrafish in the model group exhibit higher total distance traveled and average speed, but weaker recognition ability towards the EC area. Interestingly, as learning progresses, the distance and time spent in the EC area decrease. Zebrafish treated with bergenin and metformin show enhanced recognition ability towards the EC area, with significant increases in the time spent and distance traveled in the EC area as training progresses.
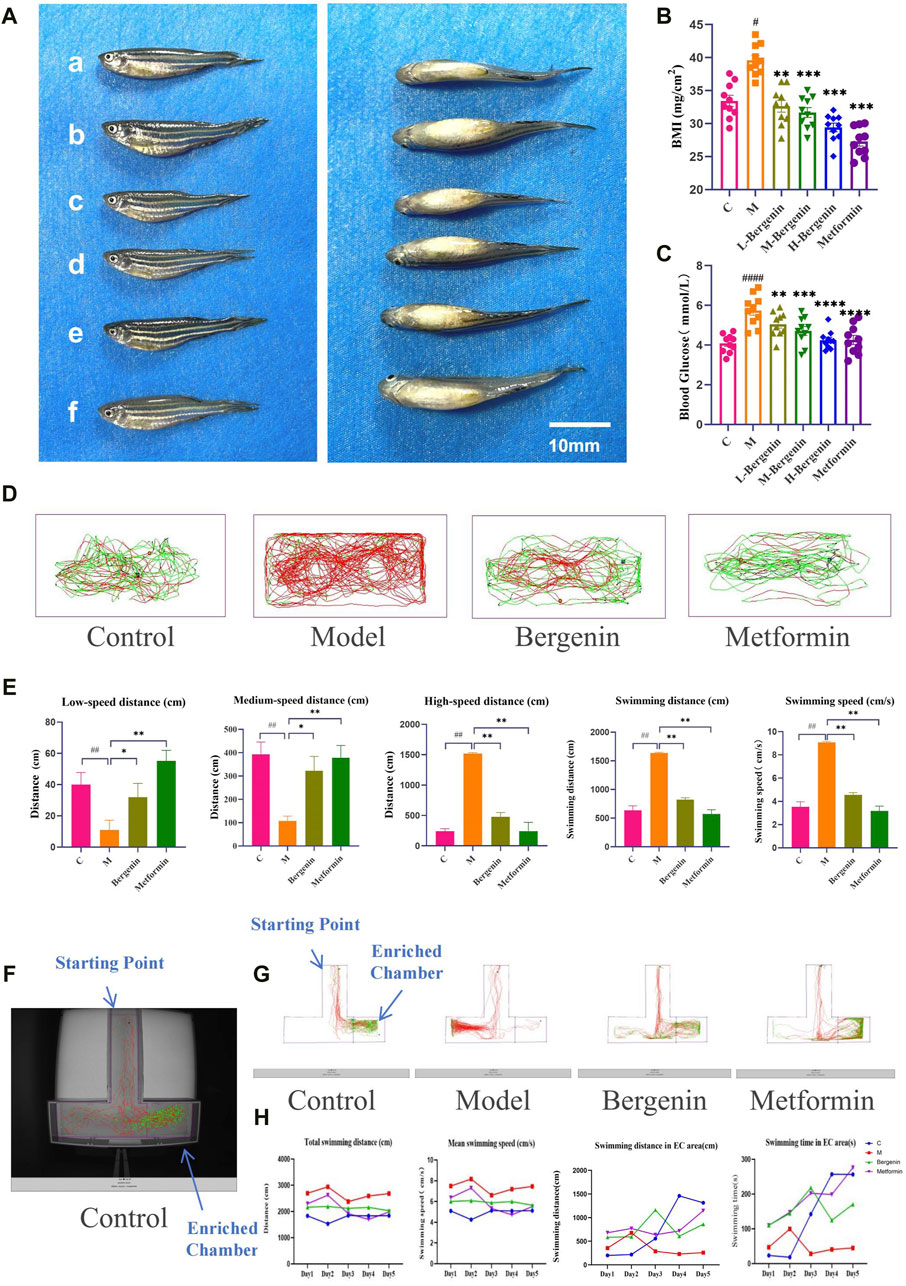
Figure 2. Effects of Bergenin on High-Glucose-Induced Zebrafish Adults. (A) Imaging of Adult Zebrafish After Modeling and Drug Administration; (B) Body Mass Index (BMI) of Zebrafish Adults; (C) Blood Glucose of Zebrafish Adults; (D) Zebrafish Behavioral Trajectories; (E) Statistical Analysis of Zebrafish Behavior Data: Low-Speed Distance (<2 cm/s); Medium-Speed Distance (2–5 cm/s); High-Speed Distance (>5 cm/s); Total Swimming Distance; Swimming Speed; (F) Actual Scene of T-Maze; (G) Zebrafish Behavioral Trajectories in the T-maze. (H) Statistical Analysis of Zebrafish T-Maze Data: Total Swimming Distance; Mean Swimming Speed; Swimming Distance in EC area; Swimming Time in EC area. #P < 0.05, ##P < 0.01, ####P < 0.001 indicates significance compared to the control group; *P < 0.05, **P < 0.01, ***P < 0.001, ****P < 0.0001 indicates significance compared to the model group. (One-way ANOVA, Mean ± SD, N = 20).
3.1.3 The effect of bergenin on inflammatory in high glucose-induced zebrafishHE staining revealed an increase in activated microglia, indicating enhanced inflammatory response in the telencephalic region of the model group (P < 0.01) (Figure 3A). Gill tissues observations included dilatation of capillaries, capillary disarrangement, vascular congestion, and hyperplasia of epithelial cells on secondary lamellae of the model group (P < 0.01) (Figure 3B). After treatment with bergenin and metformin, pathological changes in the telencephalon and gills were partially alleviated, leading to reduced congestion and associated inflammatory alterations (P < 0.01).
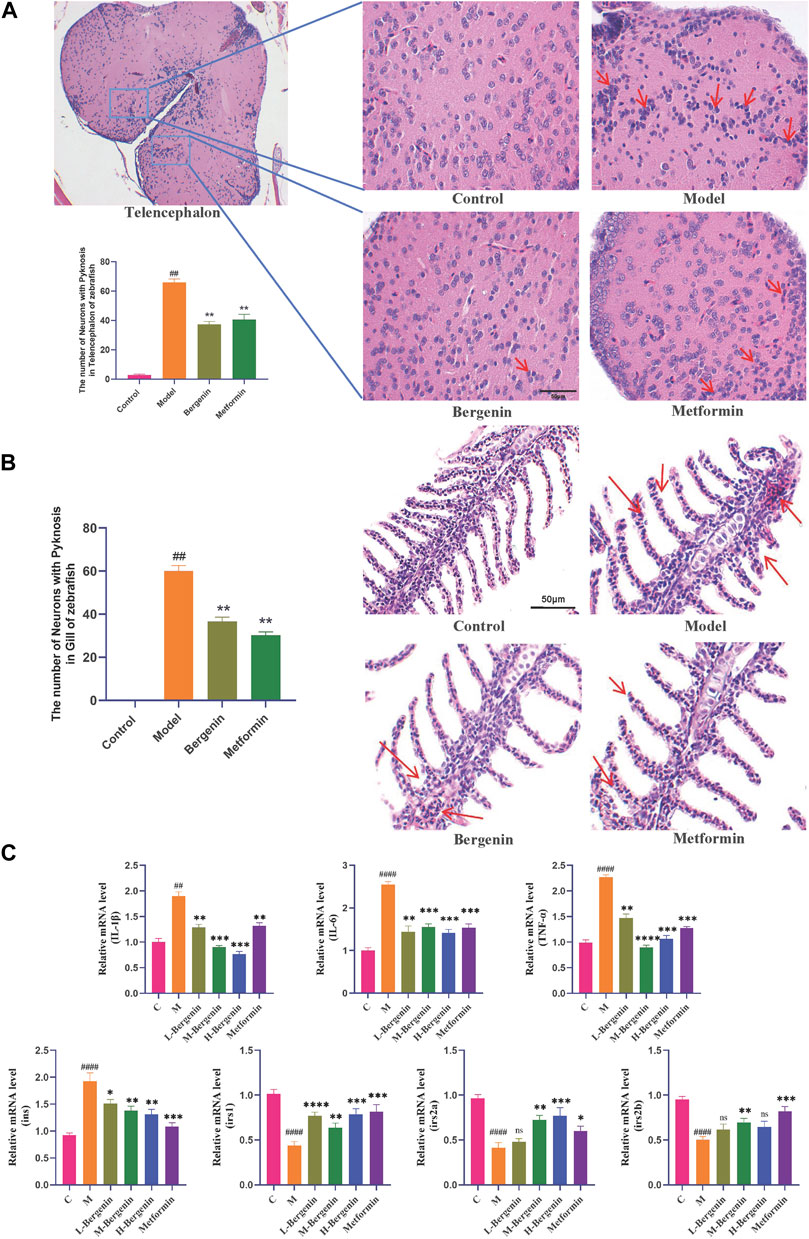
Figure 3. Effects of Bergenin on Inflammation and Insulin Resistance in High-Glucose-Induced Zebrafish Adults. (A) Pathological Changes in the Telencephalon Region of High-Glucose-Induced Zebrafish Adults: The arrow indicates activated and aggregated microglial cells (HE staining); (B) Pathological Changes in Gill Tissues: The arrow indicates inflammation response in the gill, characterized by capillary disorder, dilation, and congestion (HE staining); (C) The Effect of Bergenin on Inflammatory Factors and Insulin Resistance in High Glucose-Induced Zebrafish: Relative mRNA level of il1b, il6, tnfa, ins, irs1, irs2a, and irs2b. “ns” indicates no statistical significance; ##P < 0.01, ####P < 0.0001 indicates significance compared to the control group; *P < 0.05, **P < 0.01, ***P < 0.001, ****P < 0.0001 indicates significance compared to the model group. (One-way ANOVA, Mean ± SD, N = 15).
The impact of bergenin on the expression of inflammatory factors in the brains of high glucose-induced zebrafish was investigated using RT-qPCR. As shown in Figure 3C, compared to the control group, the mRNA levels of inflammatory factors il1b (P < 0.01), il6 (P < 0.01), and tnfa (P < 0.01) were significantly increased in the model group. However, the mRNA expression levels of il1b (P < 0.01), il6 (P < 0.01), and tnfa (P < 0.01) were significantly decreased in the bergenin and metformin groups compared to the model group, indicating an amelioration in brain inflammation levels.
We investigated bergenin’s impact on the expression of insulin resistance-related genes in the brains of zebrafish induced with high glucose using RT-qPCR. As shown in Figure 3C, compared to the control group, the insulin gene (ins) expression was upregulated in the model group, while the expression of insulin receptor substrate genes (irs1, irs2a, and irs2b) decreased significantly (P < 0.01). However, in both the bergenin and metformin groups (P < 0.01), ins expression decreased while irs1, irs2a, and irs2b expression increased, indicating bergenin’s effectiveness in alleviating insulin resistance.
3.1.4 The effect of bergenin on glucose, Lactic Acid, and Glycolytic Key Enzymes in High Glucose-Induced zebrafishAs depicted in Figures 4A–E, zebrafish induced with high glucose exhibited elevated brain glucose levels (P < 0.05), increased lactate production (P < 0.01), and enhanced activity of glycolytic key enzymes HK and PFK (P < 0.05). Subsequent administration of bergenin and metformin resulted in a decrease in brain glucose levels (P < 0.05), lactate production (P < 0.05), and activity of glycolytic enzymes HK and PFK (P < 0.01). These findings indicate disrupted brain glucose metabolism and enhanced glycolysis in zebrafish induced with high glucose. Bergenin and metformin demonstrate the ability to reduce brain glycolysis levels, thereby improving brain glucose metabolism.
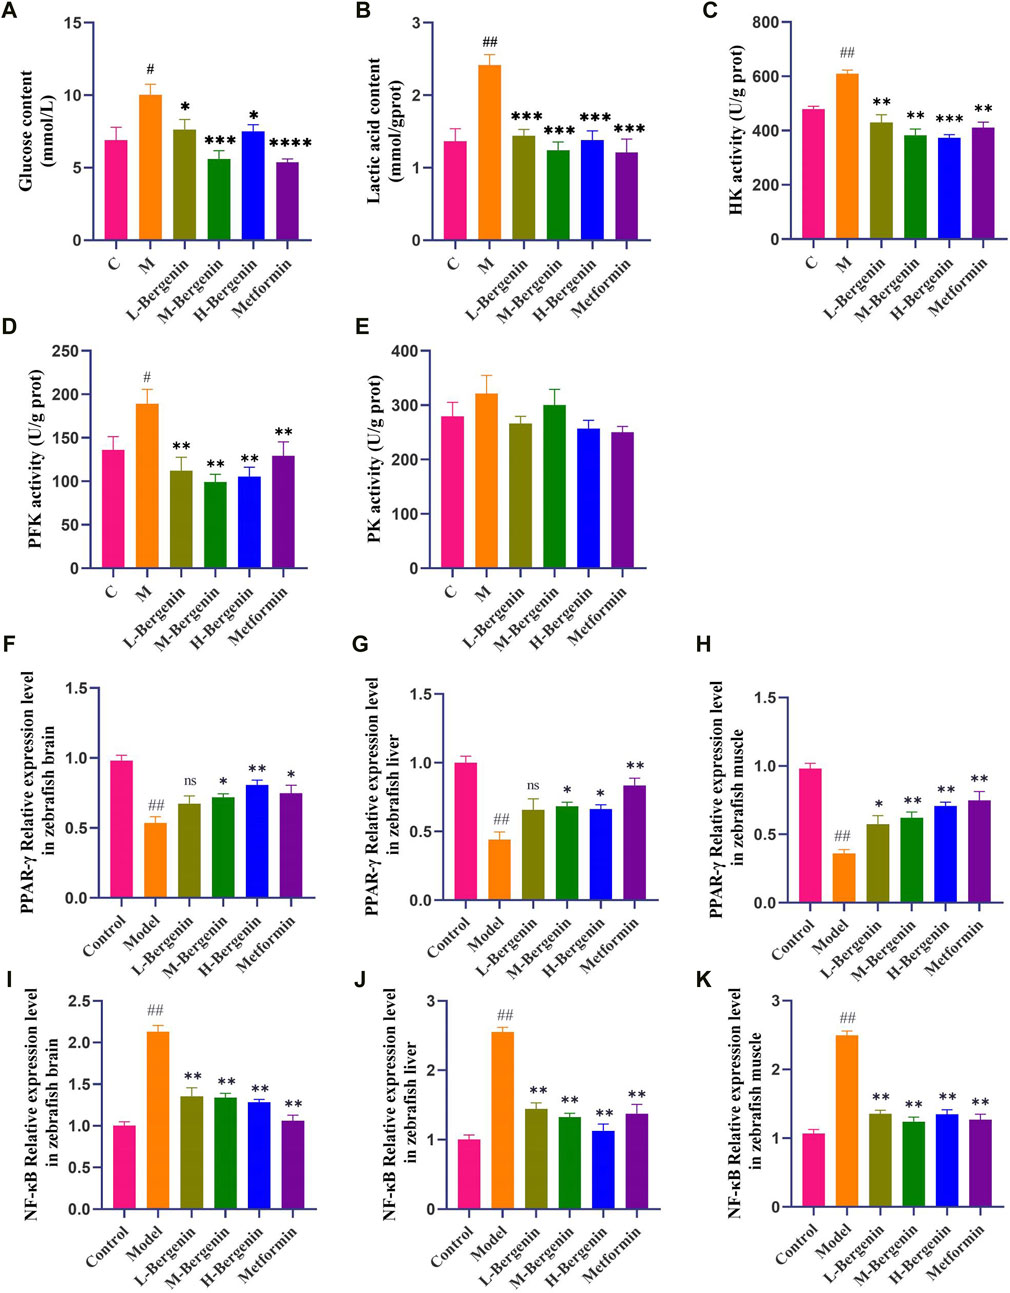
Figure 4. Effects of Bergenin on Glycolysis and PPAR-γ/NF-κB pathway in High-Glucose-Induced Zebrafish Adults. (A–E): The Effect of Bergenin on Glucose, Lactic Acid, and Glycolytic Key Enzymes in High Glucose-Induced Zebrafish: (A) Glucose content; (B) Lactic acid content; (C) HK activity; (D) PFK activity; (E) PK activity; (F–K): The Effect of Bergenin on PPAR-γ/NF-κB pathway mRNA in High Glucose-Induced Zebrafish: (F–H) Relative mRNA levels of pparg in the brain, liver, and muscle of zebrafish; (I–K) Relative mRNA level of rela in the brain, liver and muscle of zebrafish. “ns” indicates no statistical significance; #P < 0.05, ##P < 0.01 indicates significance compared to the control group; *P < 0.05, **P < 0.01, ***P < 0.001, ****P < 0.0001 indicates significance compared to the model group. (One-way ANOVA, Mean ± SD, N = 15).
3.1.5 The effect of bergenin on PPAR-γ/NF-κB pathway mRNA in high glucose-induced zebrafishTissue samples from the brains, livers, and muscles of zebrafish were collected to investigate the impact of bergenin on PPAR-γ/NF-κB pathway-related gene expression induced by high glucose, using RT-qPCR. As depicted in Figures 4F–K, compared to the control group, PPAR-γ expression decreased while NF-κB expression increased in the brains, livers, and muscles of zebrafish in the model group (P < 0.01). Conversely, in the bergenin group (P < 0.05) and the metformin group (P < 0.05), PPAR-γ expression increased while NF-κB expression decreased, suggesting that high glucose induction and bergenin treatment affect multiple tissues in zebrafish. Furthermore, bergenin exerts its neuroprotective effects by activating PPAR-γ and inhibiting NF-κB.
3.2 The effect of bergenin on high glucose-induced BV2 cells3.2.1 The effect of bergenin on inflammatory factors in high glucose-induced BV2 cellsUnder bright-field microscopy, changes in cell morphology were observed: BV2 cells in the control group exhibited a regular distribution, without cell aggregation, mostly in a quiescent state, appearing round or spindle-shaped. In comparison, the model group showed a significant increase in amoeboid-like cell clusters. After treatment with Bergenin, 2DG, and DADA on modeled BV2 cells, all three groups exhibited reduced numbers of amoeboid-like cells and fewer clusters compared to the model group. The impact of bergenin on the expression of inflammatory factors in BV2 cell models was studied using RT-qPCR. As shown in Figure 5A, compared to the control group, the model group exhibited increased mRNA expression of inflammatory factors IL-1β (P < 0.05), IL-6 (P < 0.01), and TNF-α (P < 0.01). Following intervention with bergenin, 2DG, and DADA, the mRNA expression of IL-1β (P < 0.05), IL-6 (P < 0.01), and TNF-α (P < 0.01) decreased. This indicates that bergenin, 2DG, and DADA can exert a certain inhibitory effect on inflammation induced in BV2 cells by high glucose through the regulation of the glycolytic pathway.
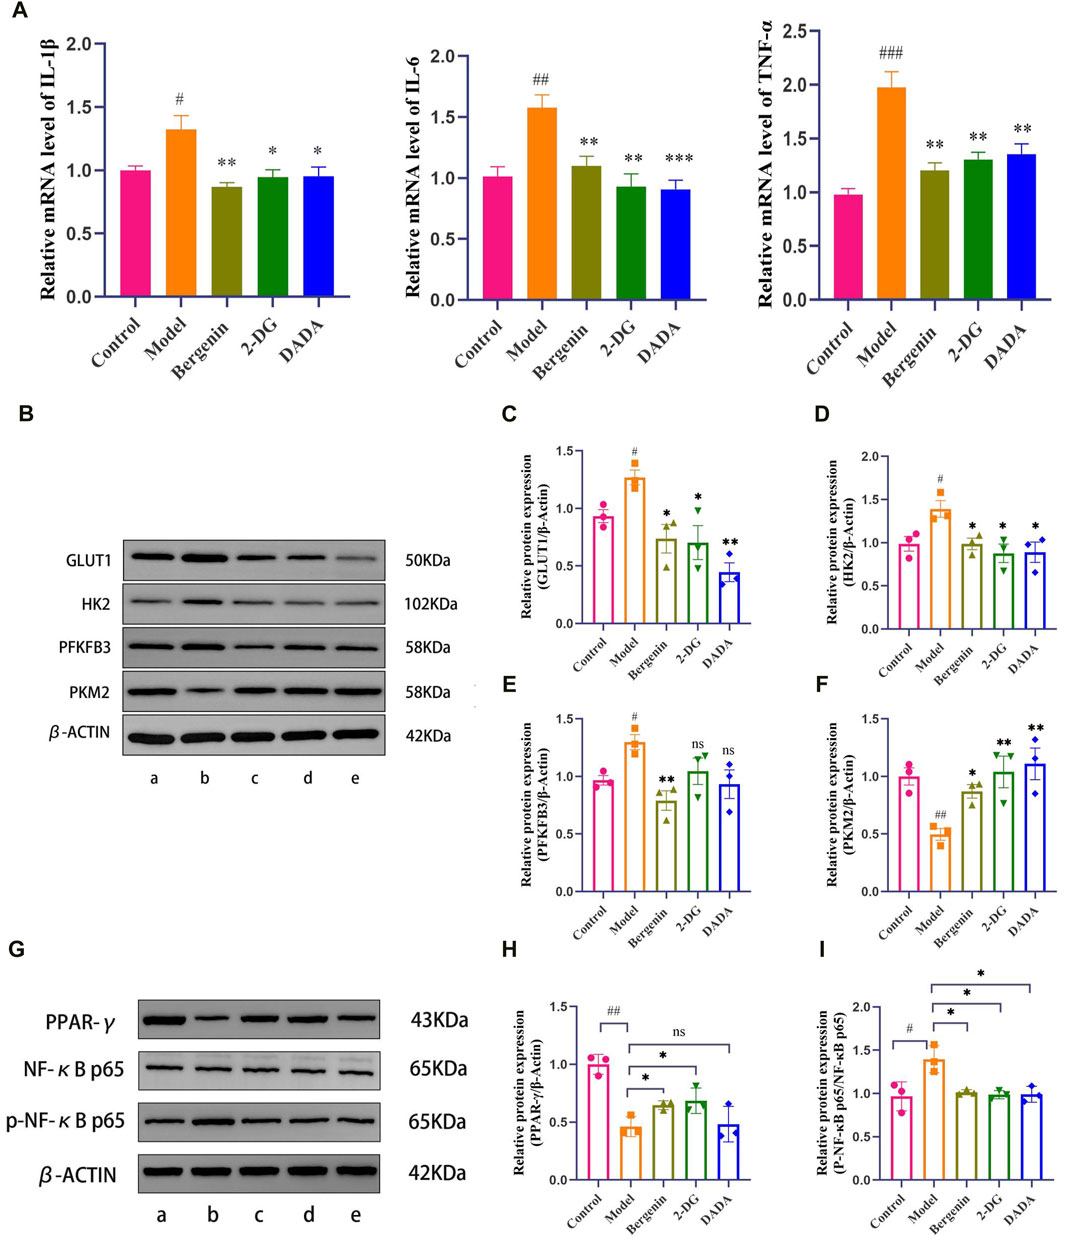
Figure 5. Effects of Bergenin in High Glucose-Induced BV2 Cells. (A) The Effect of Bergenin on Inflammatory Factors in High Glucose-Induced BV2 Cells: Relative mRNA level of IL-1β, IL-6, TNF-α; B–F: The Effect of Bergenin on Glycolytic Key Enzymes in High Glucose-Induced BV2 Cells: The Western blot images of glycolysis-related enzymes (B). Data are represented as GLUT1/β-actin (C), HK2/β-actin (D), PFKFB3/β-actin (E) and PKM2/β-actin (F). (G–I): The Effect of Bergenin on the PPAR-γ/NF-κB Pathway in High Glucose-Induced BV2 Cells: The Western blot images of PPAR-γ/NF-κB Pathway (G). Data are represented as PPAR-γ/β-actin (H) and p-p65/p65 (I). “ns” indicates no statistical significance; #P < 0.05, ##P < 0.01, ###P < 0.001 indicates significance compared to the control group; *P < 0.05, **P < 0.01, ***P < 0.001 indicates significance compared to the model group. (One-way ANOVA, Mean ± SD, N = 3).
3.2.2 The effect of bergenin on glycolytic key enzymes in high glucose-induced BV2 cellsHigh glucose induces metabolic reprogramming, shifting the primary mode of intracellular glucose metabolism from oxidative phosphorylation to aerobic glycolysis. The expression of key enzyme proteins Glucose Transporter Type 1 (GLUT1), HK2, 6-Phosphofructo-2-Kinase/Fructose-2,6-Biphosphatase 3 (PFKFB3), and PKM2 (Pyruvate Kinase M2) during glycolysis was further assessed using Western Blot analysis. As depicted in Figures 5B–F, compared to the control group, the model group showed significantly increased expression of GLUT1, HK2, and PFKFB3 (P < 0.05). However, following intervention with bergenin, 2DG, and DADA, the protein expression of GLUT1, HK2, and PFKFB3 in BV2 cells significantly decreased (P < 0.05) compared to the model group, indicating that bergenin can exert a glycolysis inhibitory effect similar to that of 2DG, regulating metabolic reprogramming. Additionally, compared to the control group, the expression of PKM2 decreased in the model group. However, following intervention with bergenin, 2DG, and DADA, the expression of PKM2 increased, although the underlying mechanism requires further elucidation.
3.2.3 Bergenin activates PPAR-γ and reduces NF-κB p65 phosphorylation in high glucose-treated BV2 cellsTo investigate the protective mechanism of bergenin against high glucose-induced neurotoxicity, we measured the protein levels of PPAR-γ. The results showed a significant decrease in PPAR-γ expression induced by high glucose (Figures 5G,H). This decrease was reversed by bergenin (P< 0.05). Concurrently, we assessed the phosphorylation of NF-κB protein, closely associated with cellular inflammatory response. The results indicated a significant increase in p-p65 levels induced by high glucose, which was markedly inhibited by bergenin treatment (P < 0.05) (Figures 5G,I). Therefore, we propose that bergenin’s improvement of high glucose-induced glycolysis and increased inflammation is associated with the activation of PPAR-γ and deactivation of its downstream NF-κB pathway.
3.3 The effect of bergenin on STZ-Induced rat models3.3.1 The effect of bergenin on the learning and memory abilities in STZ-induced rat modelsCompared to the control group, the model group exhibited a decline in learning and memory abilities, with a significantly prolonged time to find the platform (P < 0.01). When compared to the model group, the Bergenin low-dose (P < 0.05), high-dose (P < 0.01), and Metformin (P < 0.01) groups showed a reduction in the time to find the platform. After removing the platform, compared to the control group, the model group significantly reduced the time spent in the target platform quadrant (P < 0.01) and the number of crossings through the platform (P < 0.01). In comparison to the model group, the Bergenin groups exhibited a significant increase in the time spent in the target platform quadrant and an increase in the number of crossings. Bergenin improved the learning and memory abilities in STZ-Induced Rat Model (Figures 6A,B).
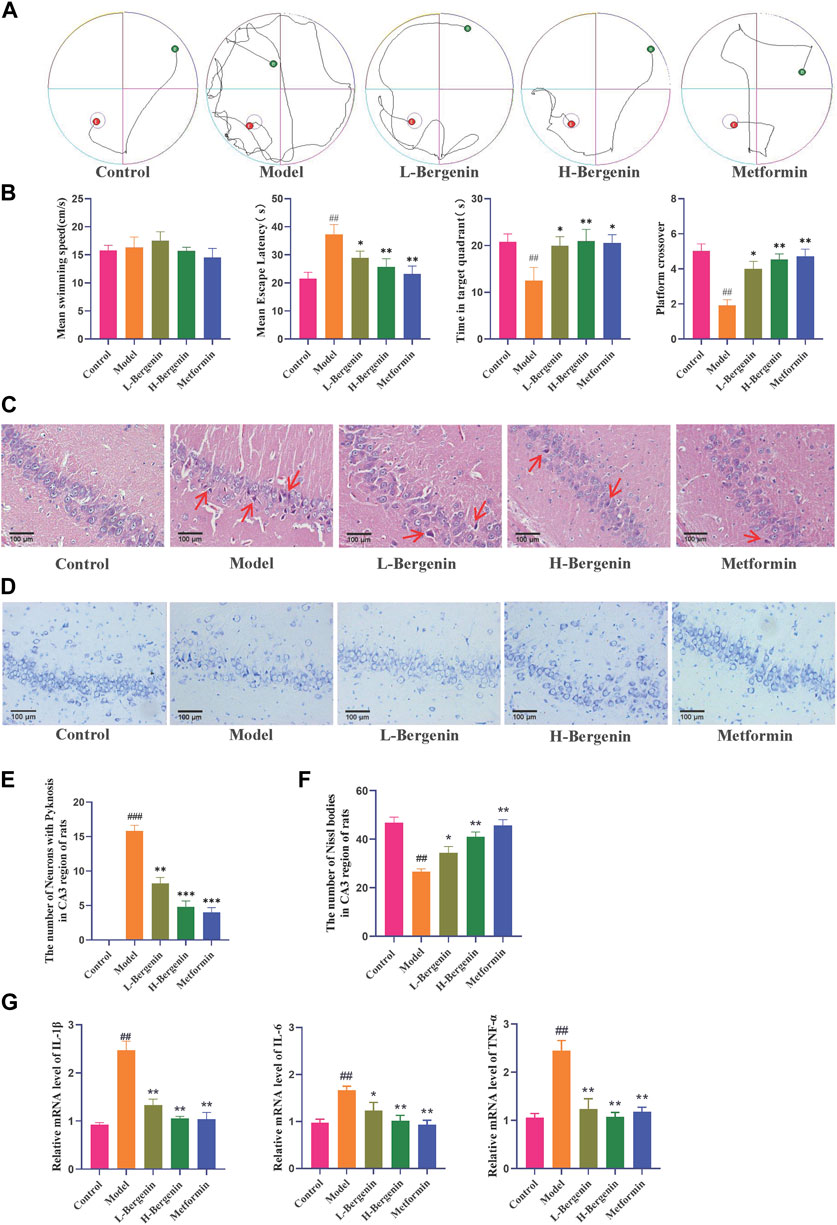
Figure 6. Effects of Bergenin in STZ-Induced Intracerebral Injection Rat Model. (A) The Morris Water Maze Trajectory Map evaluated the neurological functions, as well as the learning and memory abilities of rats. (B) Statistical data from the Morris Water Maze included the mean swimming speed, latency time to discover the platform, residence time in the quadrant, and frequency of crossing the target platform. (C–F): Effects of Bergenin on the Morphology of Hippocampal Neurons in the STZ-induced Intracerebral Injection Rat Model Detected by HE Staining (C, E) and Nissl Staining (D, F), The arrows respectively indicate pyknosis (C); (G) The Effect of Bergenin on Inflammatory Factors in STZ-Induced Intracerebral Injection Rat Model: Relative mRNA level of IL-1β, IL-6, TNF-α. #P < 0.05, ##P < 0.01 indicates significance compared to the control group; *P< 0.05, **P< 0.01 indicates significance compared to the model group. (One-way ANOVA, Mean ± SD, N = 3).
HE results showed (Figures 6C,E) that the number of neurons in the CA2 and CA3 regions of rats in the model group decreased, with disordered cell arrangement, nuclear condensation, darkening color, and neuronal damage (P < 0.01). Bergenin and Metformin groups showed improved neuronal damage, with normal cell morphology and orderly arrangement. In the low-dose group, there were fewer cells wi
留言 (0)