
記住我
• Biomarker is mostly present in the pre-fermentation phase, but the mid-fermentation phase is the most important part of the process.
• Staphylococcus is the most important bacterial genus, and Stenotrophomonas, although less abundant, still plays an important role.
• Sphingolipid metabolites are active during fermentation and may have an important effect on fermentation quality.
1 IntroductionFermentation, a venerable food preservation and processing technique, holds a pivotal position in the manufacture of diverse bean, meat, and plant-based products (Leeuwendaal et al., 2022). As demonstrated in numerous studies (Chupeerach et al., 2021; Liu et al., 2022; Leroy et al., 2023), fermentation not only enhances the unique and diverse flavor profiles of these products but also elevates their overall quality (Wen et al., 2023). Fundamentally, fermentation entails the intricate biochemical transformation of substrates, driven by microbial metabolic activities and enzymatic reactions. These reactions facilitate the breakdown of macromolecules, such as starch, proteins, and lipids, into smaller organic molecules, including reducing sugars, aldehydes, and ketones, which ultimately contribute to the complex aroma, taste, and flavor profiles of the final product (van Wyk, 2024).
In the context of fermented sauerkraut, fatty acids undergo enzymatic degradation, yielding a plethora of volatile aldehydes that significantly contribute to the food’s refreshing aroma (Li et al., 2022). During the terminal stages of black tea fermentation, enzymatic reactions facilitate the formation of an array of ketones, which impart the tea’s characteristic floral and woody aroma (Hu et al., 2022). In the brewing process of yellow wine, lactic acid bacteria modulate the ethyl lactate content through intricate enzymatic reactions, resulting in the production of compounds such as isoamyl butyrate, ethyl caprate, ethyl butyrate, and ethyl phenylethylacetate, which enrich the mellowness of the wine’s flavor and significantly enhance its overall quality (Guo et al., 2024). Terpenoids play a pivotal role in shaping the aroma of tobacco, with neophytadiene serving as a defining characteristic of tobacco flavor (Zhang et al., 2023). In cigars, esters, ketones (e.g., lycopene), and aldehydes (2,4-dimethylbenzaldehyde) contribute uniquely to their flavor profiles (Gaspar et al., 2019; Zheng et al., 2022). However, excessive starch content can lead to a burnt odor during cigar combustion, while high nicotine levels may impart an irritating and harsh smoke (Zhao et al., 2009, 2012). To ensure the consistent maintenance of fermentation product quality, a comprehensive understanding of the metabolites during the fermentation process is imperative. While current research has primarily focused on the impact of chemical composition on plant leaf fermentation product quality, there is a need for more in-depth studies exploring the diverse range of metabolites that emerge during fermentation.
As a distinct tobacco product, the quality of cigars is profoundly shaped by the fermentation process, a complex biotransformation reliant on the synergistic activities of a diverse array of microorganisms (Jia et al., 2023). The fermentation of cigar tobacco leaves (CTLs) is primarily governed by interleaf microbiota, though their community structure exhibits significant variations influenced by geographical, climatic, and varietal factors (Ren et al., 2023), thereby contributing to diverse cigar flavor profiles and quality attributes. Staphylococcus is integral to carbohydrate catabolism, amino acid transformation, protein hydrolysis, and lipolysis, mediating the degradation of branched-chain amino acids into methyl-branched-chain alcohols, aldehydes, carboxylic acids, and their corresponding esters (Zhao et al., 2009). Pseudomonas facilitate the enzymatic breakdown of proteins, enriching the amino acid pool, which significantly contributes to flavor development (Dzialo et al., 2017; Murata, 2021). Furthermore, they degrade cellular components such as cellulose, pectin, starch, and lignin in tobacco leaves, releasing flavor-active small molecules including esters, alcohols, and aldehydes (Banožić et al., 2020; Liu et al., 2021; Wang et al., 2022). Bacillus play a pivotal role in degrading macromolecules like carotenoids, yielding significant small-molecule aromatic compounds such as megacolumnar trienones, isophorones, and 2,6,6-trimethyl-2-cyclohexene-1,4-diones (Dai et al., 2020). These bacteria also secrete enzymes that degrade starch, proteins, and cellulose in tobacco, further contributing to the complex flavor profile (Pen et al., 1992; Li et al., 2006; Singh et al., 2017). The fungal community within cigar leaves exhibits a relatively simpler structure compared to bacteria, with Aspergillus often emerging as the dominant species. However, Alternaria and Wallemia are also prevalent and play equally crucial roles in the fermentation process. Aspergillus species exhibit robust activity in the transformation of saccharide compounds (Jia et al., 2023), demonstrating a strong capability to decompose starch and organic nitrogen under conditions of sufficient oxygen and optimal humidity (Yang et al., 2022).
Multiomics analysis has gained widespread application in the realm of fermented plant products, encompassing olives, tea, and vegetables (Rizo et al., 2020; Vaccalluzzo et al., 2020; Hu et al., 2022). It holds a pivotal role in investigating fermentation processes and mechanisms underlying flavor development. Recently, in examining the interplay between CTLs fermentation and the composition of interfollicular microbial communities (Wu et al., 2021; Zheng et al., 2022). However, our comprehension of the structural dynamics of the foliar microbiome and the specific mechanisms driving aroma formation during fermentation remains elusive. This work employed high-throughput sequencing technology, coupled with a comprehensive analysis of microbiomics and metabolomics, to identify functional microorganisms and crucial metabolites involved in the fermentation process. Furthermore, we delved into the correlation between microbial communities and metabolite alterations, providing both theoretical and technical foundations for optimizing plant leaf fermentation-related production processes.
2 Materials and methods 2.1 Source of cigar tobacco headingsTwo premium cigar varieties were selected from Xishuangbanna, Yunnan Province, China: YX1 (packed) and YX6 (filled). Unfermented cigar samples were collected at the end of the drying treatment (0d), while five nodes were selected throughout the stacking and fermentation process, each of which was turned over after the temperature and humidity reached the preset conditions (7d, 14d, 22d, 56d, and 65d), labeled W0, W7, W14, W22, W56, and W65, respectively; and F0, F7, F14, F22, and F56 each time. At each turning of the pile, 3 pieces of cigar leaves were taken out from the upper, middle and lower layers, from which 6 pieces of cigar leaves with the same appearance and quality were selected, and about 10 grams of the same portion of the leaves were cut off with sterilized scissors, put into centrifugal tubes, labeled, and stored in a refrigerator at −80°C. The leaves were then stored at −80°C for a short time.
2.2 DNA extraction and Illumina MiSeq sequencingThree replicate samples of 5 g each were taken from each group, and the extract was obtained by adding 250 mL 1% PBS buffer. Microbes on fermented leaves were collected by shaking the flasks and centrifuging the eluent. The total genomic DNA of the microbial community was extracted according to the instructions of the E.Z.N.A.® soil DNA kit (Omega Bio-tek, Norcross, GA, United States), and the quality of the extracted genomic DNA was checked by agarose gel electrophoresis with 1% agarose, and the concentration and purity of the DNA were determined by NanoDrop2000 (Thermo Scientific, United States). The extracted DNA was used as a template, and upstream primer 338F (5’-ACTCCTACGGGGAGGCAGCAG-3′) and downstream primer 806R (5’-GGACTACHVGGGGGGG), which carried the Barcode sequence, were used as templates. (GGACTACHVGGGTWTCTAAT-3′) were used to amplify the V3–V4 variable region of the 16S rRNA gene by PCR, and the PCR products were recovered on a 2% agarose gel, and purified using the PCR Clean-Up Kit (PCR Clean-Up Kit, China). The recovered products were purified using the DNA Gel Purification Kit (PCR Clean-Up Kit, Qubit 4.0, Thermo Fisher Scientific, United States) and quantified using Qubit 4.0. The purified PCR products were library-constructed using NEXTFLEX Rapid DNA-Seq Kit and sequenced using Illumina PE300/PE250 platform.
2.3 Chemical composition determinationEach group of three replicate samples was dried in an electric blast dryer at 40°C until the leaves were shaken with a breaking sound, easily broken by hand squeezing and ground for 100 s, passed through a 60-mesh sieve, added 5% acetic acid and sealed with a sealing film, extracted by shaking for 30 min on an oscillator and filtered through a qualitative filter paper to collect the remaining filtrate in addition to the first 5 mL, and determined the chlorine ion content of the tobacco by using a continuous flow analyzer (AA3 Germany) in accordance with the national standard (YC/ T162-2011). The total sugar, starch, nicotine, chloride and potassium contents of CTLs were determined by continuous flow analysis (AA3, Germany) according to the national standard (YC/T162-2011).
2.4 Metabolom analysisThe LC–MS/MS analysis of sample was conducted on a Thermo UHPLC-Q Exactive HF-X system equipped with an ACQUITY HSS T3 column (100 mm × 2.1 mm i.d., 1.8 μm; Waters, United States) at Majorbio Bio-Pharm Technology Co., Ltd. (Shanghai, China). The mobile phases consisted of 0.1% formic acid in water: acetonitrile (95:5, v/v) (solvent A) and 0.1% formic acid in acetonitrile: isopropanol: water (47.5:47.5, v/v) (solvent B). MS conditions: The flow rate was 0.40 mL/min and the column temperature was 40°C. The injection volume was 3 μL. The mass spectrometric data were collected using a Thermo UHPLC-Q Exactive HF-X Mass Spectrometer equipped with an electrospray ionization (ESI) source operating in positive mode and negative mode. The optimal conditions were set as followed: Aux gas heating temperature at 425°C; Capillary temp at 325°C; sheath gas flow rate at 50 psi; Aux gas flow rate at 13 psi; ion-spray voltage floating (ISVF) at −3,500 V in negative mode and 3,500 V in positive mode, respectively; Normalized collision energy, 20–40–60 eV rolling for MS/MS. Full MS resolution was 60,000, and MS/MS resolution was 7,500. Data acquisition was performed with the Data Dependent Acquisition (DDA) mode. The detection was carried out over a mass range of 70–1,050 m/z.
2.5 Statistical analysisAlpha diversity knowledge Chao 1, Shannon index, etc. were calculated using mothur software, and the Wilxocon rank sum test was used for the analysis of intergroup differences in Alpha diversity; the differences in microbial community structure between the sample groups were analyzed using the bray-curtis-based distance algorithm based PCoA analysis (principal coordinate analysis) to test the similarity of microbial community structure between samples, and combined with the PERMANOVA nonparametric test to analyze whether the differences in microbial community structure between sample groups were significant or not; with LEfSe analysis (Linear discriminant analysis Effect Size) (Segata et al., 2011) (LDA > 2, p < 0.05) to identify bacterial taxa with significant differences in abundance from phylum to genus level among different groups. Distance-based redundancy analysis (db-RDA) was used to investigate the effects of physicochemical indicators on microbial community structure. Linear regression analysis was used to assess the effect of the main soil physicochemical/clinical indicators identified in the db-RDA analysis on the microbial Alpha diversity index. Species were selected for correlation network graph analysis based on spearman correlation |r| > 0.6 p < 0.05 (Barberán et al., 2012).
The UHPLC–MS raw data were converted into the common format by Progenesis QI software (Waters, Milford, United States) through baseline filtering, peak identification, peak integral, retention time correction, and peak alignment. Then, the data matrix containing sample names, m/z, retention time and peak intensities was exported for further analyses. At the same time, the metabolites were identified by searching database, and the main databases were the HMDB, Metlin and the self-compiled Majorbio Database (MJDB) of Majorbio Biotechnology Co., Ltd. (Shanghai, China). The data matrix obtained by searching database was uploaded to the Majorbio cloud platform for data analysis. Firstly, the data matrix was pre-processed, as follows: At least 80% of the metabolic features detected in any set of samples were retained. After filtering, the minimum value in the data matrix was selected to fill the missing value and each metabolic signature was normalized to the sum. To reduce the errors caused by sample preparation and instrument instability, the response intensities of the sample mass spectrometry peaks were normalized using the sum normalization method, to obtain the normalized data matrix. Meanwhile, the variables of QC samples with relative standard deviation (RSD) > 30% were excluded and log10 logarithmicized, to obtain the final data matrix for subsequent analysis.
3 Results 3.1 Analysis of microbial community1,053 bacterial OTUs and 1,420 fungal OTUs were obtained from all CTLs, and plot the dilution curve of the sample by the sobs value of the respective microbial communities. The adequacy of the sequencing data was determined by observing whether the curve reached a plateau. As the amount of sequencing increased, the sobs index, representing the number of observed OTUs, ceased to rise and gradually flattened out, indicating that the sequencing depth was sufficient to capture most of the microbial diversity in the samples. The dilution curves gradually approached a plateau with increasing sample volume, revealing more intricate dynamics in fungal diversity compared to bacteria.
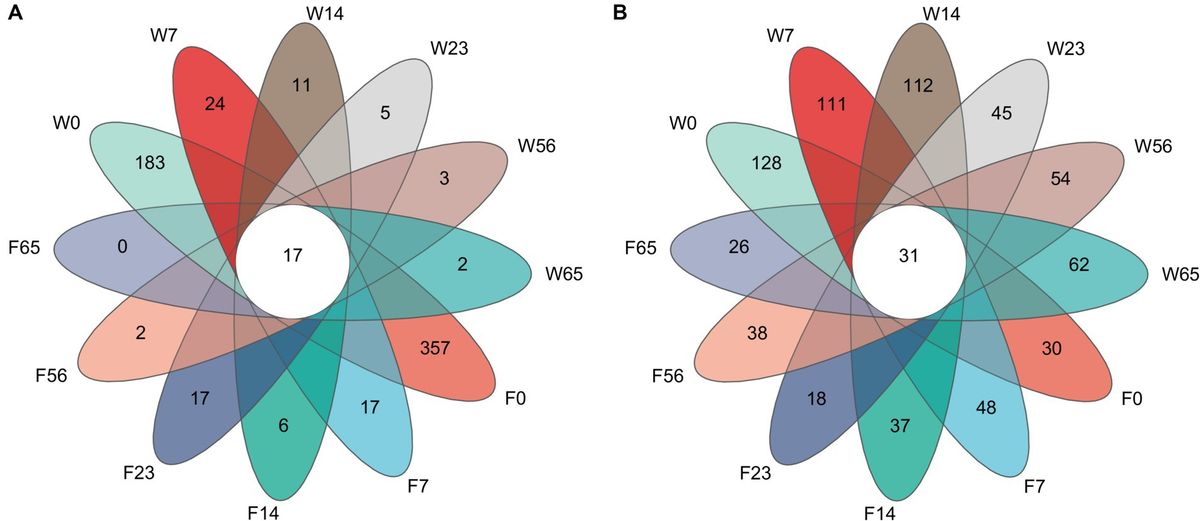
A comparative analysis of the 1,053 bacterial OTU representatives (Figure 1) revealed 17 shared OTUs among the samples. Among them, F0 had the highest number of unique OTUs (357), followed by W0 (183). The number of unique OTUs exhibited a sharp decline at 7 days and then a gradual decrease until the end of fermentation (65 days), where F65 no longer possessed any unique OTUs, while W65 still maintained 2 unique OTUs. In contrast, the comparative analysis of the 1,420 fungal OTU representatives yielded 31 shared OTUs, with W0 having the highest number of unique OTUs (128), followed by W14 (112). The number of unique OTUs in the Wapper showed a decreasing and then an increasing trend, and at the critical point of 23d, the number of unique OTUs in the fungal community showed a cliff-like decline similar to that in the bacterial community (Lee et al., 2015) and a slow upward trend in subsequent fermentations. In the Filler, the number of unique OTUs showed fluctuating changes and remained in a relatively stable state throughout the fermentation process, with little difference between pre-fermentation (F0:30) and post-fermentation (F65:26).
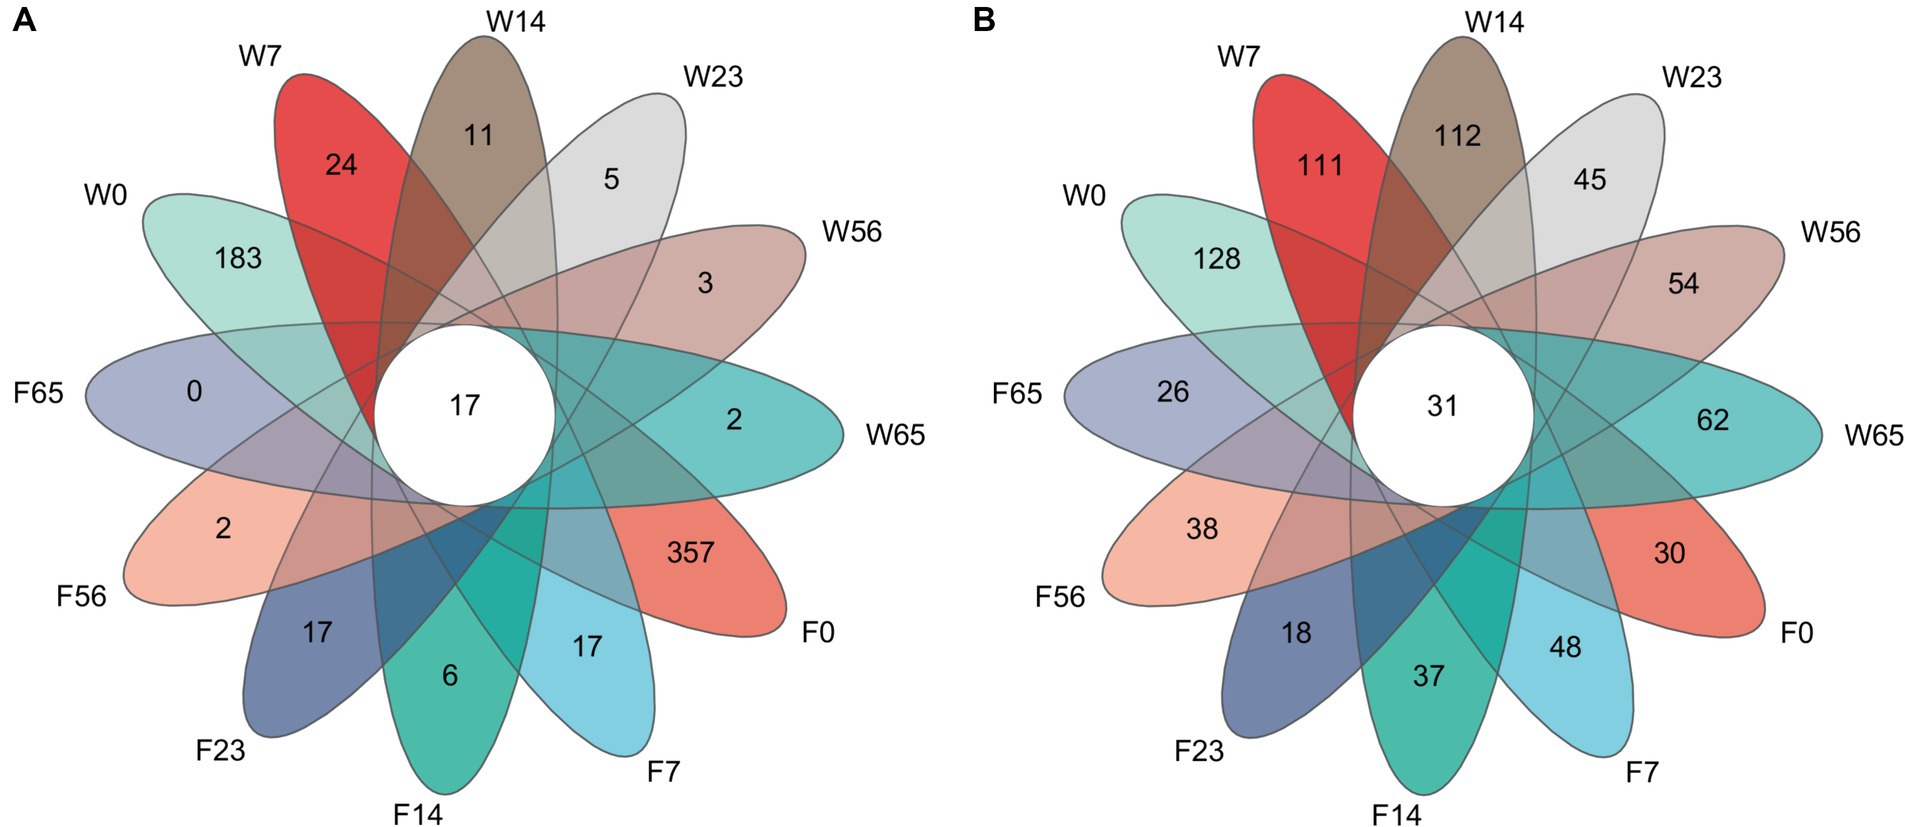
Figure 1. Unique and shared OTUs in fermentation processes. (A) bacteria, (B) fungi.
3.2 Diversity and abundanceCommunity richness (ACE and Chao indices) and diversity (Simpson and Shannon indices) were used to reflect the α-diversity of the CTLs microbiota and tested for intergroup differences in indices (Figure 2).
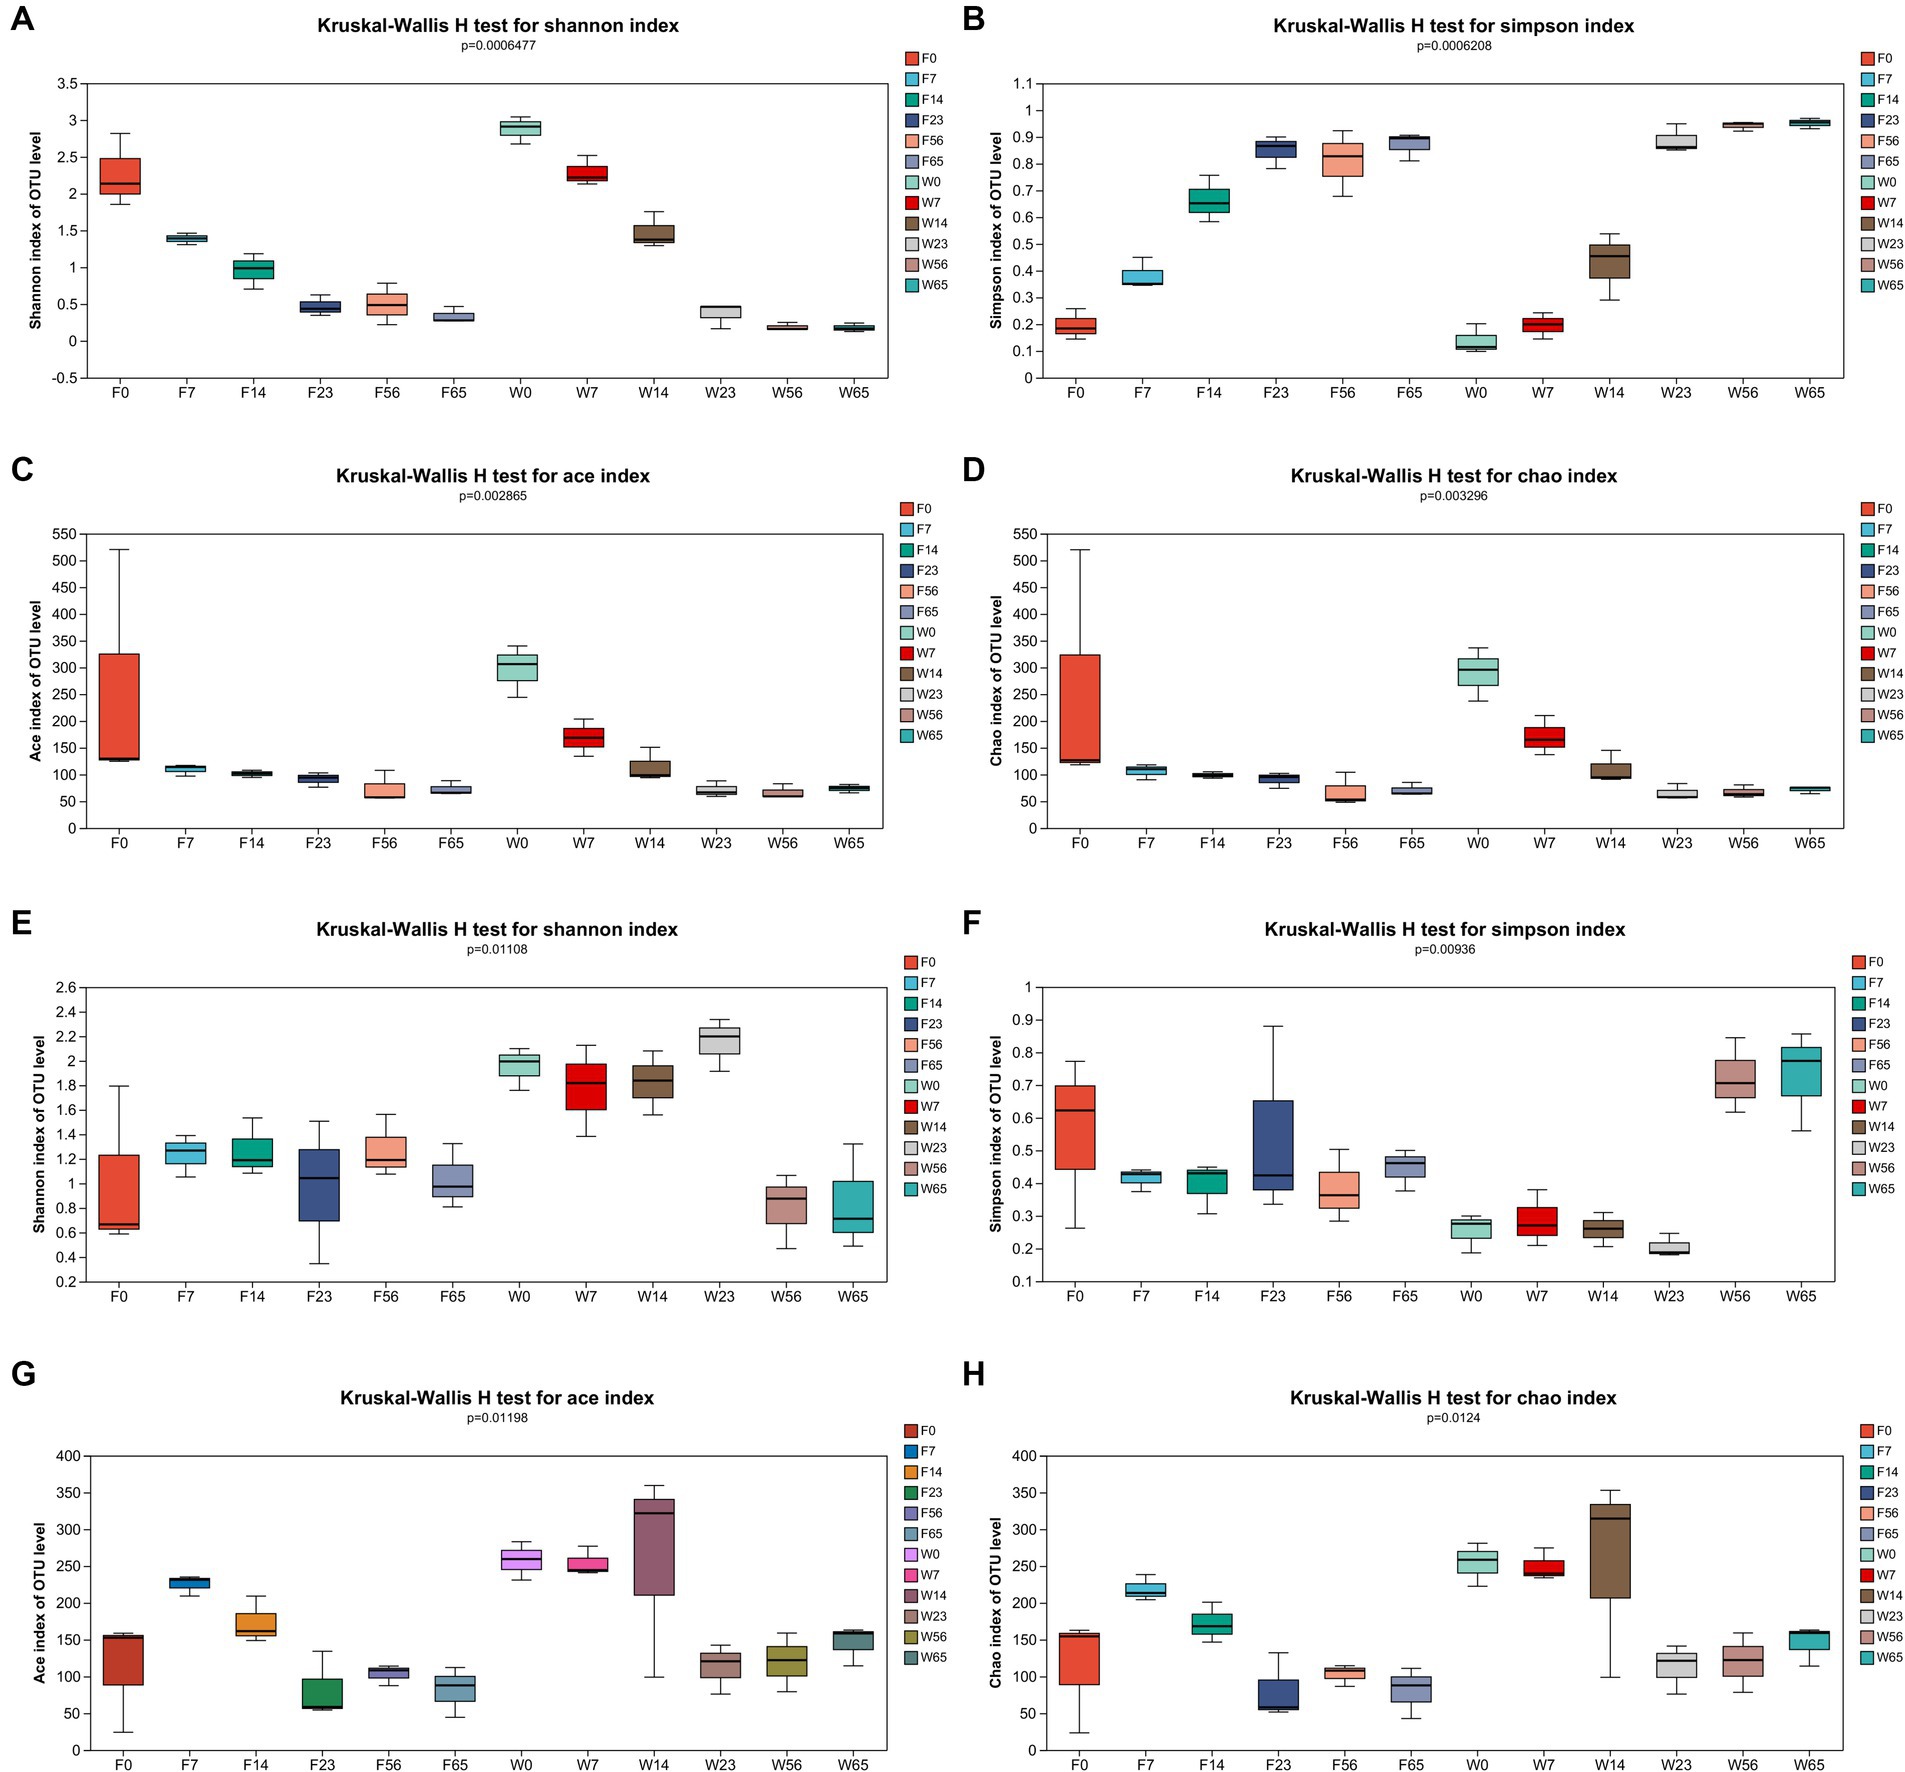
Figure 2. α-diversity of bacterial and fungal OTUs. Bacteria: (A) Shannon’s index, (B) Simpson’s index, (C) Ace’s index, and (D) Chao’s index. Fungi: (E) Shannon’s index, (F) Simpson’s index, (G) Ace’s index, and (H) Chao’s index.
In the context of bacterial communities, as the fermentation process progressed from 0d to 65d, the Shannon index of the CTLs exhibited a pronounced declining pattern, which was corroborated by a significant rise in the Simpson index. Additionally, the ace and chao indices displayed a notable increasing trend throughout the fermentation, indicating a congruence with the microbial community diversity that aligned with the progression of the fermentation process.
Concerning fungal communities, the Shannon index of Filler exhibited a relatively stable fluctuation throughout the fermentation, although a significant decrement was observed at the endpoint compared to the initial 0d. Conversely, Wapper displayed an initial increase, peaking at 23d, followed by a decline, particularly during the late fermentation period (56d, 65d). The Simpson index of Filler showed a marked decrease in the late fermentation (56d, 65d), while Wapper exhibited a significant increase at 23d, contrasting with the Shannon index. This divergence in trends between the Shannon and Simpson indices for the Wapper samples lends credence to the data. The Ace and Chao indices exhibited a trend of initially increasing and subsequently decreasing throughout the entire fermentation.
3.3 Dynamics of microbial communitiesThe alterations in microbiota composition during cigar stack fermentation were examined through 16S and ITS amplicon sequencing. For subsequent analyses, the bacterial and fungal phyla displaying the top 10 relative abundances, as well as the bacterial and fungal genera with the top 20 relative abundances, were selected for in-depth evaluation (Figures 3, 4). Notably, the bacterial phyla Firmicutes (7.81–97.61%), Proteobacteria (1.34–83.80%) and Actinobacteria (0.27–10.91%). exhibited significant variations in abundance during the fermentation process. Specifically, Firmicutes exhibited a lower abundance initially (0d, 7d), gradually increased as fermentation progressed, and ultimately achieved an absolute dominant position towards the end of the fermentation period (56d, 65d). Proteobacteria displayed a high abundance in the Initial-Stages, but its abundance gradually declined as fermentation progressed. Conversely, Actinobacteria accounted for a relatively low percentage throughout the fermentation process, with its abundance exhibiting a trend of initial decrease followed by an increase. At the bacterial phylum level, the abundance of each dominant phylum stabilized towards the Late-Stages of fermentation.
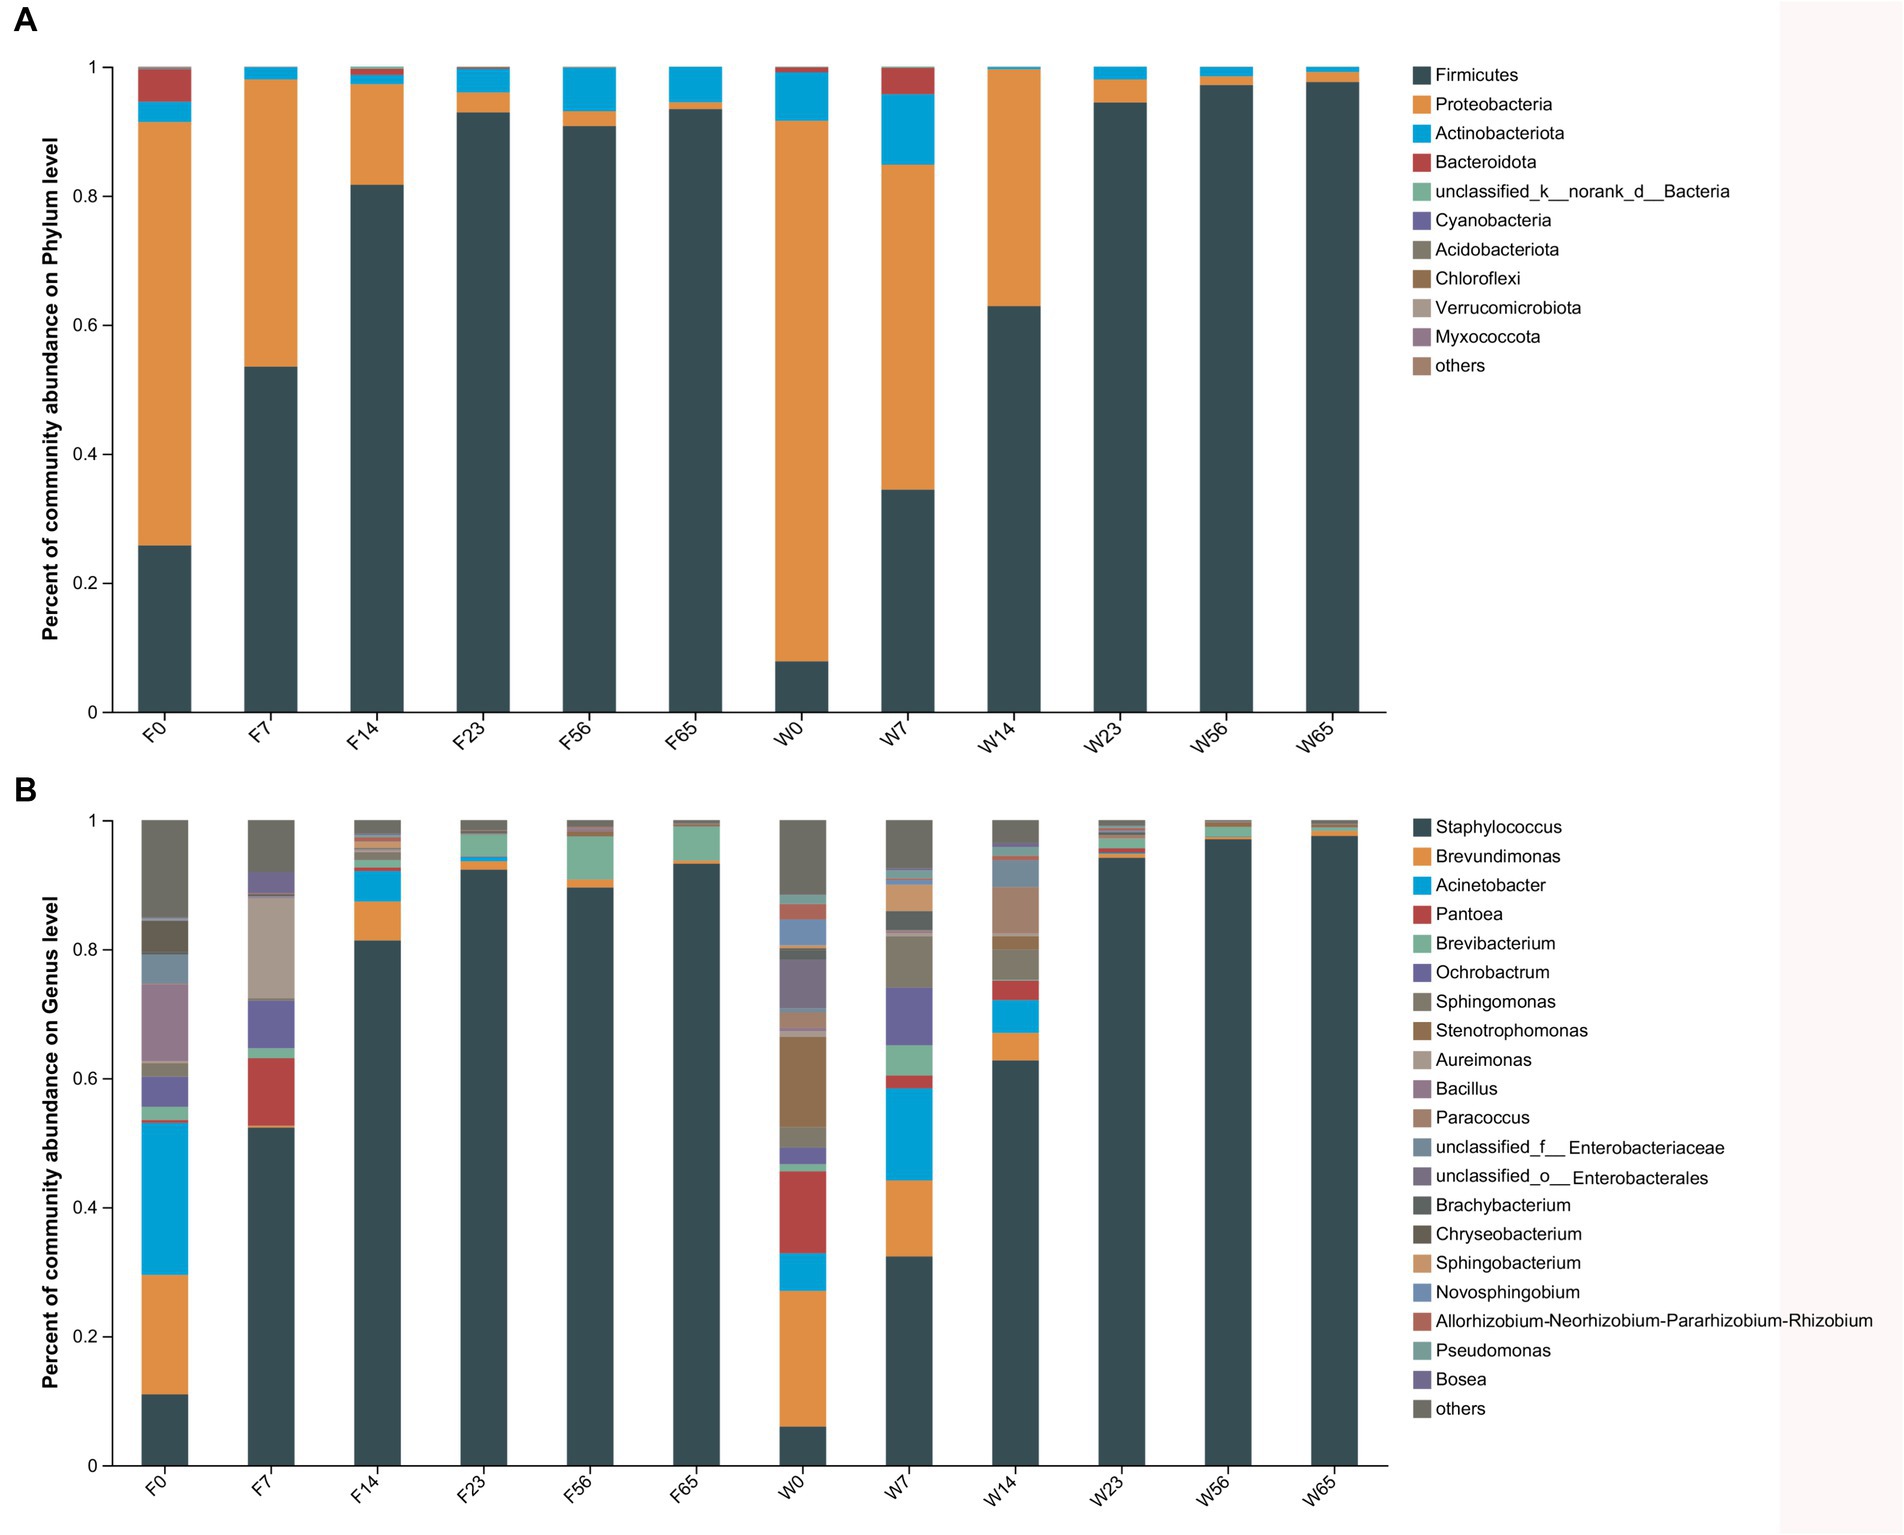
Figure 3. The distribution of the microbial community in CTLs at various stages of fermentation. Bacteria at the phylum level (A) and genus level (B).
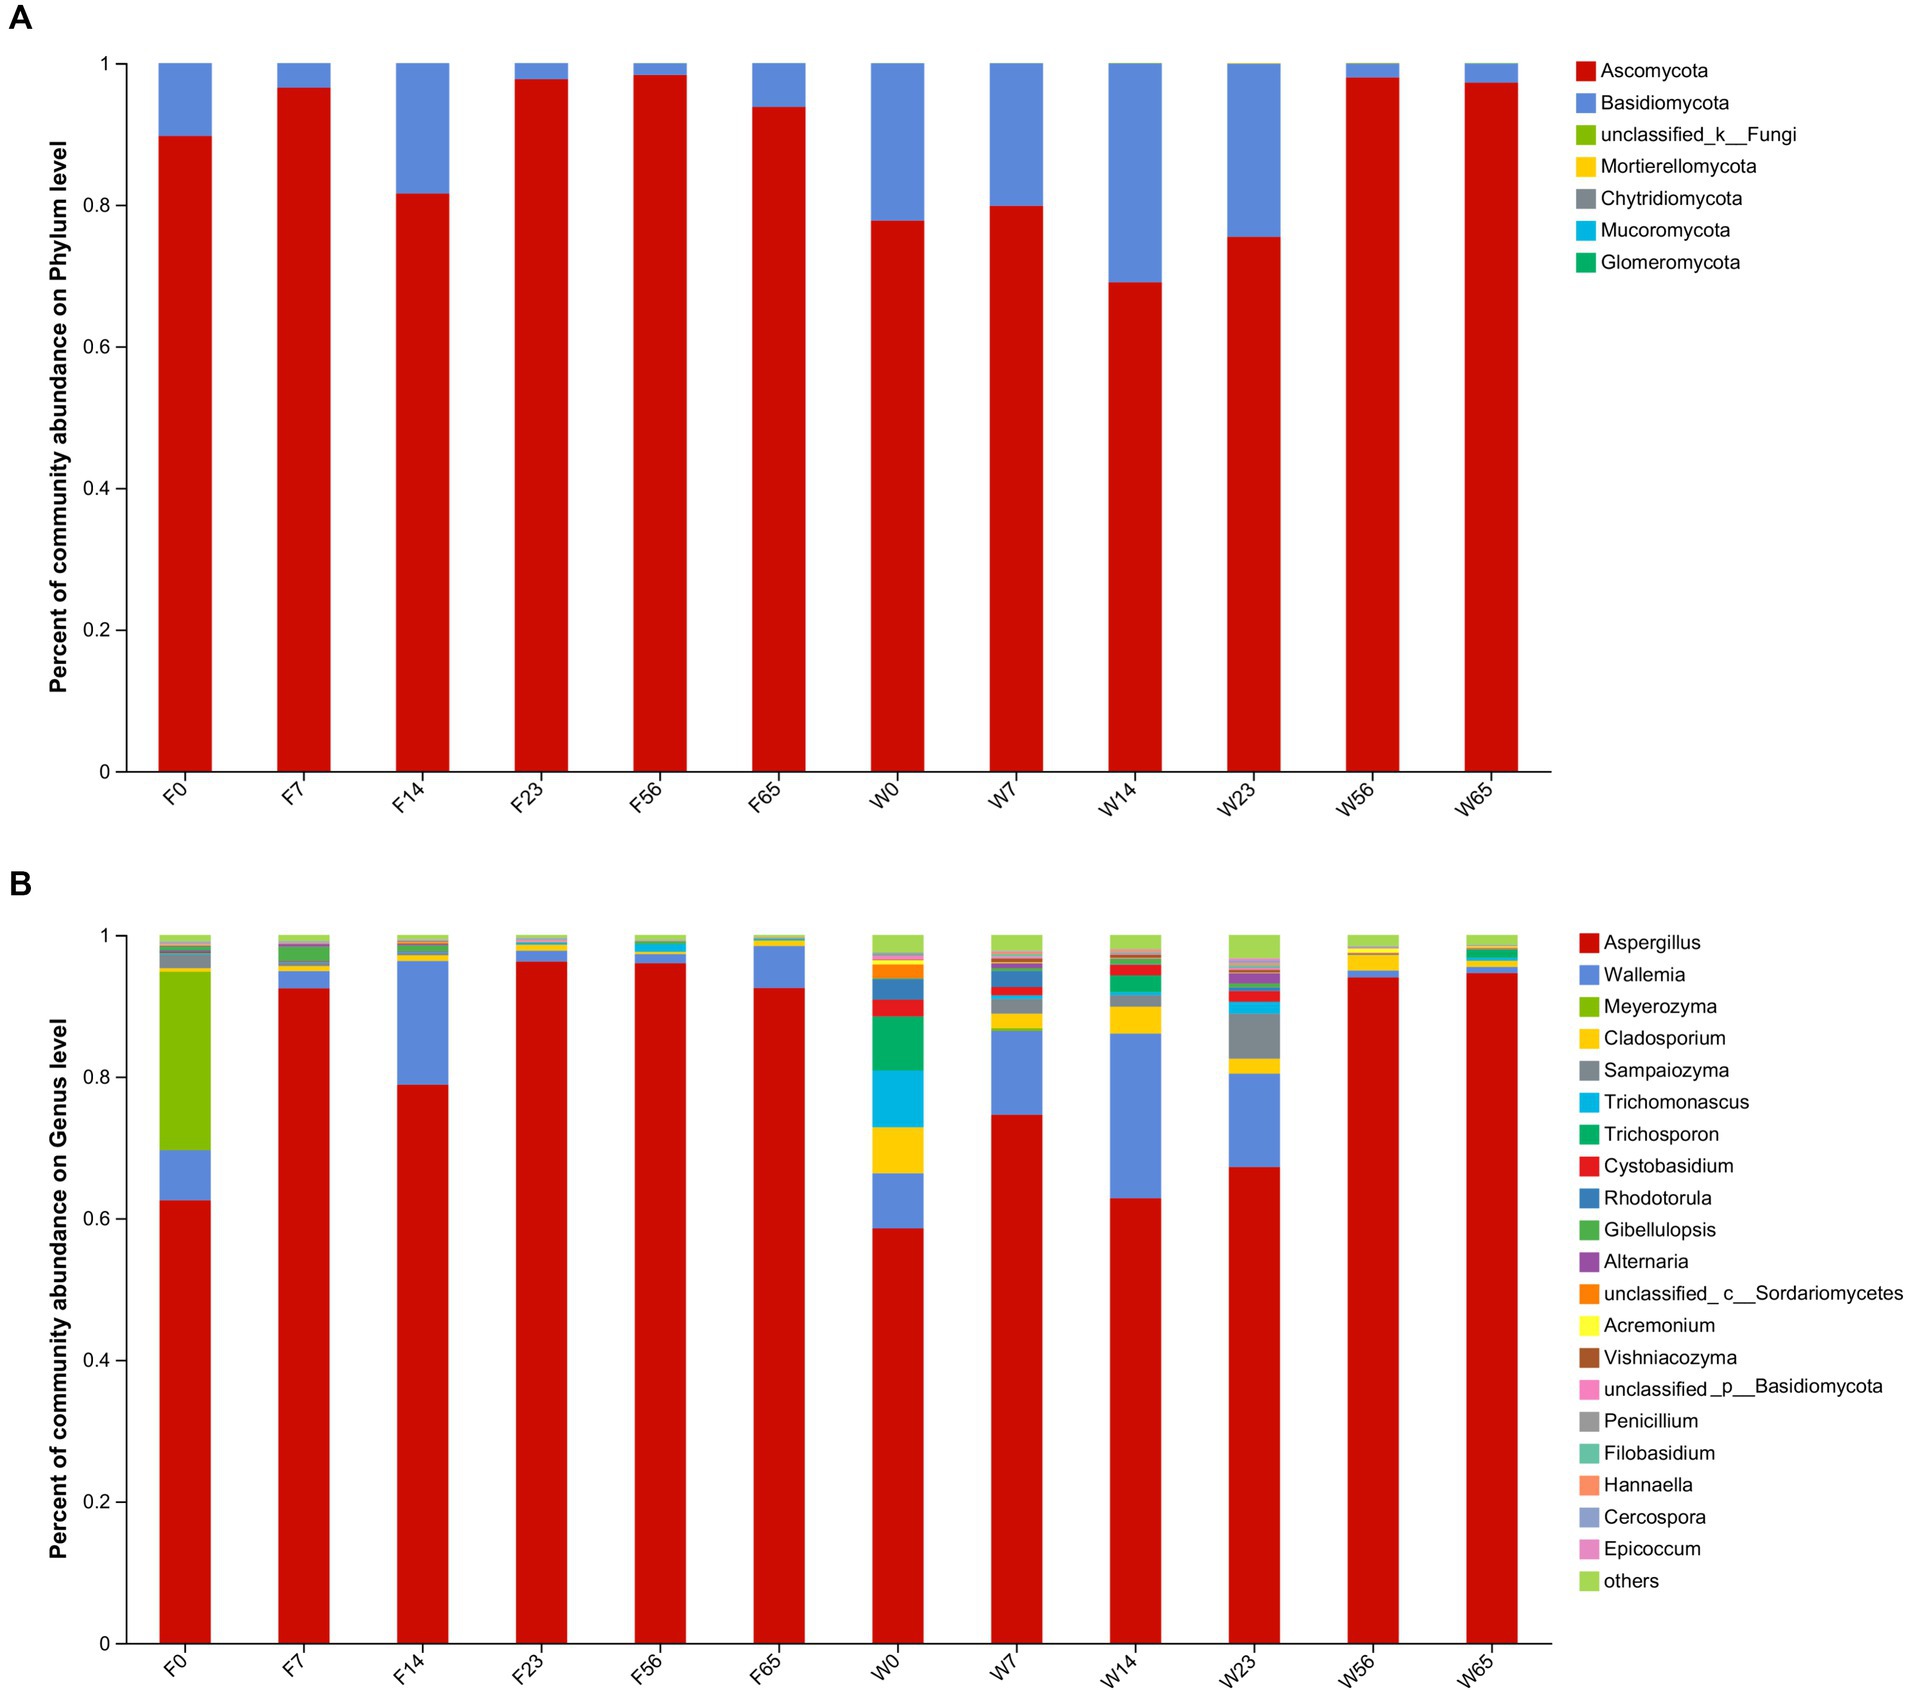
Figure 4. The distribution of the microbial community in CTLs at various stages of fermentation. Fungi at the phylum level (A) and genus level (B).
Among the bacterial genera, Staphylococcus (5.99–97.54%) emerged as the most abundant, followed by Brevundimonas, Staphylococcus (distinct from the previous mention), and Pantoea. Staphylococcus initially exhibited a low abundance (0d) but gradually increased as fermentation progressed, ultimately dominating the microbial community. Conversely, Brevundimonas, Brevibacterium, and Pantoea displayed higher abundances initially, but gradually declined as fermentation progressed. The trend of Brevibacterium during fermentation was more complicated, showing a decreasing and then increasing trend in Filler, and a continuous decreasing trend in Wapper, but the abundance all stabilized at the Late-Stage (56d, 65d); in previous studies, Bacillus also played an important role in the fermentation process, and Brevibacterium possessed a high abundance in F0, but declined dramatically afterward.
During the fermentation process, Ascomycota exhibited the most prominent abundance (69.04–98.32%), whereas Basidiomycota accounted for a comparatively lower proportion, spanning (1.91–30.89%). They cumulatively comprising over 99% of the fungal community throughout the fermentation. Ascomycota exhibited a distinct pattern of initial increase followed by a subsequent decrease during the fermentation, whereas Basidiomycota exhibited an inverse trend, consonant with the observed dynamics of α-diversity.
Within the fungal genus, Aspergillus dominated the fermentation process (58.55 to 96.25%), followed by Wallemia (0.95 to 23.24%). Aspergillus displayed a pronounced increase in abundance during the Initial-Stages (0d, 7d), a subsequent decrease in the mid-fermentation period (14d, 23d), and a significant resurgence in the Late-Stage (56d, 65d). Conversely, Wallemia exhibited a trend of increasing abundance followed by a decrease. Notably, Meyerozyma, a yeast species renowned for its aroma-producing capabilities, possessed a substantial abundance in the Initial-stages but ceased to be detectable in the Mid-Stage, likely due to its role in contributing significant aroma in the Initial-Stage. Sampaiozyma, Cladosporium and Trichomonascus, although less abundant, were commonly present during fermentation and may play an important role in the fermentation of cigar tobacco.
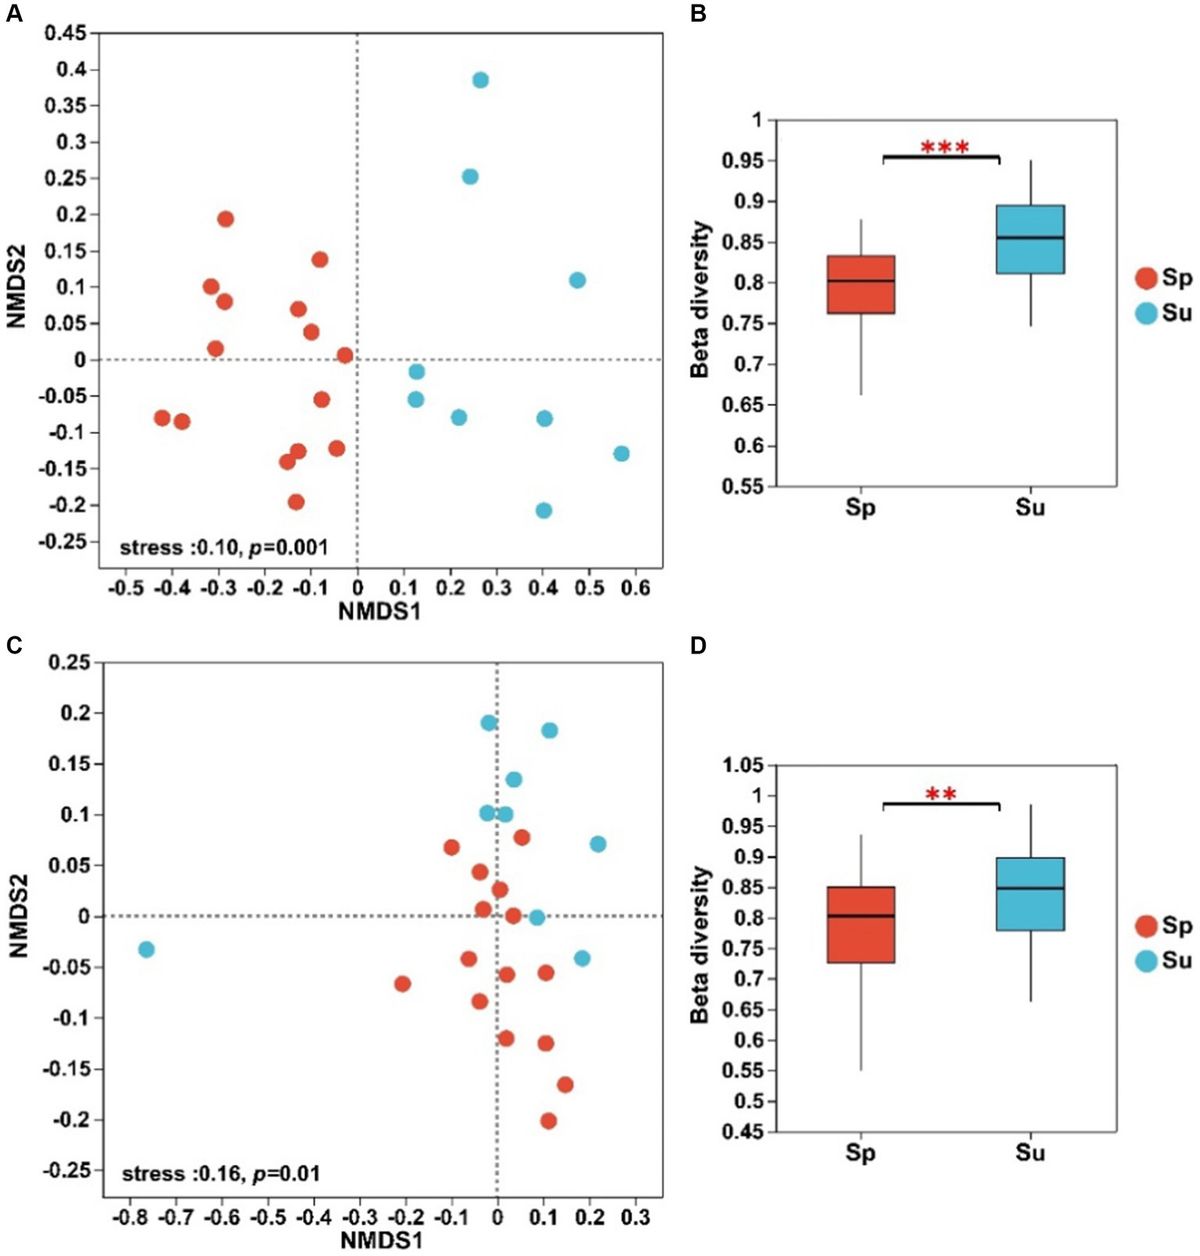
3.4 Clustering analysis of microbial communitiesIn order to more fully illustrate the differences in microbial communities among samples at different stages, cluster analysis was performed. The PCoA plot was obtained by comparative intergroup analysis of the microbial diversity of tobacco at the genus level, followed by dimensionality reduction analysis (Figure 5). The distribution of bacterial communities generally showed a three-stage characteristic, and the CTLs of different varieties possessed their own specificity in the Initial-Stage, W0 and F0 had low similarity, but W7 and F0 had similarity, and as fermentation proceeded, F7, F14, and W14 had high similarity, and F23, F56, F65, W23, W56, and W65 were extremely similar, and according to the PCoA analysis obtained results, the cigar fermentation was categorized into three stages: Initial-Stage, Mid-Stage, Late-Stage. The CTLs of different varieties differed in the Initial-Stage, but the microbial community structure became more and more consistent as the process progressed, but with a high degree of similarity at the end of fermentation.
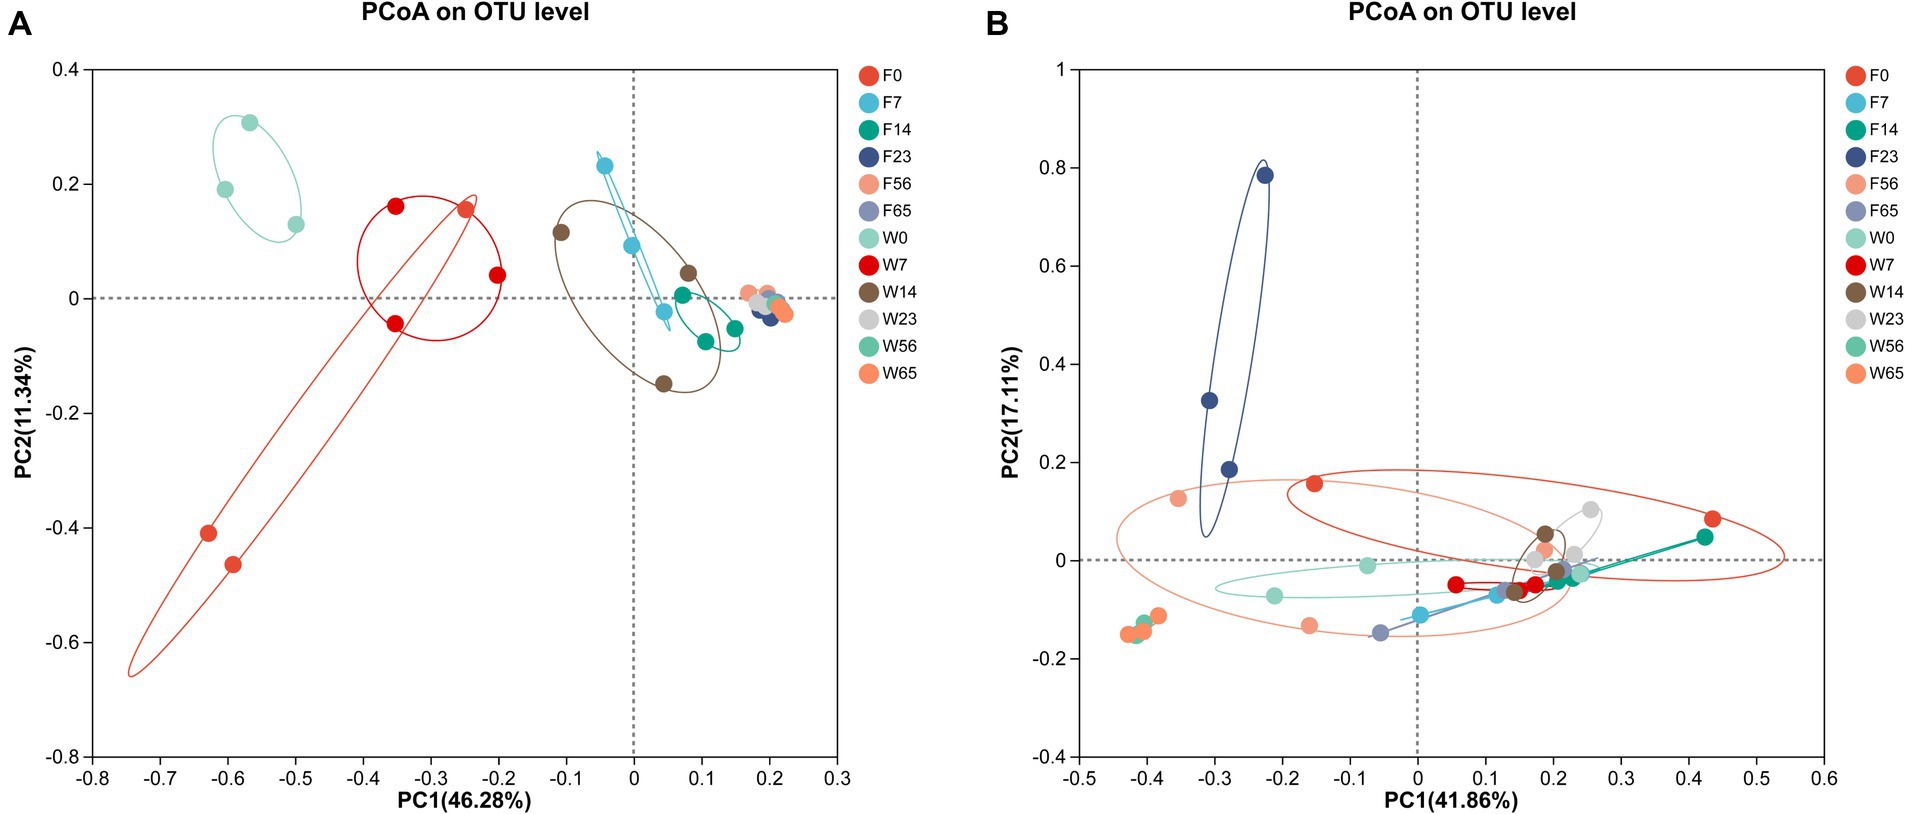
Figure 5. Principal co-ordinates analysis on genus level with cigar bacteria (A) and fungi (B).
As for the fungal community, the samples in each group were more dispersed compared to bacteria, without obvious stage differentiation, but still clustered into one group at the Late Stage (56d, 65d), indicating that the structure of microbial community tended to be consistent at the end of fermentation.
For in-depth analysis of the bacterial and fungal community structure, the top 20 abundant genus were selected for clustering (Figure 6). This clustering facilitate a comparative assessment of the community composition across various time points. The heat map reaffirmed the convergence in the phyllosphere microbial composition of distinct CTLs species during the Late-Stage-Fermentation. During the Initial-Stage-Fermentation, specifically at 0 days, the microbial communities exhibited similar species diversity, yet there were substantial variations in the abundance of each genus, resulting in a poor overall similarity. As the fermentation progressed to the Mid-Stage, the disparities between the communities gradually diminished. In the Late-Stage of fermentation, particularly after 56 days, a marked similarity in the community composition was observed across CTLs, regardless of their fermentation duration or species. This similarity represents the culmination of the primary fermentation process for cigars. Notably, the abundance of the key microorganisms in the Wapper attained a steady state earlier than Filler, indicating a faster progression of the fermentation process in the Wapper compared to the Filler.
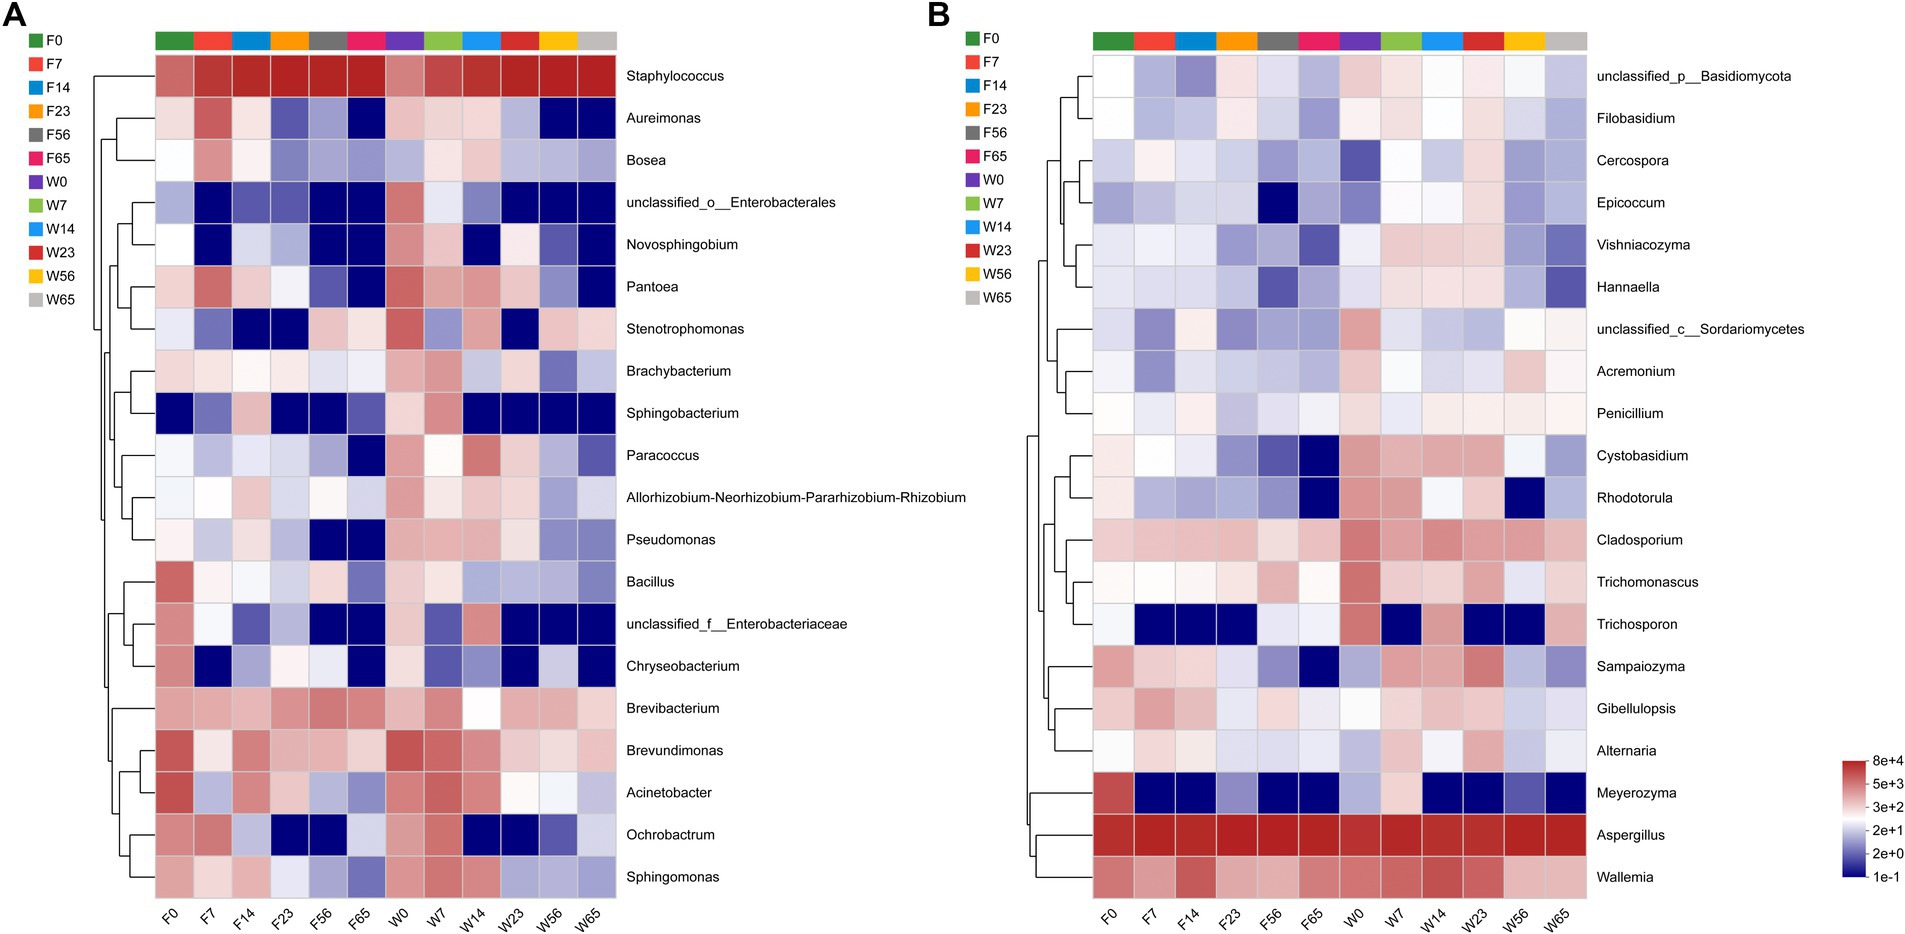
Figure 6. Genus-level bacterial (A) and fungal (B) community heat maps for cluster analysis.
We conducted a comprehensive LEfSe multilevel species difference discriminant analysis on CTLs of varying species and stages (Supplementary Figure S2). The analysis aimed to discern significant differences at multiple taxonomic level (phylum, order, family, genus, and species). Furthermore, the LDA value served as a metric to quantify the extent of species’ influence on the observed differences (Supplementary Figure S3), thereby indicating a potential pivotal role played by species in the dynamic process of environmental change. With regards to the bacterial community within Wapper, characteristic species include Staphylococcus, Paracoccus, Brachybacterium, Microbacterium, Sphingomonas, and Pantoea. Among the fungal species, Wallemia, Cladosporium, Vishniacozyma, and Sampaiozyma were identified as distinctive. Conversely, in Filler, the bacterial community was characterized by the presence of Brevundimonas, Oceanobacillus, Bosea, Aureimonas, and Bacillus, with Aspergillus being the sole distinctive fungal species. Importantly, both Aspergillus, the most abundant fungal genus, and the bacterial genus Staphylococcus exhibited notable roles in varying CTLs genotypes. However, their influence was particularly pronounced in Filler.
Using the LEfSe analysis as a basis, a random forest algorithm was employed to precisely identify signature microorganisms and discover differential biomarkers at each stage (Figure 7). The Mean Decrease Accuracy metric quantifies the extent of reduction in the random forest’s predictive accuracy when a variable’s value is randomly perturbed, with higher values indicating greater significance of that variable. The left-sided bar graph depicts the significance of the biomarkers at the genus level, while the bubble graph on the right portrays the importance of each differential bacterial genus at specific stages. Given the high significance of the Staphylococcus genus across all stages, in comparison to other dominant bacterial genera, we excluded its effect. In the pre-fermentation period, Pantoea emerged as a prominent signature microorganism, followed by Sphingomonas. Notably, Filler exhibited unique signature microorganisms in the Initial-Stage, particularly Aureimonas, a genus that was not significantly represented in Wapper. Furthermore, we observed that the signature fungi were nearly absent in Filler compared to Wapper, where Rhodotorula was identified as the signature fungi in the Initial-Stage, Sampaiozyma during the Mid-Stage, and Cladosporium was prominent in both the pre- and mid-fermentation phases.
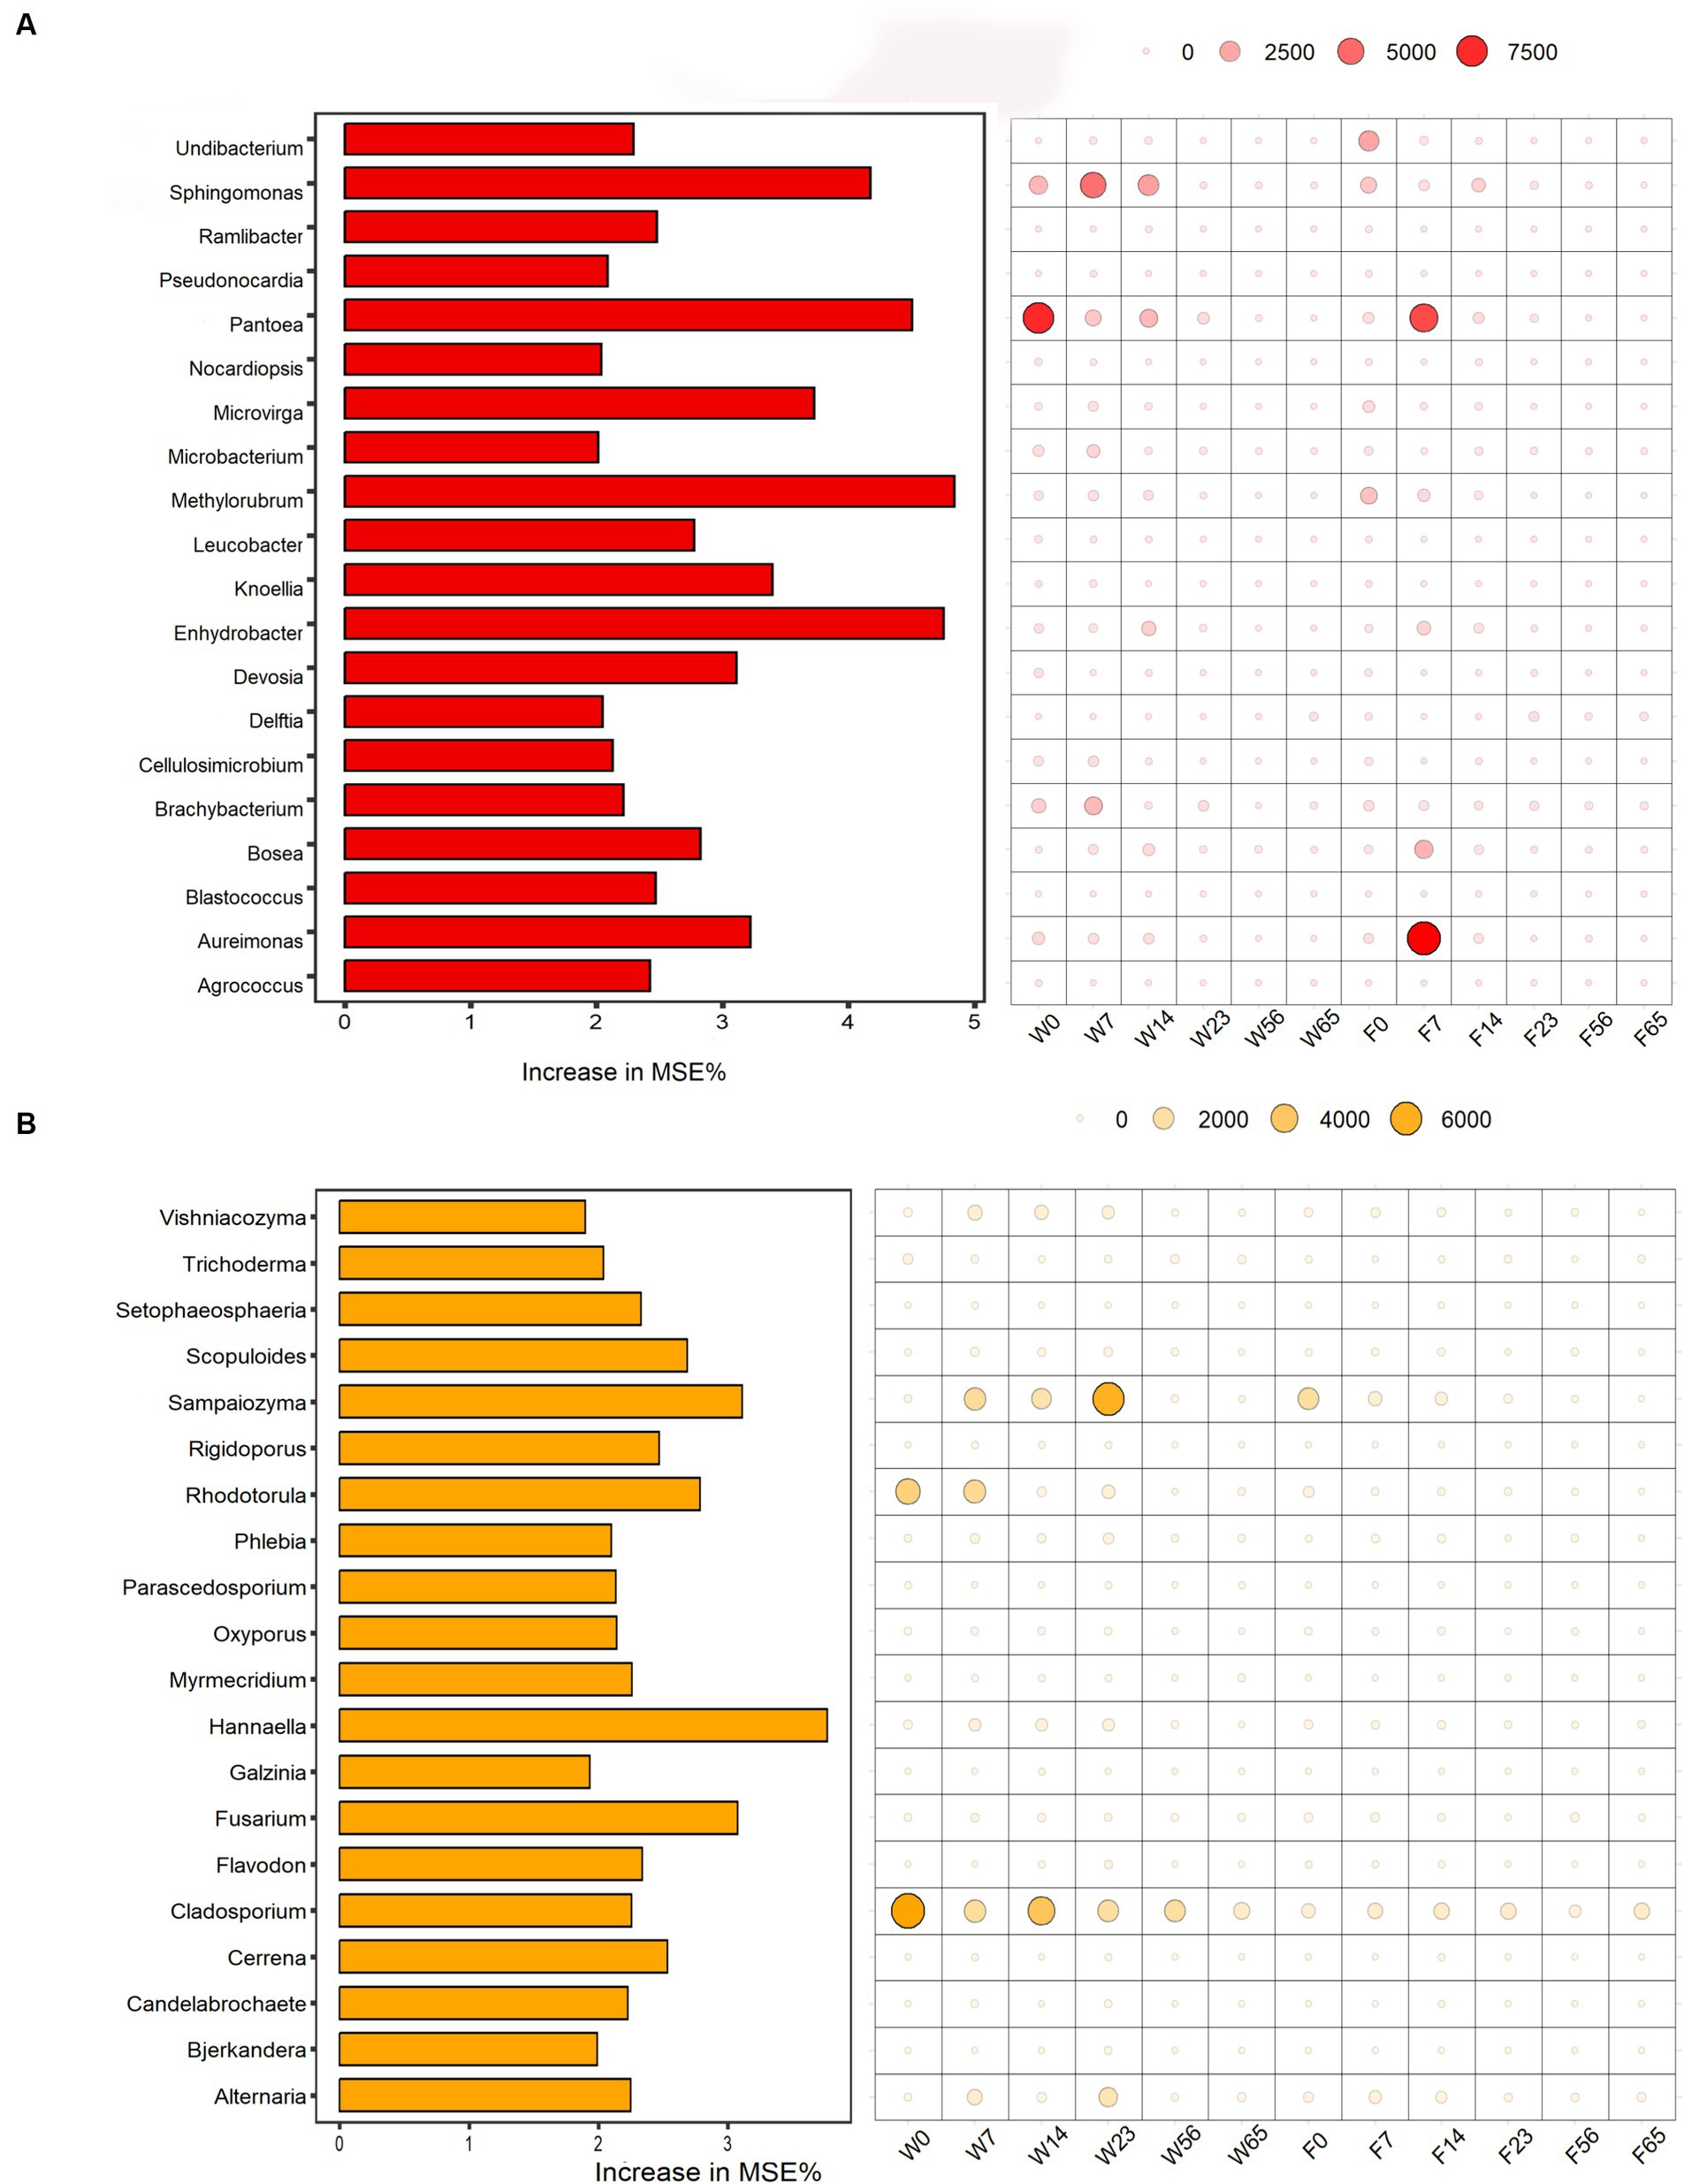
Figure 7. Random forest algorithm to calculate biomarkers for bacterial (A) and fungal (B) community in cigar fermentation processes.
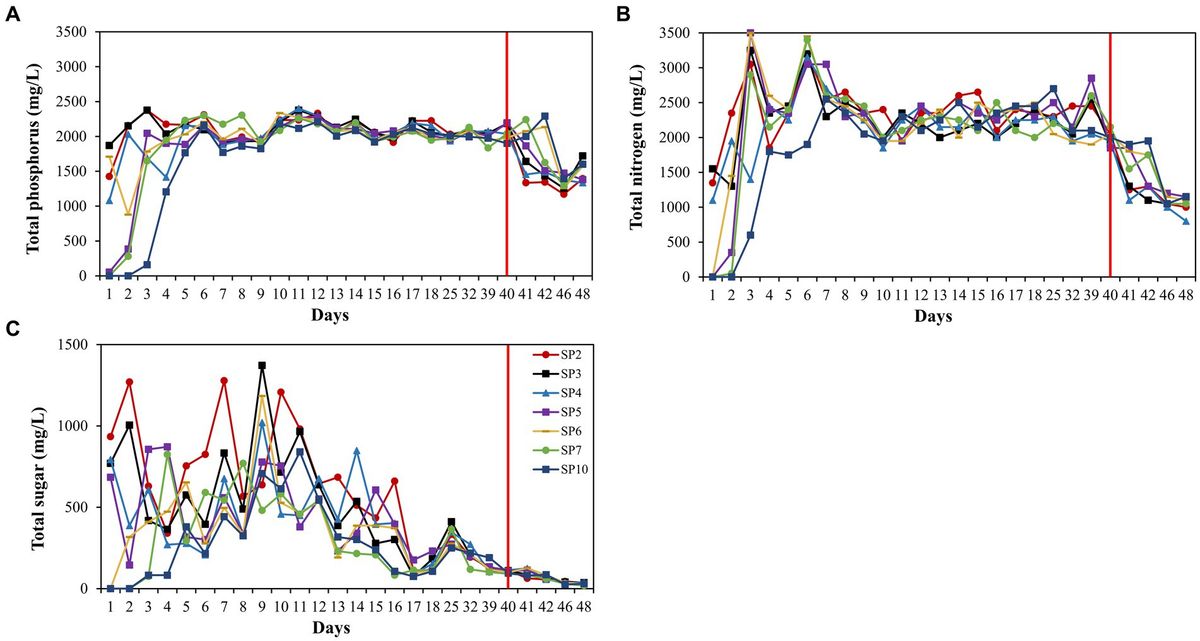
3.5 Chemical composition of fermentationWe take an analysis was conducted to determine the concentrations of chloride, potassium, total sugar (TS), starch, and nicotine among different fermentation stages. The outcomes revealed a distinctive pattern in the chloride, initially exhibiting a decline followed by an increase, culminating in a significant augmentation in the end of process, this pattern was consistently observed across diverse varieties (Figure 8A). Analogous to chloride content, potassium content also exhibited a similar trend of initial decrement and subsequent increment, with the notable difference that chloride concentrations remained consistently higher throughout the process, while potassium concentrations were lower in Wapper compared to Filler (Figure 8B). Total sugar content, a crucial indicator for assessing the quality of cigar tobacco, displayed an intermediate rise in both samples, yet underwent a sharp decline towards the Late-Stage, ultimately significant failing below the initial levels. Notably, despite a significant disparity in the initial total sugar content between the two samples, their concentrations converged towards the end of the process, as depicted in Figure 8C. Starch exhibited a similar trend to total sugar, displaying sharp fluctuations in the Mid-Stage, but stabilized in the Late-Stages (Figure 8D). Conversely, nicotine content gradually decreased throughout the process, with a marked decrement at the culmination of fermentation. Notably, Wapper possessed a higher nicotine content compared to Filler in the end (Figure 8E).
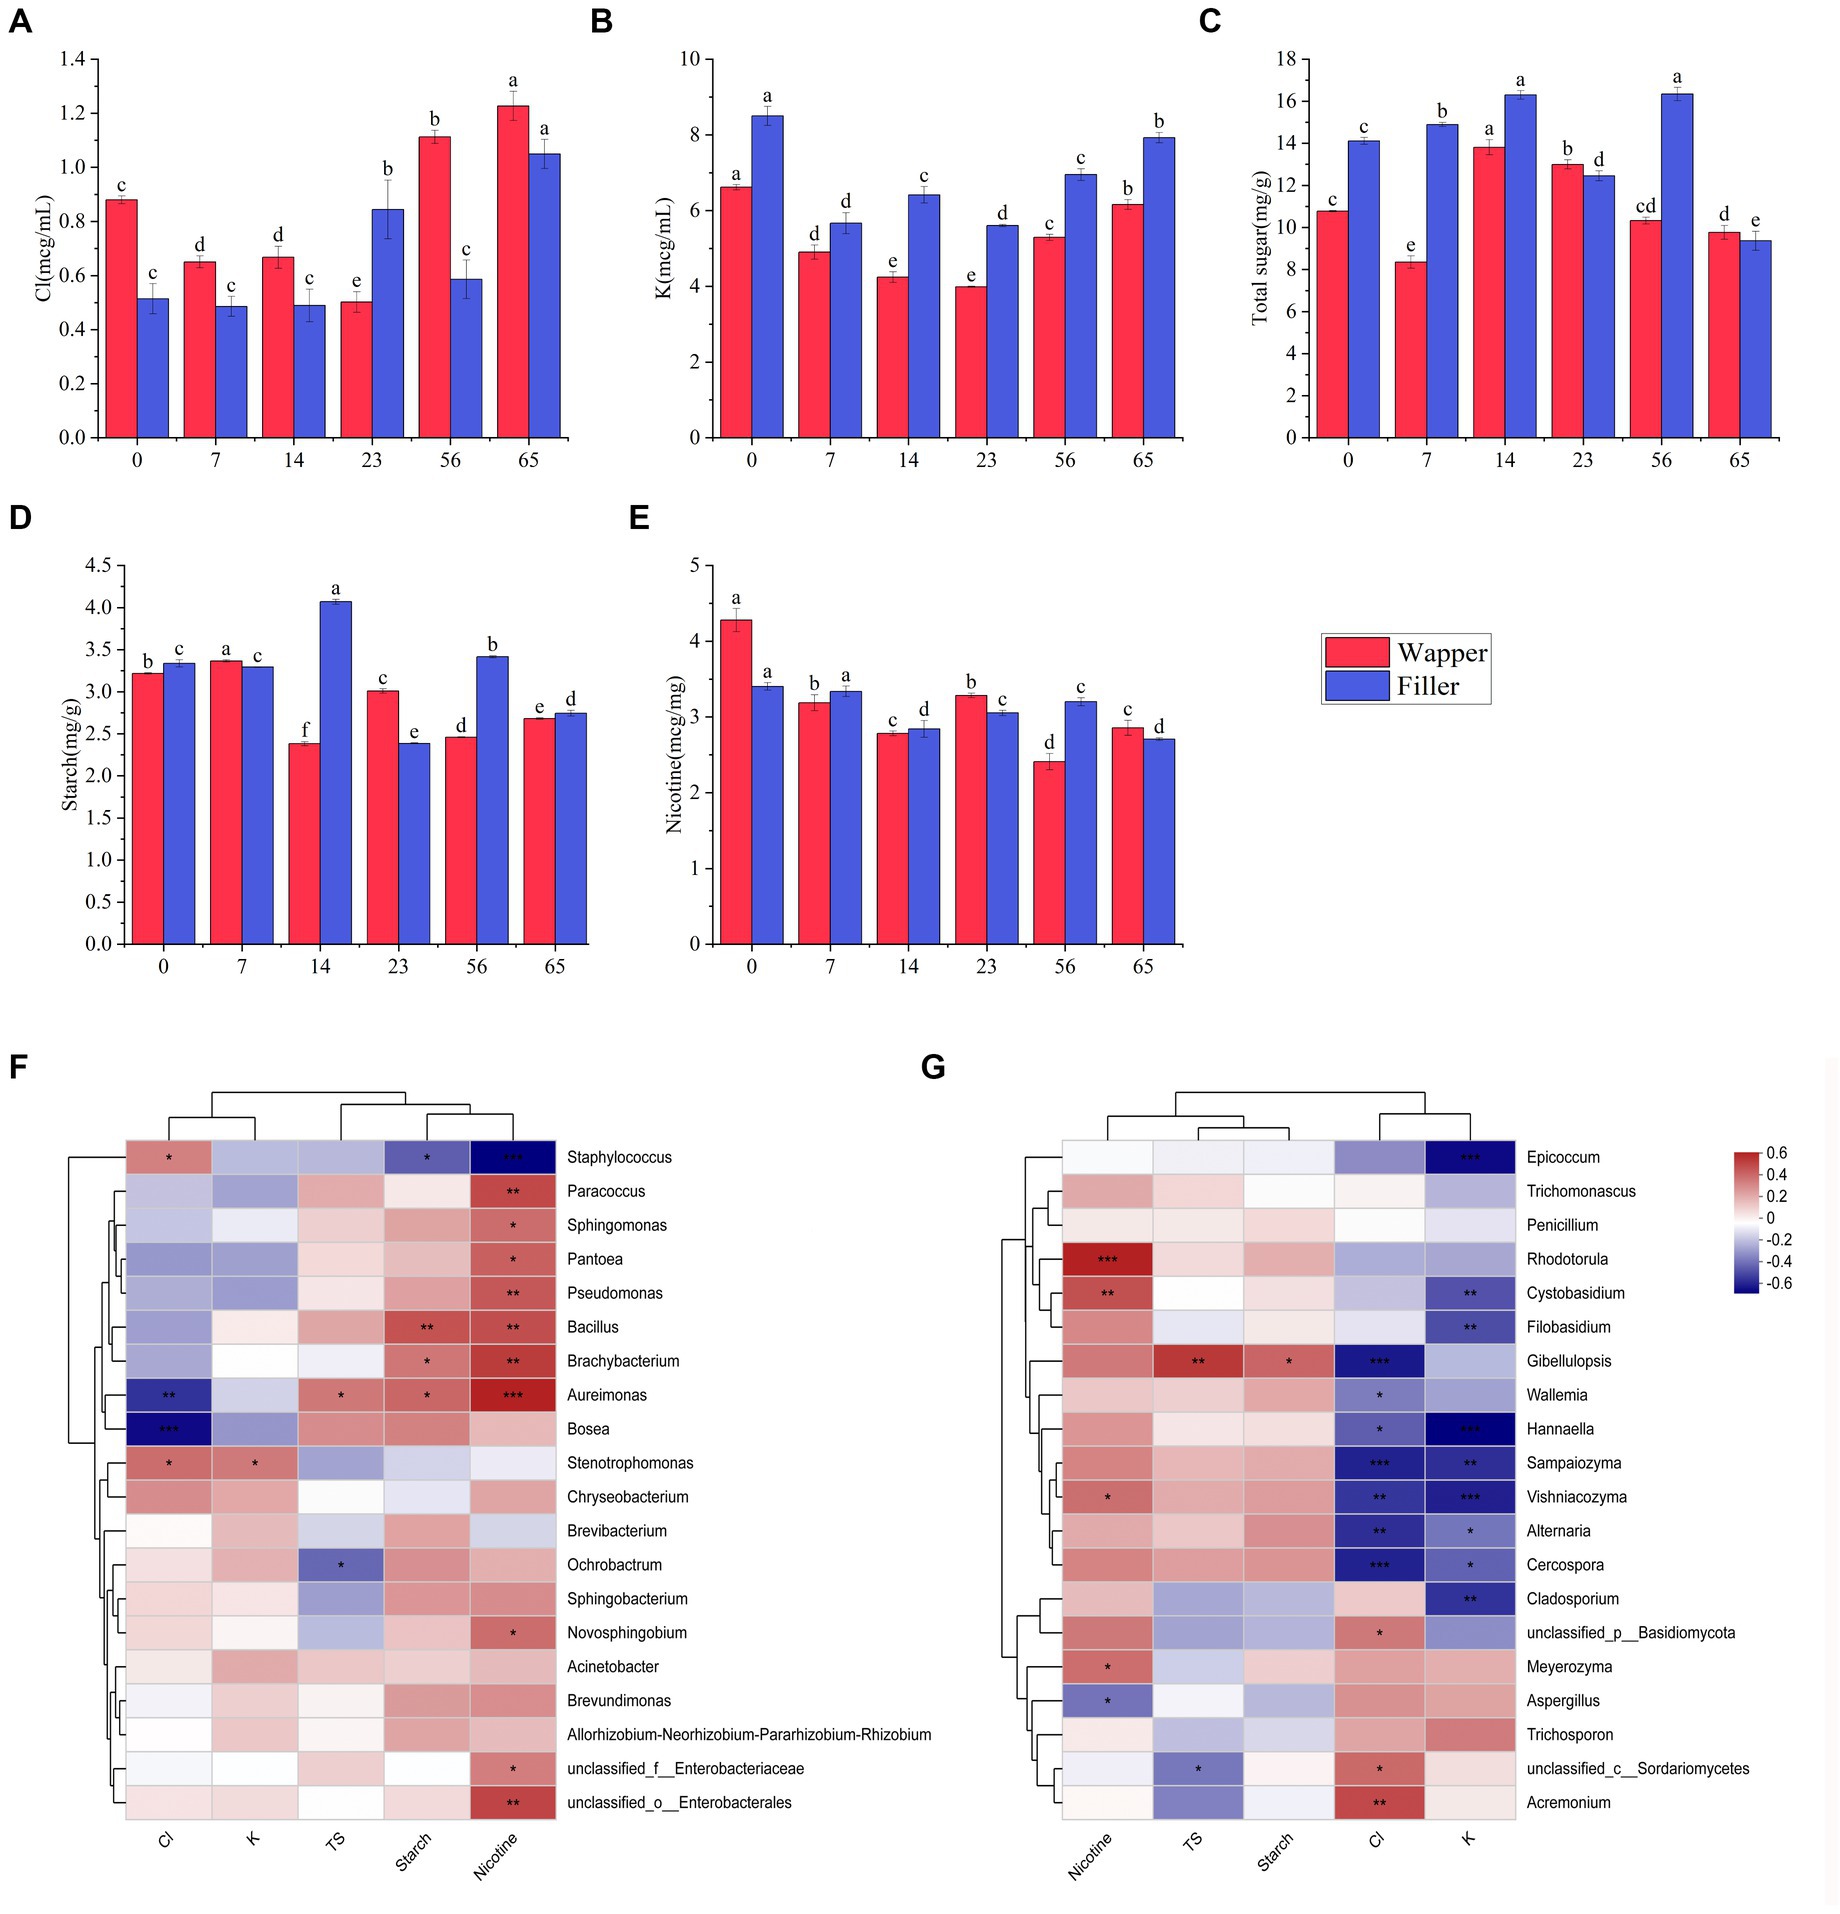
Figure 8. Changes in chemical content during fermentation: (A) chlorine, (B) potassium, (C) starch, (D) total sugars, and (E) nicotine; correlation of top 20 dominant bacterial genera (F) and fungal genera (G) with chlorine, potassium, starch, total sugars, and nicotine content. 0, 7, 14, 23, 56, and 65 is the duration of fermentation.
The analysis revealed a discernible pattern of correlation between the dominant bacterial genera and their chemical composition (Figures 8F,G). Specifically, Staphylococcus exhibited a notable positive correlation with the chlorine content and a negative correlation with nicotine, total sugar, starch, and potassium. Among these parameters, the association with nicotine was particularly significant, followed closely by starch. Conversely, Bacillus displayed a significant positive correlation with starch and nicotine, while exhibiting a negative correlation with chlorine. Aureomonas showed a significant positive correlation with total sugar, starch, nicotine, and a significant negative correlation with chlorine content. Bosea exhibited a significant negative correlation with chlorine content. Ochrobacterium, on the other hand, displayed a significant negative correlation with total sugar. Furthermore, the genera Paracoccus, Sphingomonas, Pantoea, and Pseudomonas, as well as Brachybacterium, all exhibited significant positive associations with nicotine. In contrast to the intimate association observed between bacteria and organic compounds, fungi exhibit a stronger correlation with chlorine and potassium. Among the top 20 fungal genera in abundance, 14 genera exhibited a significant correlation with either chlorine or potassium, predominantly displaying a negative correlation. However, exceptions were noted in Acremonium and Branchiostoma, which showed a significant positive correlation with chloride, these fungi maintained a relatively low abundance throughout the process. Additionally, fungi exhibited a notable correlation with nicotine content, with the exception of Aspergillus, which displayed a significant negative correlation. Conversely, Rhodotorula, Cystobasidium, and Vishniacozyma all exhibited significant positive correlations with nicotine.
3.6 Metabolites during fermentationIn the course of the fermentation process, metabolomic analysis identified a total of 1,219 metabolites, encompassing 589 terpenoids, 167 steroids, 111 phenolic acids, 82 organic acids, 70 indoles, 63 flavonoids, 56 alkaloids, 38 coumarins, 18 lignans, 15 quinones, 8 stilbenes, 2 ellagitannins, and 2 tannins. The application of Principal Component Analysis (PCA) revealed a distinct segregation of metabolites among the various samples within each group, indicating significant variations in the metabolic profiles of CTLs of diverse varieties at different stages (Figure 9). Notably, the Wapper samples attained a metabolic steady state at an earlier stage, with the metabolite distributions converging at 56 and 65 days. This observation was further corroborated by Partial Least Squares Discriminant Analysis (PLS-DA).
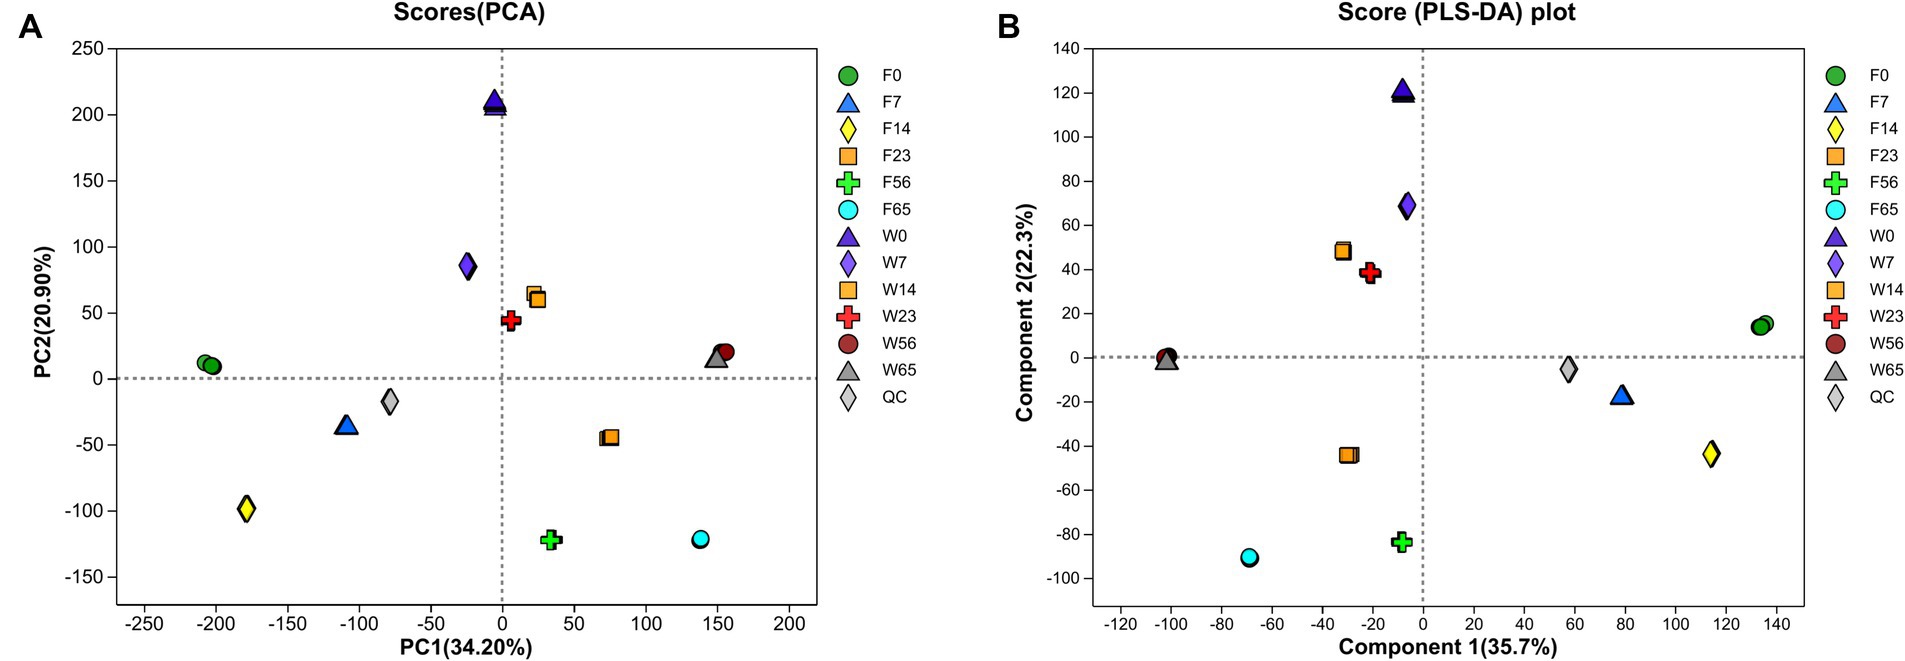
Figure 9. Principal component analysis (A) and partial least squares discriminant analysis (B) to map whole process metabolism.
A rigorous approach involving both univariate and multivariate statistical analyses was implemented to screen for differential metabolites across the two distinct biomes. A representative time node from various stages of the same cultivar was selected for pairwise comparative analysis. Similarly, this comparative analysis was also conducted for the metabolite profiles of Wapper and Filler at 0 and 65 days, representing the pre- and post-fermentation states (Figure 10). The analysis revealed 768 differential metabolites in F23 vs. F0 (up = 486, down = 282), and 832 differential metabolites in F23 vs. F65 (up = 520, down = 312). 860 differential metabolites were observed in W23 vs. W0 (up = 466, down = 394), along with 797 differential metabolites (452 upregulated, 345 downregulated). 727 differential metabolites in F0 vs. W0 (up = 305, down = 422), and 807 differential metabolites in W65 vs. F65 (up = 396 down = 411). The metabolic activity on the cigar leaf surface peaked during the mid-fermentation stage, highlighting its crucial role in the initial cigar fermentation process. The comparison of differential metabolite indices between the two cultivars at 0d and 65d suggested that Wapper exhibited a more robust metabolism at Initial-Stage but trailed behind Filler towards the Late-Stage. This finding aligns with the relatively faster completion of the fermentation in Wapper, consistent with the microbial community heatmap and PCA/PLS-DA metabolite clustering results.
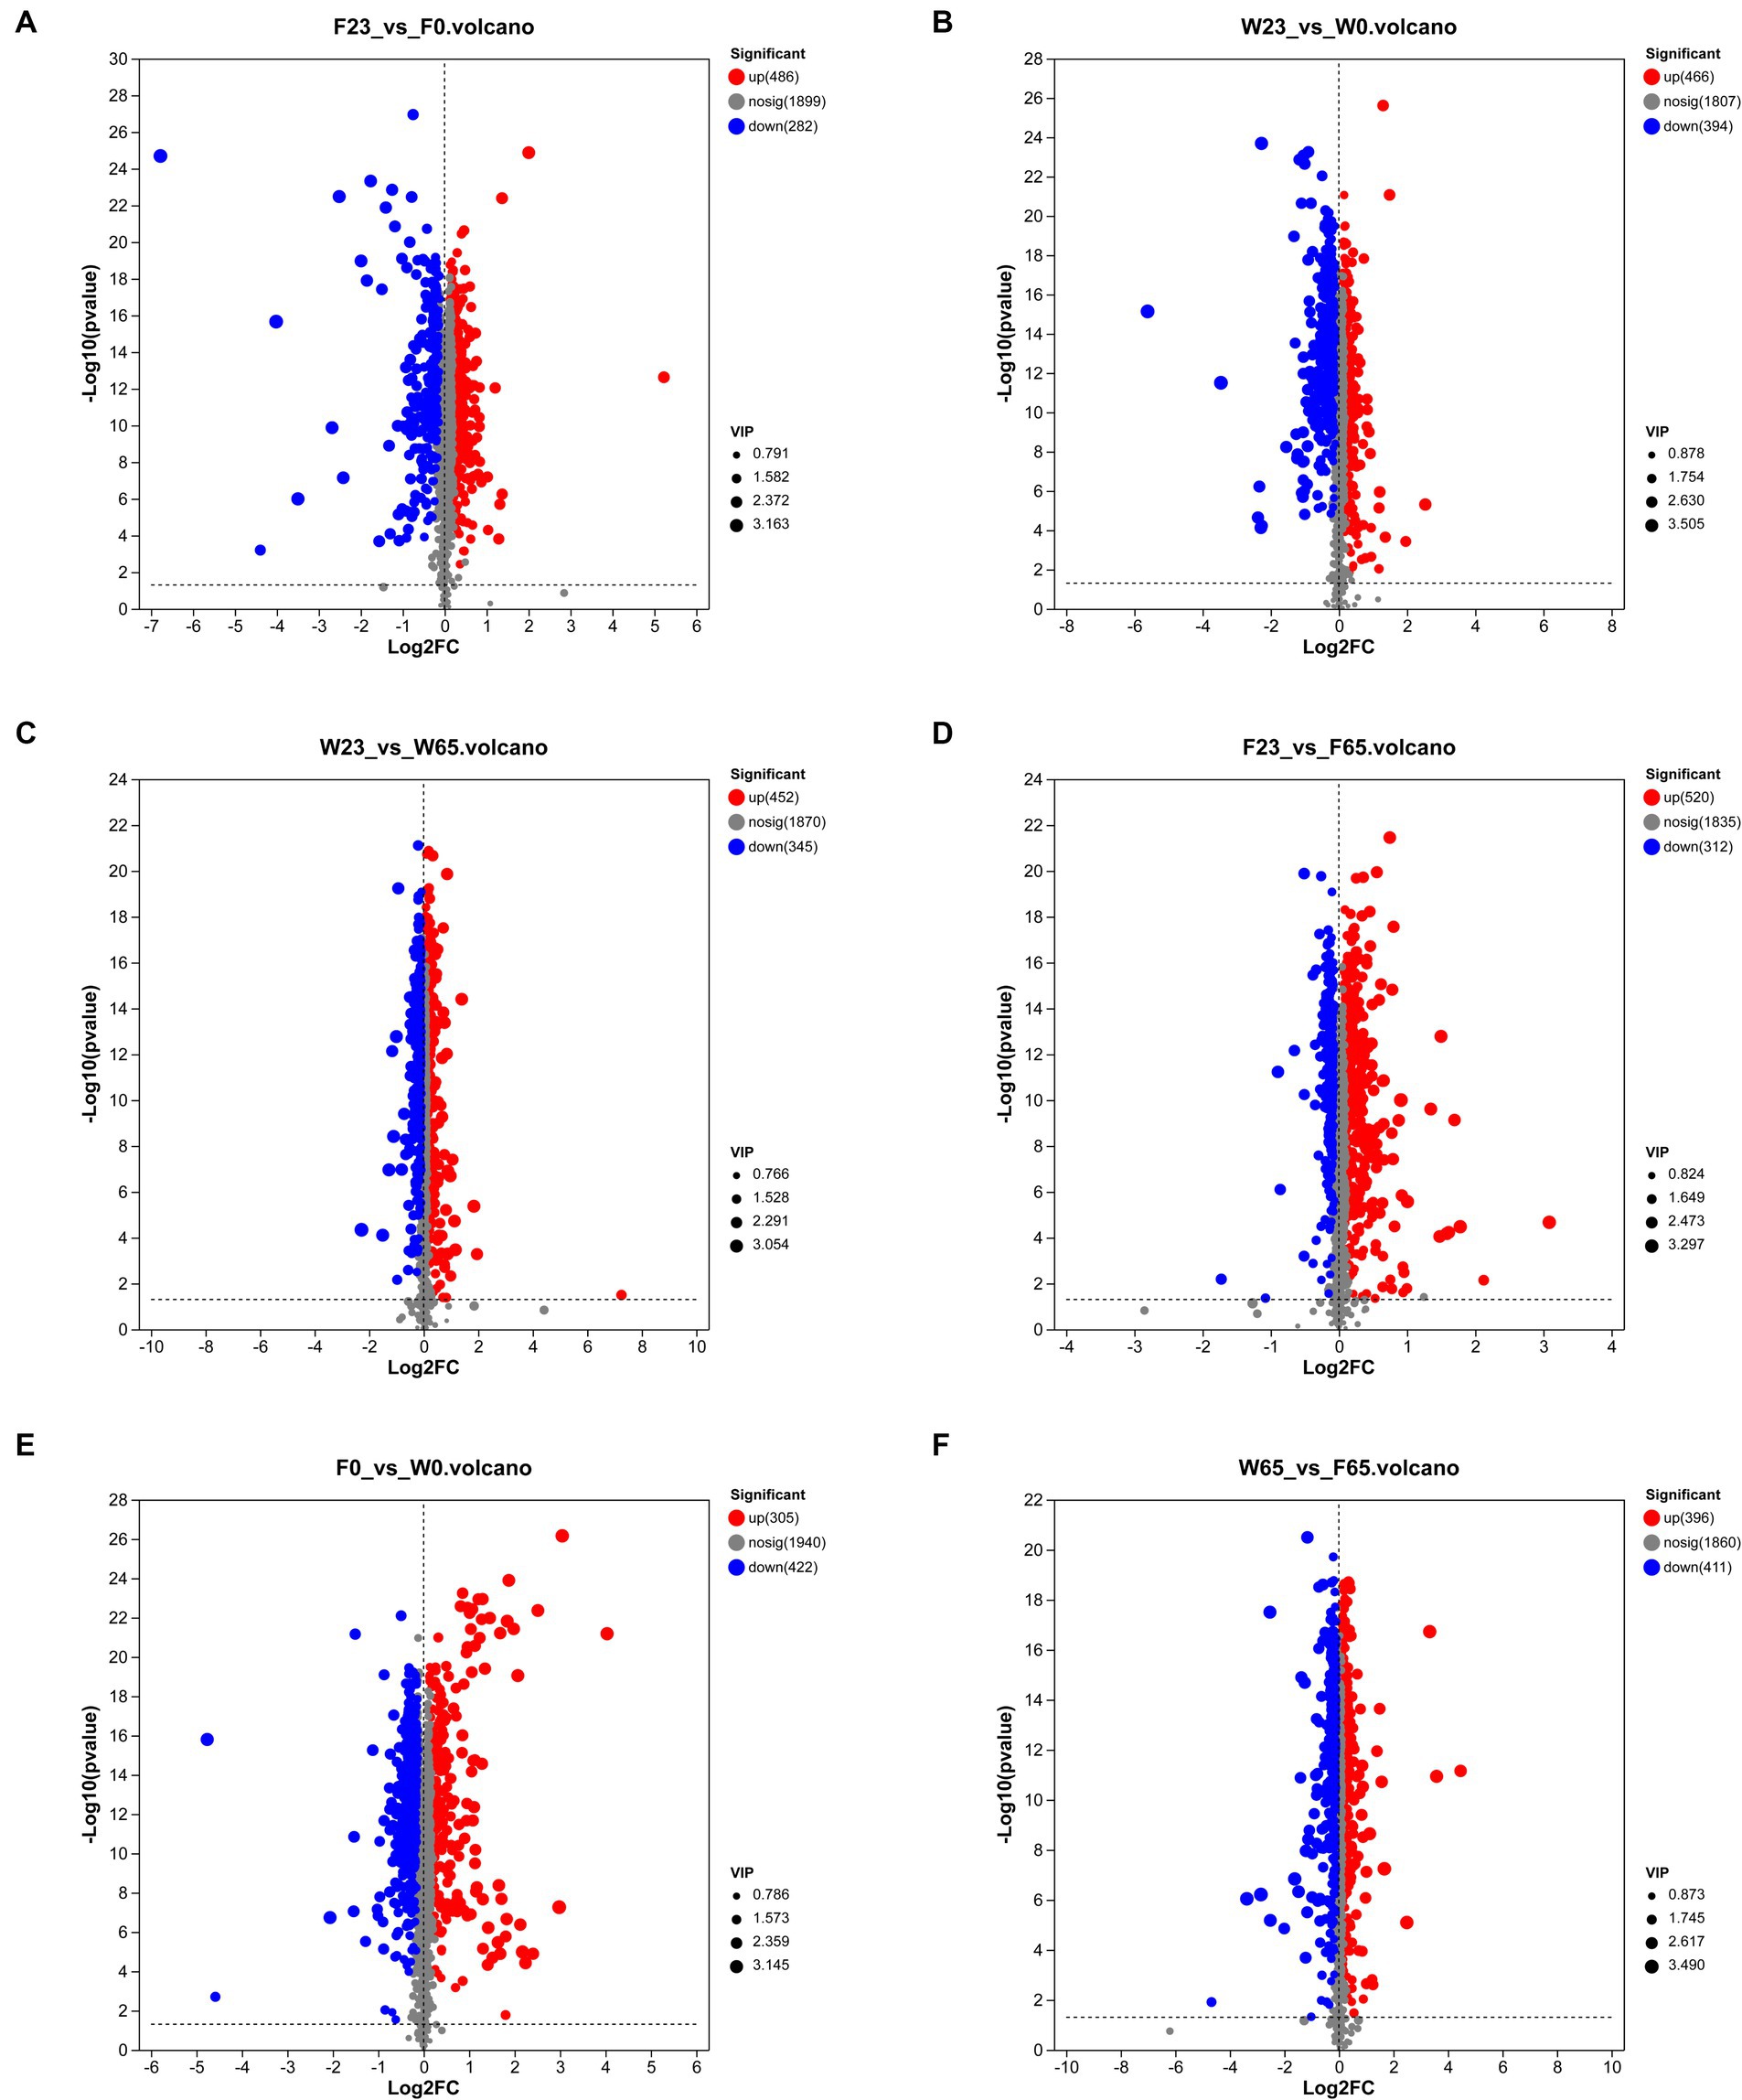
Figure 10. Differential metabolite volcano plots of controls between groups (A) F23 vs. F0, (B) W23 vs. W0, (C) W23 vs. W65, (D) F23 vs. F65, (E) F0 vs. W0, and (F) W65 vs. F65; each point in the plots represents a specific metabolite, and the magnitude of the point indicates the VIP value. Red points indicate significantly up-regulated metabolites, blue points indicate significantly down-regulated metabolites, and gray points are non-significantly different metabolites.
Utilizing the KEGG database, we were able to perform enrichment analysis on the identified differential metabolites, leading to the identification of significant metabolic pathways during the process (Figure 11). In the comparison between different stages, the metabolic pathways that were significantly enriched in the W23 vs. W0 are “Biosynthesis of cofactors,” “Tryptophan metabolism,” “Nucleotide metabolism,” “Arachidonic acid metabolism,” “Tyrosine metabolism.” The metabolic pathways that were significantly enriched in the W23 vs. W65 are “Tryptophan metabolism,” “Phenylpropanoid biosynthesis,” “Valine, leucine and isoleucine biosynthesis,” “Cutin, suberine and wax biosynthesis,” “Nucleotide metabolism.” The metabolic pathways that were significantly enriched in the F23 vs. F0 are “Arginine and proline metabolism,” “D-Amino acid metabolism,” “Tryptophan metabolism.” The metabolic pathways that were significantly enriched in the F23 vs. F65 are “Arachidonic acid metabolism,” “Valine, leucine and isoleucine biosynthesis,” “Arginine and proline metabolism,” “Linoleic acid metabolism,” “Alanine, aspartate and glutamate metabolism,” “Nucleotide metabolism,” “Phenylalanine metabolism,” “Tryptophan metabolism,” “ABC transporters,” “Aminoacyl-tRNA biosynthesis.”
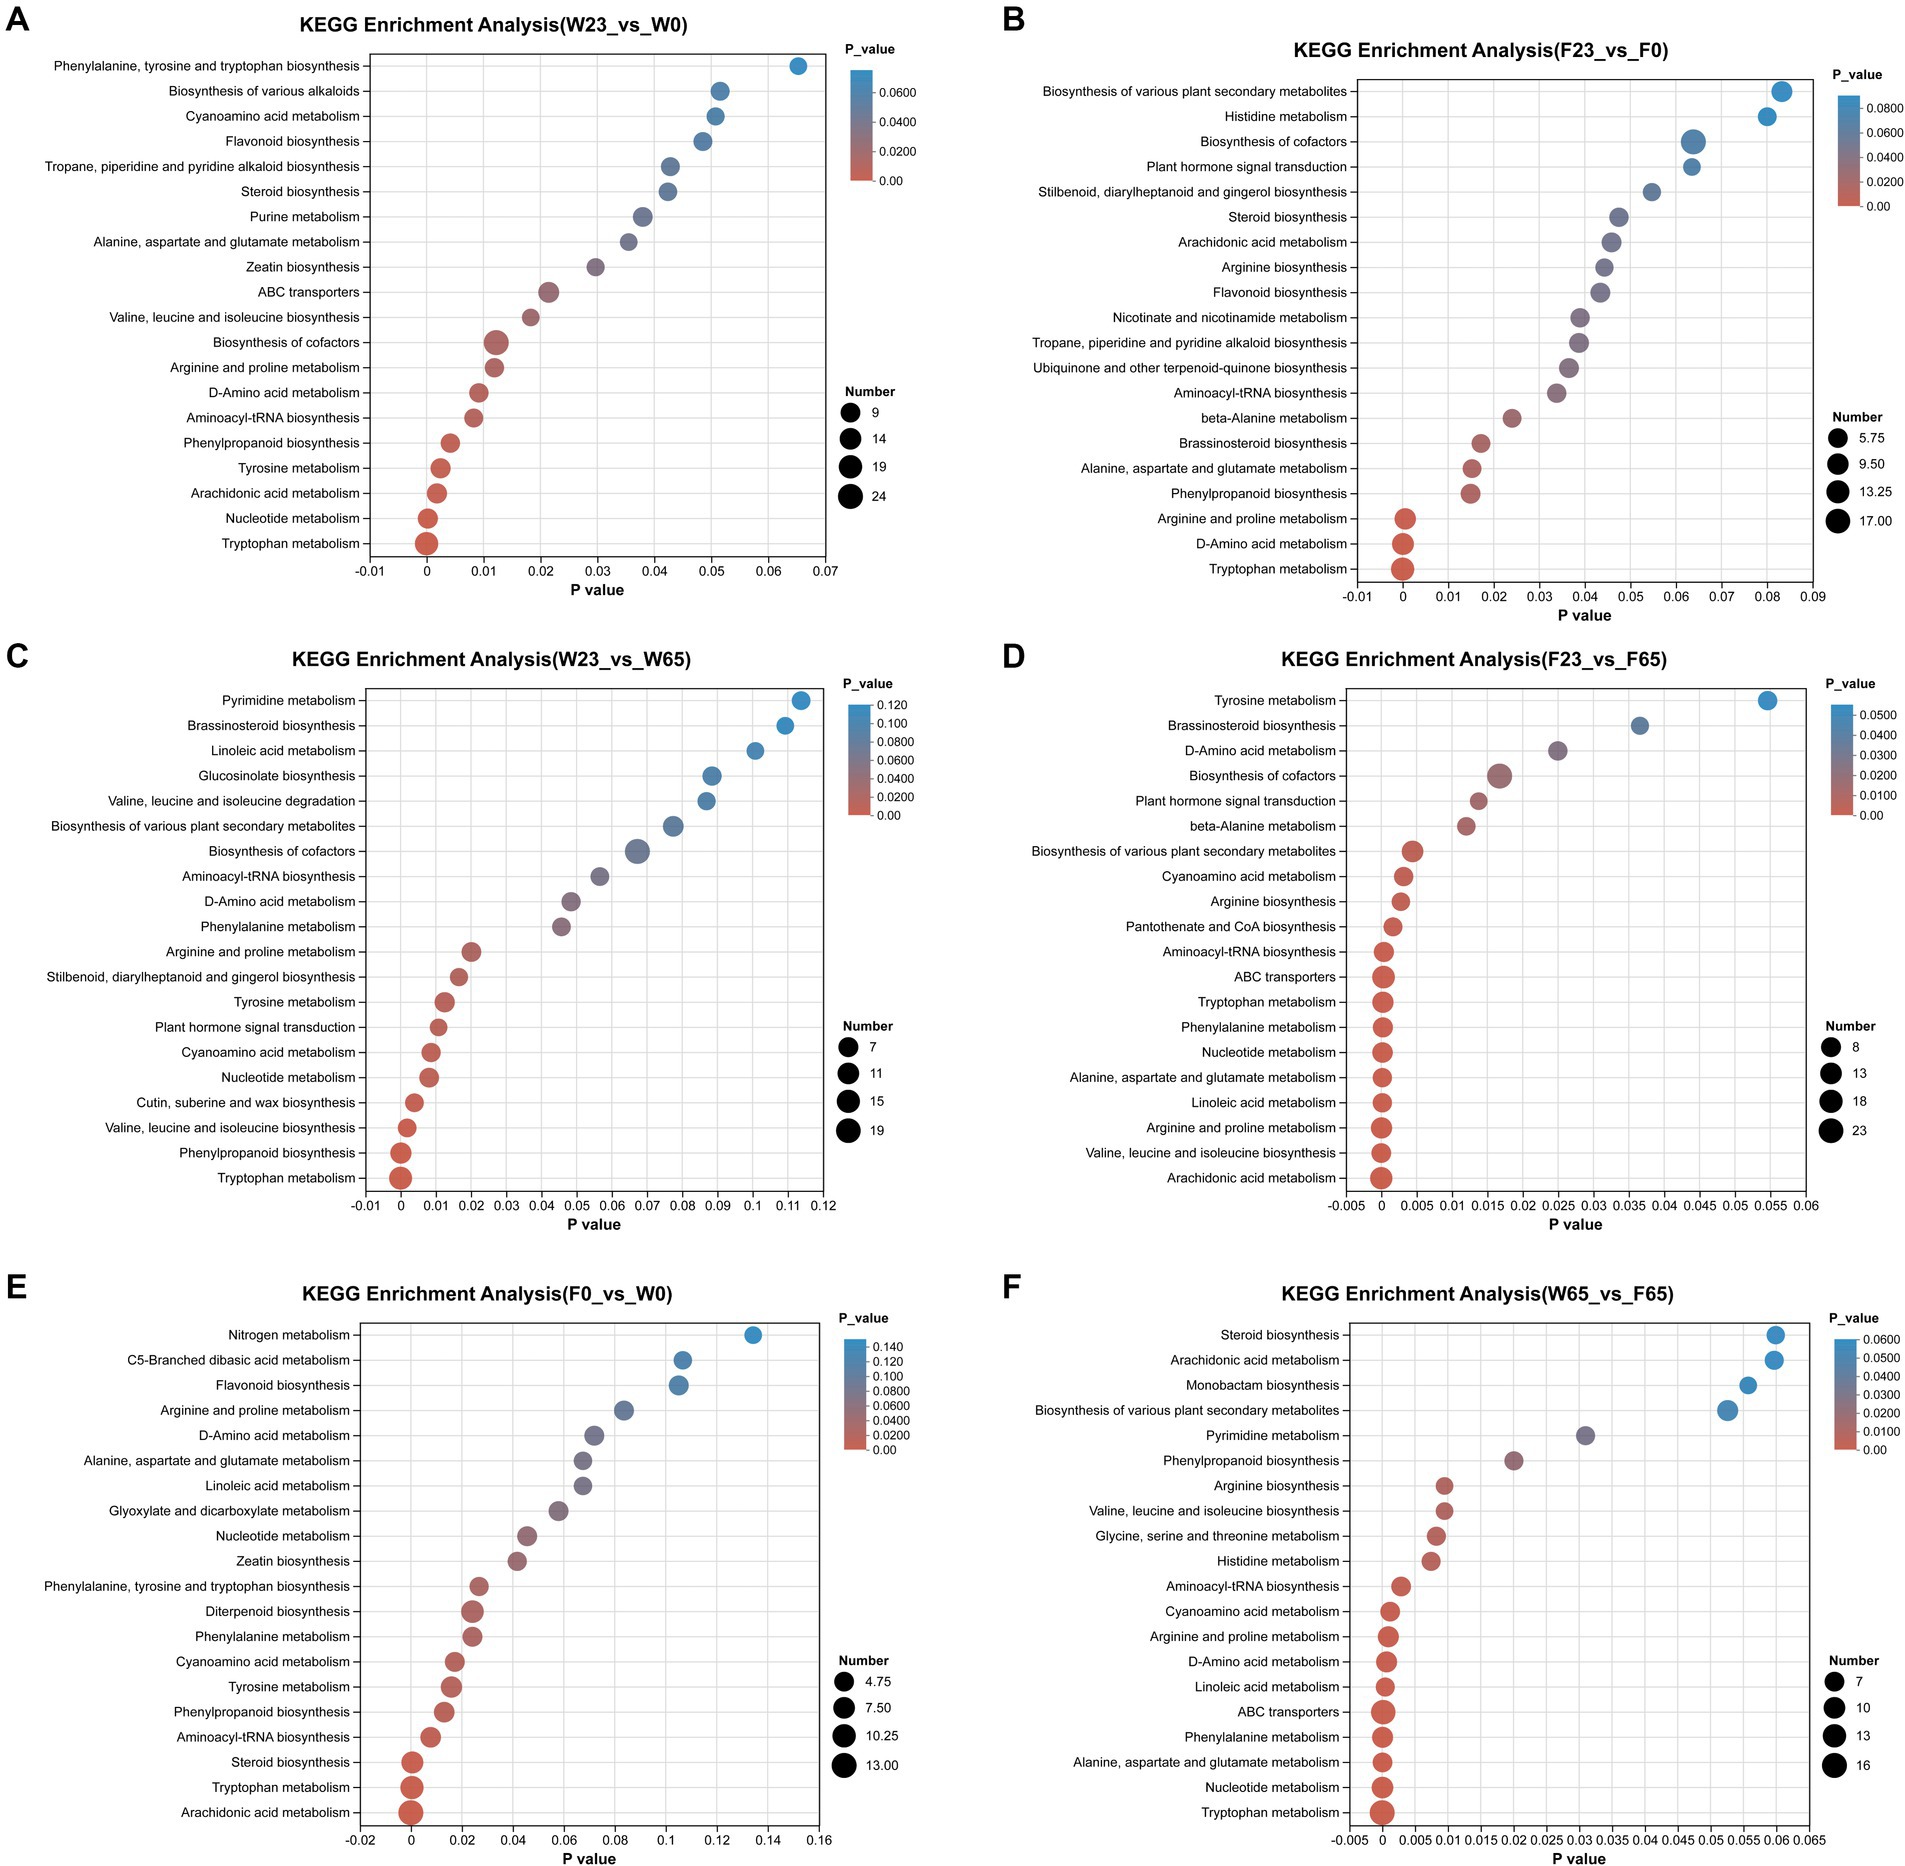
Figure 11. KEGG metabolic pathway enrichment between groups (A) F23 vs. F0, (B) W23 vs. W0, (C) F23 vs. F65, (D) W23 vs. W65, (E) F0 vs. W0, and (F) W65 vs. F65; the horizontal coordinates are the p-value of the significance of the enrichment, and the smaller p-value is statistically significant, and a p-value of less than 0.05 is generally considered to be a function of a significantly enriched term; vertical coordinate is KEGG pathway. The size of the bubbles in the graph represents how much of the pathway is enriched to the metabolic set of compounds.
When comparing between different varieties, the metabolic pathways that were significantly enriched in the F0 vs. W0 are “Arachidonic acid metabolism,” “Tryptophan metabolism,” “Diterpenoid biosynthesis,” “Steroid biosynthesis,” “Aminoacyl-tRNA biosynthesis.” The metabolic pathways that were significantly enriched in the F0 vs. W0 are “Tryptophan metabolism,” “Nucleotide metabolism,” “Alanine, aspartate and glutamate metabolism,” “Phemtlalanine metabolism,” “ABC transporters,” “Linoleic acid metabolism,” “Phenylalanine metabolism,” “Arginine and proline metabolism,” “cyanoamino acid metabolish.”
As depicted in the Wayne diagram (Supplementary Figure S4), a mere 35 metabolites were found to be shared among the comparison groups of stages and genotypes, indicating a high degree of specificity in the majority of differential metabolites, necessitating further analysis. To elucidate these metabolites, the Top-20 metabolites between groups were selected for clustering analysis (Supplementary Figure S5). In the W23 vs. W0 comparison, 10 up-regulated metabolites included 4 amino acids, 2 others, 2 vitamins, 1 terpene, and 1 indole, while 10 down-regulated metabolites comprised 3 others, 3 terpenes, 2 lipids, 1 carbohydrate, and 1 amino acid. In W23 vs. W65, 11 up-regulated metabolites encompassed 4 lipids, 1 indole, 1 carbohydrate, 1 amino acid, 1 steroid, 1 nucleotide, 1 organic acid, 1 others, and 9 down-regulated metabolites comprised 6 terpenes, 1 carbohydrate, 1 lipid, and 1 others. In F23 vs. F0, 8 up-regulated metabolites consisted of 4 lipids, 2 carbohydrates, and 2 others, while 12 down-regulated metabolites comprised 4 others, 4 terpenes, 2 lipids, 1 steroid, and 1 carbohydrate. Finally, in F23 vs. F65, 10 up-regulated metabolites comprised 7 lipids, 2 steroids, and 1 others, and 10 down-regulated metabolites consisted of 3 lipids, 3 others, 2 terpenoids, 1 amino acid, and 1 carbohydrate.
Between genotypes, W0 vs. F0 revealed 10 up-regulated metabolites comprising 3 amino acids, 2 vitamins, 2 others, 2 organic acid, and 1 indole, while 10 down-regulated metabolites encompassed 4 lipids, 4 terpenes, and 2 others. In W65 vs. F65, 12 up-regulated metabolites were identified, including 5 lipids, 3 amino acids, 1 organic acid, 1 nucleotide, 1 terpene, and 1 others. The 8 down-regulated metabolites comprised 6 lipids, 1 steroid, and 1 others.
3.7 Correlation of metabolites with microbiotaThe top 20 metabolites were rigorously selected and subjected to an in-depth analysis, taking into account their associations with the predominant bacterial and fungal genera (Figure 12). The metabolites associated with the dominant bacterial genera can be categorized into three cluster across the entire metabolic profile. Cluster 1 was primarily composed of terpenes, cluster 2 encompassed lipids, indoles, and carbohydrates, while cluster 3 was primarily dominated by amino acids. Notably, the interplay between the substances in cluster 1 and the dominant genera exhibited a complex pattern, with the numbers of bacteria displaying positive and negative correlations are largely equivalent, yet the majority of significant correlations are predominantly negative. Such as Stenotrophomonas and Novosphingobium. In cluster 2, while most substances displayed negative correlations with the dominant genera, the most abundant genus, Staphylococcus, exhibited a significant positive correlation. Additionally, Brevibacterium also displayed a positive correlation with most substances. In cluster 3, most substances displayed positive correlations with the dominant genera, particularly with Stenotrophomonas and Pantoea, yet exhibited significant negative correlations with Staphylococcus and Brevibacterium.
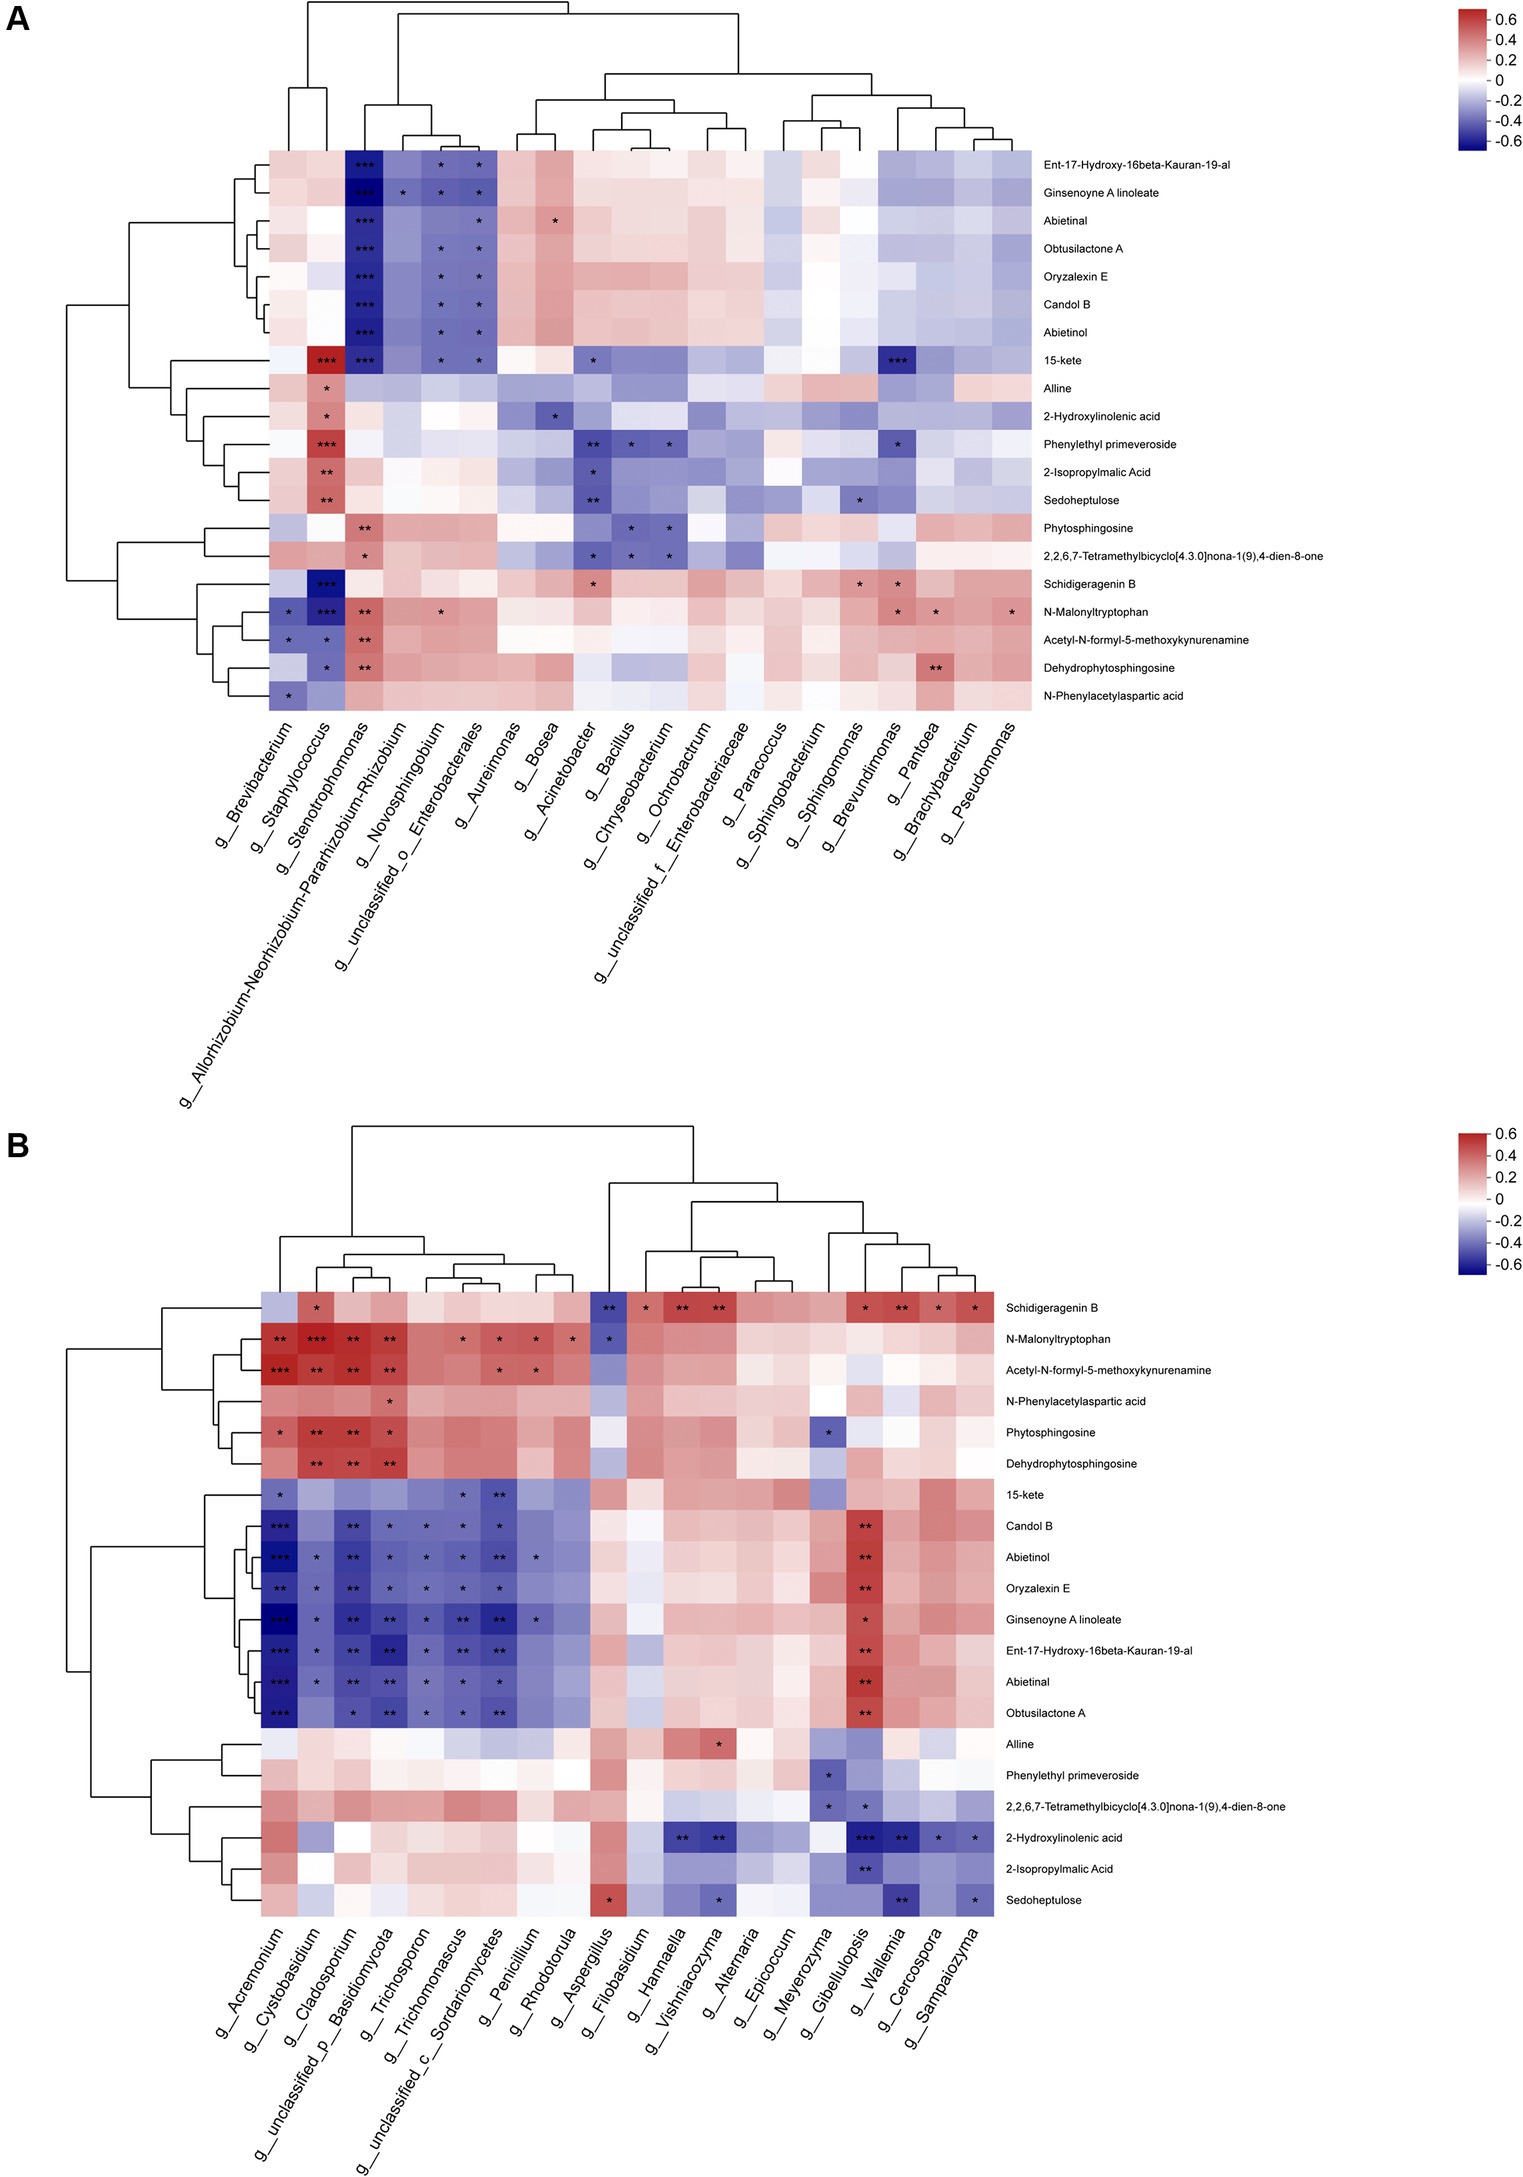
Figure 12. Association analysis of top 20 metabolites during fermentation with (A) dominant bacterial genera and (B) dominant fungal genera.
In analyzing the fungal genera, a similar categorization of the top 20 metabolites into three cluster was observed. Cluster 1 primarily encompassed amino acids, cluster 2 primarily comprised terpenes and lipids, while cluster 3 primarily contained indoles, carbohydrates, and lipids. The metabolites within cluster 1 displayed positive correlations with most dominant fungal genera, particularly exhibiting significant positive correlations with Acremonium, Cystobasidium and Cladosporium, a few metabolites exhibited significant negative correlations with Aspergillus.
The 4 fungal species exhibiting significant positive correlations with metabolites in cluster 1 displayed contrasting behaviors in cluster 2, demonstrating marked negative correlations with all metabolites, analogous to the patterns observed in Trichosporon and Trichomonascus. In contrast, all genera apart from Trichosporon displayed positive correlations with metabolites, particularly with Gibellulopsis. However, in cluster 3, the correlations between metabolites and the dominant genera were comparatively minor, with only Meyerozyma, Gibellulopsis, and Wallemia exhibiting significant negative correlations with most metabolites. Notably, the important genus Aspergillus displayed positive, albeit non-significant, correlations with cluster 3. Furthermore, the association between metabolites in cluster 3 and the dominant genera was relatively insignificant, with only Meyerozyma, Gibellulopsis, and Wallemia exhibiting significant negative associations with most metabolites, while the significant genus Aspergillus exhibited a positive association with cluster 3, though the correlation was not statistically significant.
3.8 Overview of association networks between important microorganismsNetwork analysis was used to show the distribution of species, and the 15 most abundant bacterial and fungal genera throughout the phase were selected for correlation network mapping. Among the bacterial communities, Staphylococcus was the antagonistic centre of the bacteria and was negatively correlated with most of the other dominant genera, while Sphingomonas was the synergistic centre of the bacteria and was significantly positively correlated with the rest of the dominant genera except Staphylococcus. In the fungal community, Aspergillus showed the characteristics of an antagonistic centre, whereas Wallemia and Hannaella, although accounting for a smaller percentage of the abundance, still acted as synergistic centres for the fungi (Figure 13).
留言 (0)