
記住我

In recent years, the rapid advancement of nanotechnology has led to the widespread utilization of engineered nanostructured metal oxides (ENMOs) in various industrial and biomedical applications . Nanoparticles (NPs) are described by the International Organization for Standardization as structures characterized by one, two, or three dimensions within the range of 1 to 100 nm . The diminutive size of nanoparticles contributes to a significantly high surface area with respect to volume, resulting in enhanced reactivity, improved stability, and augmented functionality. In the field of nanomaterials, ENMOs are a notable subset. These nanoparticles consist of metal elements bonded with oxygen in intricate structures . They exhibit exceptional physicochemical properties, which have led to their widespread utilization across various industries . These nanomaterials are employed in, for example, electronics, cosmetics, and medicine because of their enhanced reactivity, large surface area, and tunable properties .
ENMOs can enter the human body and engage with various biomacromolecules, including sugars, lipids, proteins, and nucleic acids. These biomolecules rapidly envelop the nanoparticle surface, creating a dynamic “protein corona”, which dictates the biological characteristics of the nanoparticles . The composition of this corona is variable and relies on the concentrations and affinities of its different components to the nanoparticle surface. Cellular uptake of NPs happens through receptor-mediated active or passive transport across the cell membrane . Excessive absorption by normal cells enables metal oxide nanoparticles to engage with various subcellular organelles, initiating diverse signaling pathways to generate a stress response within cells. This results in the production of free radicals. Ultimately, this cascade leads to damage to cellular organelles and the demise of the cell . ENMOs have also been explored for potential diagnostic applications, particularly in targeting cancer cells . To create target-specific NPs, researchers synthesized magnetofluorescent NPs with an iron oxide nanocore decorated with organic compounds and investigated their cellular uptake across various human cell types . However, determining the cellular absorption of functionalized nanoparticles in different human cell types is a laborious, expensive, and time-consuming task. Computational analysis of experimentally obtained cellular uptake data for ENMOs provides a systematic approach to gain insights for modifying them for specific purposes. In recent times, these computational methods have gained popularity as they are more cost-effective and independent alternatives to experimental procedures .
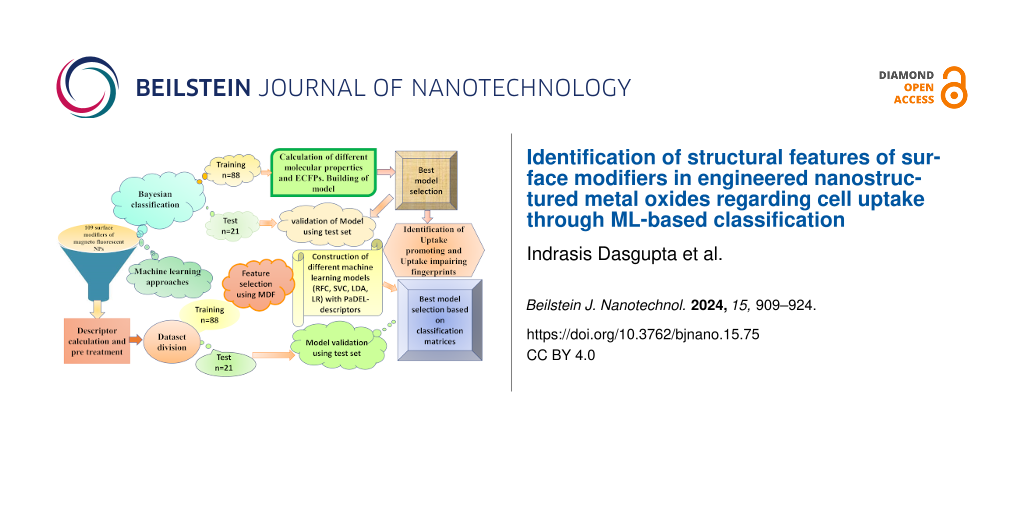
Understanding the structural features related to the surface modifiers of ENMOs that influence their uptake in human cell lines is crucial for designing nanomaterials with enhanced bioavailability. The surface modifiers are, in general, chemical groups or molecules that are attached to the surface of ENMOs to modify their properties and, specifically, the cellular uptake. A lot of computational studies (Table 1) have been reported using nanoscale quantitative structure–activity relationship (nano-QSAR) models (predominantly regression-based) that specifically employ the cellular uptake in the PaCa2 cell line . In the current study, we have performed a distinctive approach by developing nano-QSAR machine learning-based classification models that encompass not only the cellular uptake data of the PaCa2 cell line but also the two additional cell lines HUVEC and U937. The primary objective is to find the structural fingerprints/features that govern cellular uptake selectivity for each cell line. The selective surface modifications of ENMOs could enhance the affinity of the nanoparticles for certain cell types while reducing the uptake by non-target cells. This is particularly important for in vivo applications where non-specific uptake by the reticuloendothelial system (e.g., liver and spleen) can reduce the efficacy of the nanoparticles. The workflow of the current study is shown in Figure 1. The insights gained from this study hold significant implications for the rational design of ENMOs with tailored properties for biomedical applications, ensuring their higher efficiency.
Table 1: Comparison of statistical parameters of the present model with previous studies for the cellular uptake of ENMOs.
S. no. Cell line ntrain ntest Modela Statistical parametersb Ref Regression-based QSAR 1 PaCa2 87 22 — R2Te = 0.72; RMSETe = 0.18 2 PaCa2 90 19 MLR R2Tr = 0.934; RMSETr = 0.121; R2Te = 0.943; RMSETe = 0.214 3 HUVEC 87 21 BRANNLP & MLREM R2Tr = 0.55; RMSETr = 0.38; R2Te = 0.72; RMSETe = 0.30 PaCa2 R2Tr = 0.64; RMSETr = 0.26; R2Te = 0.62; RMSETe = 0.32 4 PaCa2 91 18 Monte Carlo regression R2Tr = 0.76; RMSETr =0.19; R2Te = 0.86; RMSETe = 0.14 5 PaCa2 87 22 MLR R2Tr = 0.945; RMSETr = 0.13; R2Te = 0.897; RMSETe = 0.18 6 PaCa2 89 20 PLS LV = 5; R2Tr = 0:806; Q2LOO = 0.758; RMSETr = 0.20; Q2F1 = R2Te = 0.879; Q2F2 = 0.868; RMSETe = 0.12 7 HUVEC 87 21 MLRaVarious models reported as follows: MLR = multiple linear regression; RMSEP = root mean square error of prediction; Conc. = concordance, RF = random forest; SVC = support vector classifier, LDA = linear discriminant analysis; DTB = decision tree boost; DTF = decision tree forest; PLS = partial least squares; BRANNLP = Bayesian regularization artificial neural network, using Gaussian priors, MLREM = multiple linear regression with expectation maximization; bdifferent statistical parameters reported as follows: R2 = correlation coefficient, ACC = accuracy, MCC = Matthews correlation coefficient; ROC = receiver operating characteristic; RMSE = root mean square error; Q2LOO = cross-validated correlation coefficient; LV = latent variables; Se = sensitivity; Sp = specificity.
![[2190-4286-15-75-1]](https://www.beilstein-journals.org/bjnano/content/figures/2190-4286-15-75-1.png?scale=2.0&max-width=1024&background=FFFFFF)
Figure 1: Workflow of the current study for cellular uptake of ENMOs involving different approaches such as Bayesian classification and machine learning. The similar training (n = 88) and test set (n = 21) were used in different analyses.
Materials and Methods Preparation of datasetsThe current study was performed employing the experimental cellular uptake data of 109 chemically attached surface modifiers of ENMOs (monocrystalline magnetic nanoparticles having overall size of 38 nm and an average of 60 ligands per nanoparticle, indicating a consistent level of attachment across different preparations) regarding human pancreatic ductal adenocarcinoma cells (PaCa2), human umbilical vein endothelial cells (HUVEC), and the human monocyte lymphoma cell line U937 . PaCa2 cells are derived from a human pancreatic tumor and are adherent and epithelial in nature, providing insights into the uptake and behavior of nanoparticles in pancreatic cancer. HUVEC cells are endothelial cells derived from the vein of the umbilical cord to study vascular biology and endothelial function. U937 is a human cell line used as a model for monocyte/macrophage differentiation. The cellular uptake was represented by log10[NP]/cell, in which the concentration was represented in picomoles per cell. In order to classify the higher-uptake (assigned as “1”) and lower-uptake (assigned as “0”) surface modifiers of ENMOs, the average values of log10[NP]/cell were considered as cut-off value (Supporting Information File 1, Table S1). Thus, 62 higher-uptake and 47 lower-uptake (in the case of PaCa2 cell line); 54 higher-uptake and 55 lower-uptake (in the case of HUVEC cell line), and 64 higher-uptake and 45 lower-uptake (in the case of U937 cell line) surface modifiers of ENMOs were included in the modelling. The whole dataset was divided based on the “Diverse molecule” method in Discovery studio 3.0 software into 88 modifiers in the training set (70%) and 21 modifiers in the test set (30%) for the different classification-based QSAR analyses.
Bayesian classification studyBayesian classification was carried out via the “Create Bayesian model” protocol in Discovery Studio 3.0 . To develop a model, various descriptors were collected, including molecular weight (MW), n-octanol/water partition coefficient (ALogP), number of aromatic rings (nAR), number of rings (nR), number of rotatable bonds (nBonds), number of hydrogen bond donors (nHBDs), and the number of hydrogen bond acceptors (nHBAs) . Extended-connectivity fingerprints (ECFPs) or functional-class fingerprints (FCFPs) were also used for the Bayesian analysis. ECFPs are circular fingerprints that capture precise substructural features of molecules, making them suitable for predicting molecular activity and similarity search . They are generated through an iterative process based on the Morgan algorithm, which assigns numeric identifiers to each atom in a molecule and updates these identifiers through several iterations. In contrast, FCFPs focus on capturing functional class information, reflecting the pharmacophore roles of atoms. Both ECFPs and FCFPs are highly customizable and have been widely adopted for various scientific applications . The molecules from the training set were used for constructing the model, and the molecules from the test set were used for the validation. The resulting model’s statistical properties were assessed using the fivefold cross-validation procedure. Additionally, the model’s quality was evaluated by looking at the receiver operating characteristic (ROC) plot as well as specificity, sensitivity, and accuracy values .
Development of other machine learning models Calculation of descriptors and data pre-treatmentThe training set of 88 and the test set of 21 surface modifiers from Bayesian classification analysis were used for the development of other machine learning models. Different classes of 2D descriptors were calculated using PaDEL-Descriptor . The data pre-treatment tool (Data Pre-TreatmentGUI 1.2 from DTC laboratory, Jadavpur University, available at http://teqip.jdvu.ac.in/QSAR_Tools/) removed some descriptors (intercorrelation cutoff > 0.90, variance cutoff < 0.0001) .
Feature selectionFinding the minimum number of significant features or variables in the descriptor form is a vital step in the interpretation of a ML model . In our current study, the most discriminating features selection method (MDF_Identifier-v1.0 accessible at https://sites.google.com/jadavpuruniversity.in/dtc-lab-software/home) was used to find out the minimum number of required features that are responsible for classifying higher-uptake and lower-uptake surface modifiers in the case of three cell lines . The descriptors that had greater values of absolute difference were taken as significant features for a particular cell line. For the study of the PaCa2 cell line, we selected ten descriptors (Supporting Information File 1, Table S2) that had an absolute difference value greater than or equal to 0.31. Similarly, for the study of HUVEC and U937 cell lines, we selected, respectively, eight (Supporting Information File 1, Table S3) and eleven descriptors (Supporting Information File 1, Table S4) that had an absolute difference greater than or equal to 0.39 and 0.19, respectively. The specific values were determined through empirical analysis, ensuring that the selected descriptors provide the best predictive performance for each cell line.
ML model development and analysisFour classification-based ML models, namely, random forest classifier (RFC), support vector classifier (SVC), linear discriminant analysis (LDA), and logistic regression (LR) were developed in the current analysis. These models were developed using the optimized hyper parameters in the Scikit Learn package. The ML models were built by utilizing the ML classifier tool (https://sites.google.com/jadavpuruniversity.in/dtc-lab-software/home/machine-learning-model-development-guis) . For applicability domain analysis, the leverages of the training and test set compounds were calculated. The applicability domain analysis was performed with the help of Hi_Calculator-v2.0, accessible at https://sites.google.com/jadavpuruniversity.in/dtc-lab-software/home .
Results and Discussion Bayesian classification study for the three cell lines PaCa2 cell lineInitially, a Bayesian classification study was carried out in order to build a classification-based QSAR model. The test set was developed with 21 molecules, whereas the training set was developed with 88 molecules. Figure 2A,B depict the ROC curves for the compounds in the training and test set of the surface modifiers of ENMOs in the PaCa2 cell line. Various statistical criteria, such as concordance, specificity, and sensitivity, were examined to characterize the model (Table 2). The developed Bayesian model has a fivefold cross-validated ROC of 0.765, indicating the model’s validity. The ROC for the test set is 0.891, indicating an acceptable external validation result. The training set’s statistical results are summarized in Table 2, showing a strong 98% sensitivity, 86.5% specificity, and 93.2% overall concordance.
![[2190-4286-15-75-2]](https://www.beilstein-journals.org/bjnano/content/figures/2190-4286-15-75-2.png?scale=2.0&max-width=1024&background=FFFFFF)
Figure 2: Receiver operating characteristic plots of the training set (A, C, E) and test set (B, D, F) for the Bayesian classification analysis in the case of PaCa2 cell line (A, B), HUVEC (C, D) and U937 (E, F) cell line.
Table 2: Validation parameters of the generated classification-based Bayesian model for different cell lines.
Cell line Set TPa FNb FPc TNd Sene Specf Concg ROCh PaCa2 training 50 1 5 32 0.980 0.865 0.932 0.765 test 11 0 2 8 1.000 0.800 0.905 0.891 HUVEC training 39 3 5 41 0.929 0.891 0.909 0.854 test 10 2 1 8 0.833 0.889 0.857 0.861 U937 training 52 0 14 22 1.000 0.611 0.841 0.682 test 6 6 4 5 0.500 0.556 0.524 0.565aTrue positive; bfalse negative; cfalse positive; dtrue negative; esensitivity; fspecificity; gconcordance; hreceiver operating characteristic.
Twenty uptake-promoting (UPp 1–UPp 20) and twenty uptake-impairing (UIp 1–UIp 20) structural features/fingerprints were generated by the Bayesian model of 109 surface modifiers. As seen in Figure 3, uptake-promoting and uptake-impairing fingerprints can be matched into fewer structural features/fingerprint groups, as explained below.
![[2190-4286-15-75-3]](https://www.beilstein-journals.org/bjnano/content/figures/2190-4286-15-75-3.png?scale=2.0&max-width=1024&background=FFFFFF)
Figure 3: Uptake-promoting (UPp 1–UPp 20) and uptake-impairing (UIp 1–UIp 20) fingerprints from the Bayesian study (PaCa2 cell line). Sc denotes the Bayesian score of the corresponding fingerprints.
A long aliphatic carbon chain of the surface modifiers in ENMOs is highly beneficial for improved uptake in the PaCa2 cell line as suggested by the fingerprints UPp 3, UPp 4, UPp 5, UPp 9, UPp 19, and UPp 20. For example, surface modifiers 68 and 73 have these essential fingerprints and exhibit higher uptake (Supporting Information File 1, Figure S1). The uptake of ENMOs with surface modifiers like 49 is also high because of the presence of long-chain aliphatic anhydride-like fingerprints such as in UPp 11, UPp 12, UPp 13, UPp 14, UPp 16, and UPp 18. The fingerprints UPp 2 and UPp 6 share the similarity of a dihydro-2H-pyran-2,6(3H)-dione structure. These fingerprints are seen in surface modifiers 18 and 28.
The uptake-impairing fingerprints UIp 12, UIp 15, UIp 16, and UIp 18 indicate the presence of aliphatic/cyclic alcohol-like structures in the surface modifiers, and a negative impact on cell uptake of ENMOs is shown in the case of surface modifier 59. Similarly, fingerprints UIp 2, UIp 3, UIp 6, UIp 8, UIp 13, and UIp 19 represent the presence of amino groups with a possible carboxyl functionality. Such fingerprints are observed in surface modifier 101. The fingerprints UIp 9, UIp 11, UIp 14, and UIp 20, having a cyclohexane ring (e.g., 90), also reduce the uptake of ENMOs in the PaCa2 cell line.
HUVEC cell lineIn the case of the HUVEC cell line, the fivefold cross-validated ROC values for the training set and test set are 0.854 and 0.861, respectively. The ROC plots (Figure 2C,D) have been generated to justify the internal and external predictability of the model. The statistical factors sensitivity, specificity, and concordance are reported in Table 2. The presence of the aliphatic anhydride-like fingerprints UPh 9, UPh 10, UPh 17, and UPh 18 (Figure 4) in the surface modifiers promotes uptake in the HUVEC cell line (Supporting Information File 1, Figure S3). As discussed previously, similar fingerprints are also important for the uptake in the case of the PaCa2 cell line. Furthermore, fingerprints like UPh 13, UPh 14 and UPh 16, having ester functionality, are also responsible for a higher uptake of ENMOs in the HUVEC cell line. Fingerprints having a dihydrofuran-2,5-dione scaffold (UPh 3, UPh 4, UPh 8, and UPh 20) in the surface modifiers are important for the higher uptake of ENMOs in the HUVEC cell line, too. This is shown in the case of surface modifier 30 (Figure S3, Supporting Information File 1). The presence of fingerprints like UPh 1, UPh 5, and UPh 7 are also important for the uptake of ENMOs in the HUVEC cell line as shown in the case of surface modifier 46.
![[2190-4286-15-75-4]](https://www.beilstein-journals.org/bjnano/content/figures/2190-4286-15-75-4.png?scale=2.0&max-width=1024&background=FFFFFF)
Figure 4: Uptake-promoting (UPh 1–UPh 20) and uptake-impairing (UIh 1–UIh 20) fingerprints from the Bayesian study (HUVEC cell line). Sc denotes the Bayesian score of the corresponding fingerprints.
However, fingerprints containing aliphatic amino functionality (UIh 1, UIh 2, UIh 7, UIh 8, UIh 9, and UIh 11) have a deleterious effect on the uptake of ENMOs in the HUVEC cell line, as demonstrated in in the case of surface modifier 74 (Supporting Information File 1, Figure S4). The fingerprints UIh 5, UIh 10, UIh 13, UIh 15, and UIh 18 with a branched aliphatic structure have a negative impact on the uptake of ENMOs. As discussed previously in the case of the PaCa2 cell line, aliphatic alcohol-related fingerprints, such as UIh 12 and UIh 17, also impair uptake in the HUVEC cell line. Other fingerprints responsible for impairing uptake in the HUVEC cell line include UIh 3, UIh 6, and UIh 14. These fingerprints suggest uptake impairment of ENMOs by the presence of a carboxyl group with or without amino functionality in the surface modifiers as shown in Figure S4 (Supporting Information File 1).
U937 cell lineThe ROC curves for the U937 cell line are shown in Figure 2E,F for training and test set separately, and the statistical parameters for the model are shown in Table 2. The training set has sensitivity = 1.000, specificity = 0.611, and concordance = 0.841. The test set has sensitivity = 0.841, specificity = 0.556, and concordance = 0.524. The statistical quality of the Bayesian classification model for the U937 cell line is inferior compared to the models for the other cell lines. The training and test sets have also shown lower ROC scores of 0.682 and 0.565, respectively.
For U937, the Bayesian model also yielded 20 favorable fingerprints (UPu 1–UPu 20) and 20 unfavorable fingerprints (UIu 1–UIu 20) using ECFP_6 fingerprint descriptors, as shown in Figure 5. The fragments UPu 8–UPu 10 highlight the significance of the long aliphatic chain for the increased uptake of ENMOs as shown in the case of surface modifier 68. The fingerprints having anhydride functionality, for example, UPu 3, UPu 11, UPu 13, and UPu 14, are important for the uptake of ENMOs in the case of the U937 cell line (surface modifier 49 in Supporting Information File 1, Figure S5). The presence of dihydrofuran-2,5-dione scaffold-like structures in fingerprints including UPu 4, UPu 7, and UPu 15 is also important for the uptake of ENMOs in the U937 cell line (surface modifier 54 in in Supporting Information File 1, Figure S5). A similar feature is found to be important also in the case of the HUVEC cell line as discussed previously. Other fingerprints promoting uptake in the U937 cell line (UPu 5, UPu 16, and UPu 20) have an ester functionality (Supporting Information File 1, Figure S5). The higher uptake of ENMOs with surface modifier 86 is due to the presence of fingerprints UPu 12 and UPu 18.
![[2190-4286-15-75-5]](https://www.beilstein-journals.org/bjnano/content/figures/2190-4286-15-75-5.png?scale=2.0&max-width=1024&background=FFFFFF)
Figure 5: Uptake-promoting (UPu 1–UPu 20) and uptake-impairing (UIu 1–UIu 20) fingerprints from the Bayesian study (U937 cell line). Sc denotes the Bayesian score of the corresponding fingerprints.
The uptake-impairing fingerprints UIu 1, UIu 4, UIu 11, UIu 12, and UIu 14 indicate the presence of aliphatic alcohol functionality. The presence of primary or secondary amino groups (UIu 2, UIu 5, UIu 8, UIu 9, UIu 10, and UIu 16) also has a negative impact on the uptake of ENMOs in the U937 cell line as illustrated in the case of surface modifier 22 (Supporting Information File 1, Figure S6).
Other machine learning modelsOther classification-based machine learni
留言 (0)