Baseline features
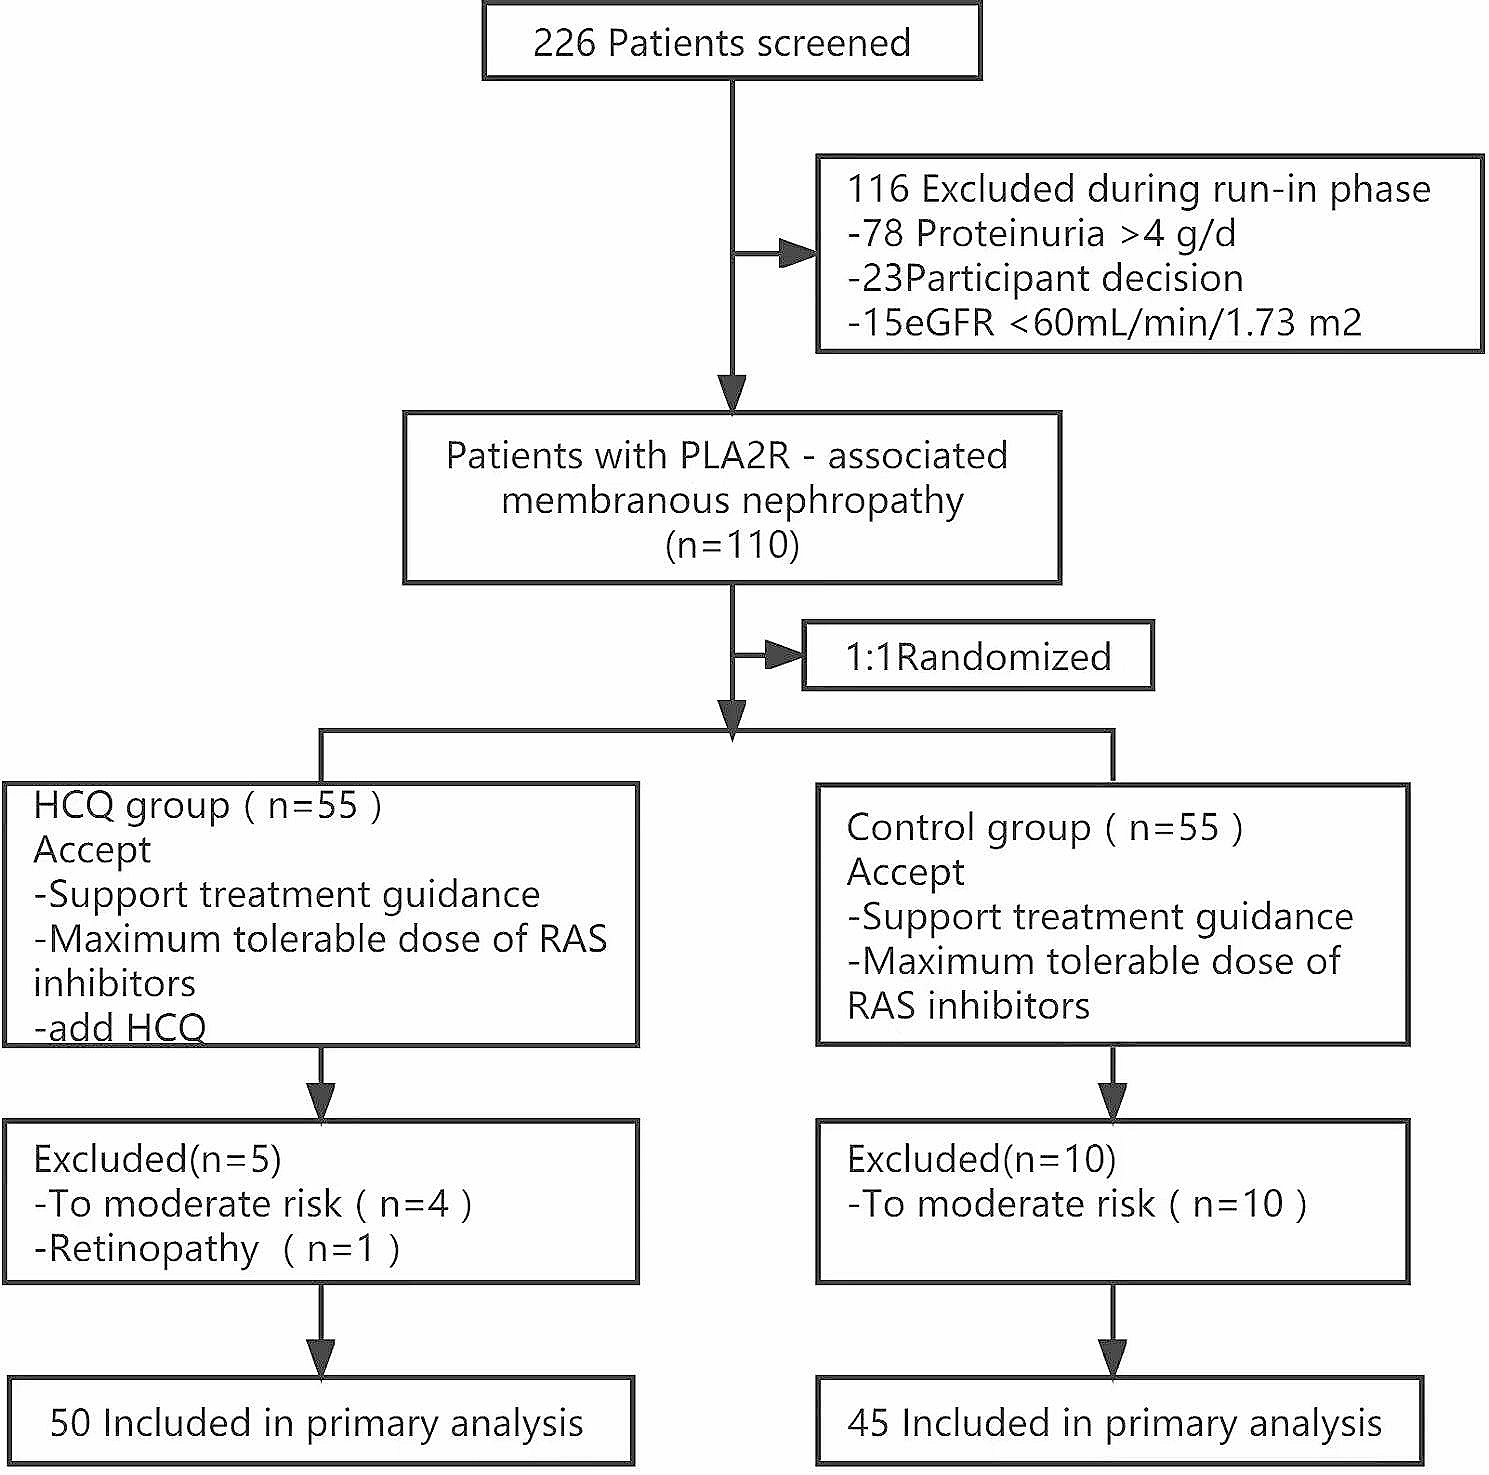
A total of 110 PLA2R-associated MN patients who met the inclusion criteria were selected from October 2019 to October 2021 and categorized randomly into the HCQ treatment group and the control group. 5 patients in the treatment group and 10 patients in the control group withdrew from the study respectively. In the HCQ treatment group, 4 patients withdrew due to progression to moderate risk, and 1 patient withdrew due to retinal toxicity. In the control group, 10 patients withdrew due to progression to moderate risk (Fig. 1). No significant differences were observed in the baseline clinical features between the two groups (p > 0.05) (Table 1).
Table 1 Baseline features of the two groups of patientsMaximum tolerable RASIs
We separately counted the number of patients in the control group and the HCQ group who exceeded the maximum recommended dose of RASIs according to the product label and those who did not reach the maximum recommended dose. Statistical analysis was conducted. The results showed that in the control group, 10 patients (22.2%) exceeded the maximum recommended dose of RASIs, and 4 patients (8.9%) did not reach the maximum recommended dose. In the HCQ group, 12 patients (24%) exceeded the maximum recommended dose of RASIs, and 4 patients (8%) did not reach the maximum recommended dose. There was no statistically significant difference between the two groups in the use of the maximum tolerated dose of RAS inhibitors (Table 2).
Table 2 Primary and secondary endpointsPrimary endpoints: percentage change in 24-hour urine protein excretion
The 24-hour urine protein excretion was roughly similar at baseline in the HCQ treatment group and the control group, with no statistical difference observed (p = 0.9198). Both groups of patients showed a decrease in proteinuria, with the treatment group showed a more significant decrease. At the 6th month of follow-up, both groups of patients had a decrease in proteinuria compared to baseline (1.75 g vs. 2.67 g) (Table 2). At the 3rd month of follow-up, excretion had declined relative to baseline levels in both groups (25.9% vs. 9.4%), with the difference being similar but not statistically significant (p = 0.0779). At the 6th month of follow-up, the HCQ treatment group showed a more notable reduction in 24-hour urine protein excretion than that in the control group (50.2% vs. 28.2%), with this difference being statistically significant (p = 0.0034) (Table 2).
Secondary endpointsPercentage Change in PLA2R antibody titers
The PLA2R antibody titers were similar at baseline between the HCQ treatment group and the control group, with no statistically significant differences. (p = 0.4657). At the 3rd month of follow-up, the HCQ treatment group showed statistically significant lower PLA2R antibody titers compared with those in the control group (-21.9% vs.-1.0%; p = 0.0203). At the 6th month of follow-up, the difference in the change of PLA2R antibody titers was also statistically significant between the HCQ treatment and control group (-50.0% vs. -25.0%, p = 0.00092) (Table 2).
Change in eGFR
There was no statistically significant difference in eGFR at baseline between the HCQ treatment group and the control group (p = 0.4753). The eGFR of both groups of patients remained stable during follow-up. At the 3rd and 6th months of follow-up, the change in eGFR was also not significantly different between the two groups (p = 0.4952, 0.7971) (Table 2).
Change in serum albumin levels
Serum albumin levels showed no significant difference at baseline between the HCQ treatment group and the control group (p = 0.6359). At the 3rd month of follow-up, the HCQ treatment group had no noticeable increase in serum albumin level than that observed in the control group (8.5% vs. 8.4%). At the 6th month of follow-up, the increase in albumin level was significantly greater in the HCQ treatment group than that of the control group (15.4% vs. 11.0%, p = 0.0001) (Table 2).
Comparison of treatment responses at 6 months
At the 6th month of follow-up, there were 15 cases in the HCQ treatment group where PLA2R antibody titers decreased by more than 50%, which was higher than the control group (7 cases). This difference was not statistically significant (p = 0.0956). At the 6th month of follow-up, the number of patients with a > 50% decline in 24-hour urine protein excretion was 26 cases in the HCQ treatment group and 12 cases in the control group, with this difference being statistically significant (p = 0.0118) (Table 3).
Table 3 Comparison of the number of patients with reductions of more than 50% in PLA2R antibody titers and 24-hour urine protein excretion at the 6th month of follow-up between the two groupsNumber of patients with conversion to moderate-to-high risk
After the completion of the 6-month follow-up, 5 patients in the HCQ treatment group withdrew from the study, including 4 patients with conversion to moderate-to-high risk due to an increase in urine protein excretion of > 50% relative to baseline level and greater than 6 g/24 h. In the control group, 10 patients with conversion to moderate-to-high risk withdrew from the study, including 3 patients with an increase in serum creatinine level of > 30% relative to baseline level, and 7 patients with an increase in urine protein excretion of > 50% relative to baseline and greater than 6 g/24 h. Therefore, the probability of conversion from low risk to moderate-to-high risk was smaller in the HCQ treatment group than in the control group (4 vs. 10), close but not statistically significant (p = 0.086) (Table 4).
Table 4 Comparison of the number of patients with conversion to moderate-to-high risk between the two groupsIndependent predictors analysis
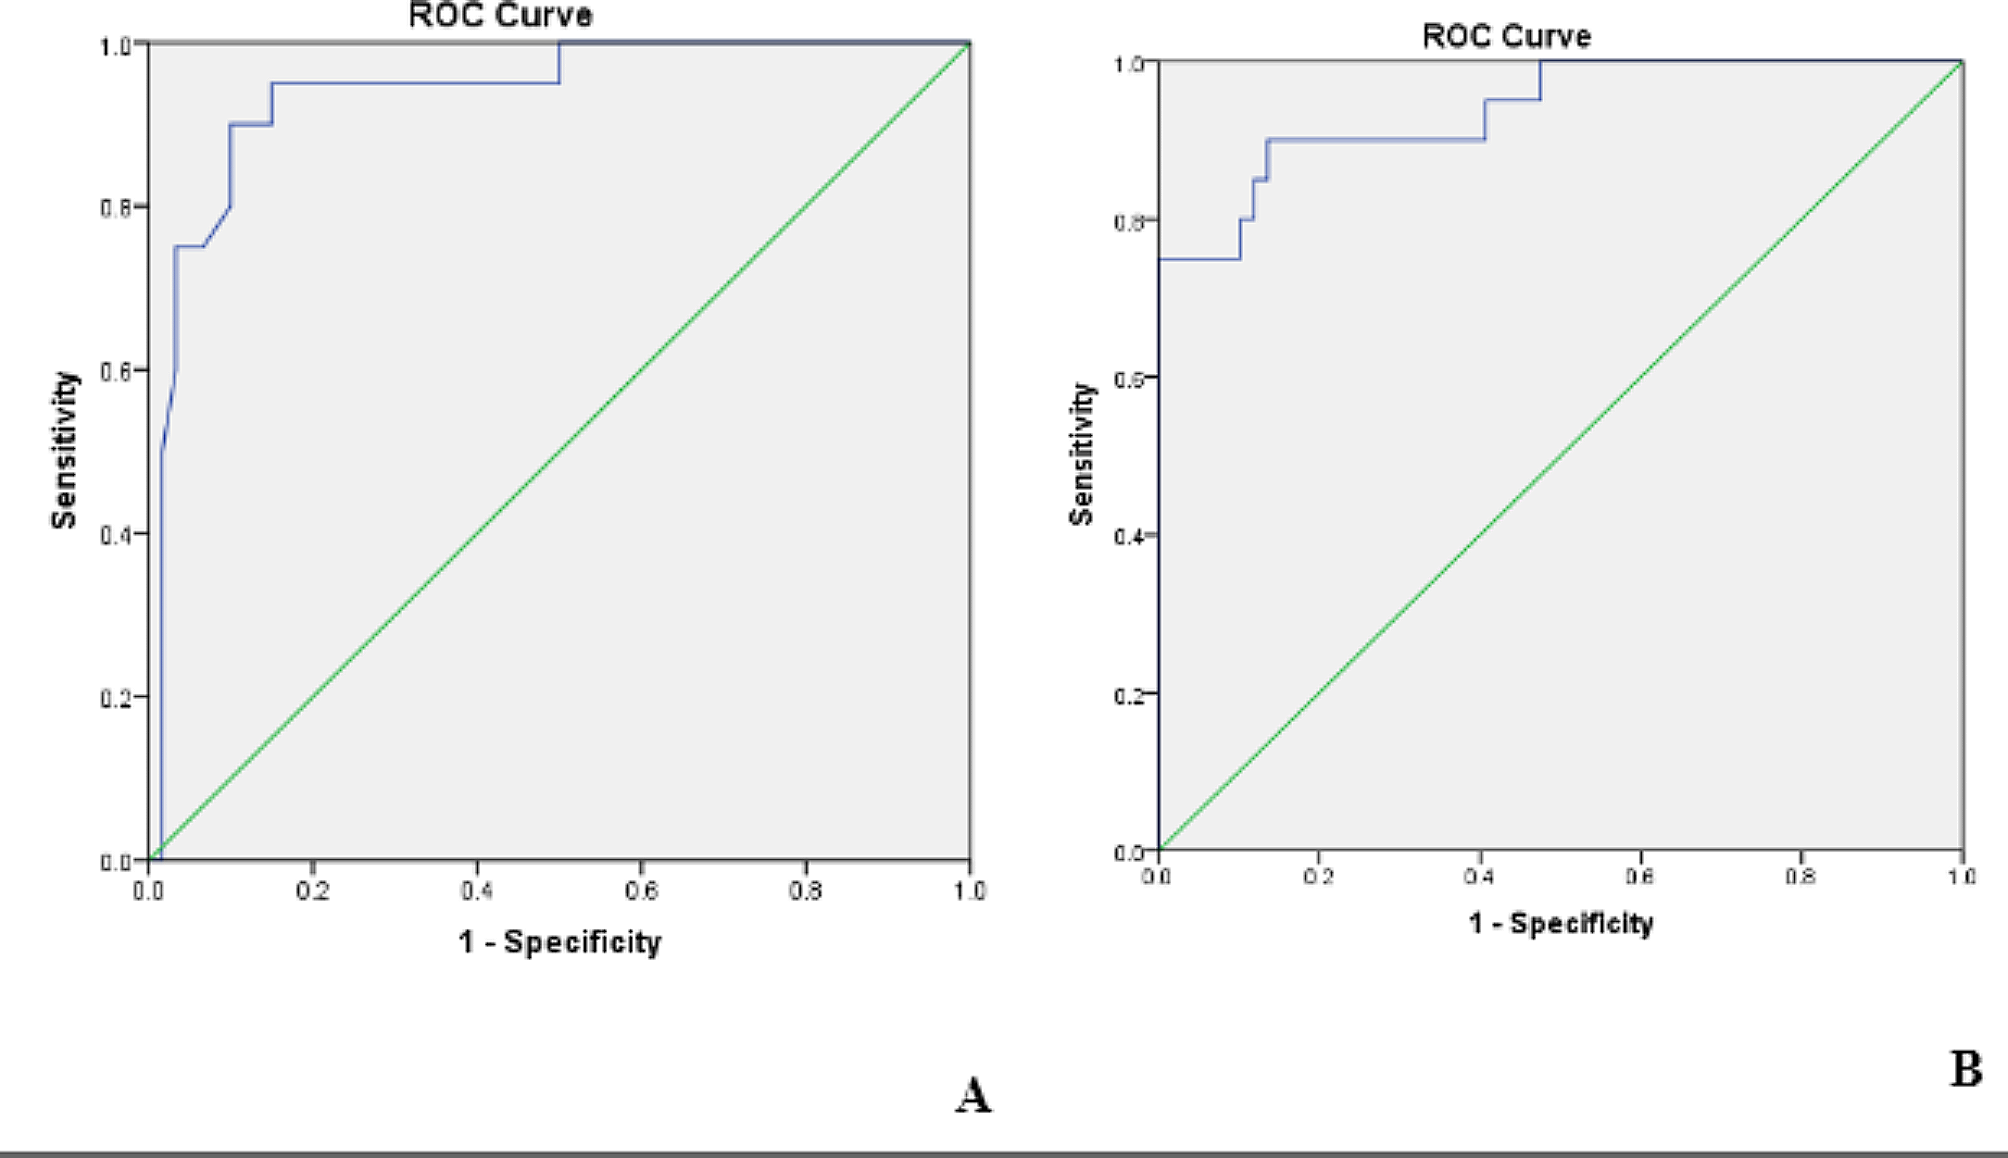
We used univariate and multivariate logistic regression to analyze independent predictors affecting the reduction rate of effective albuminuria (by at least 50%). The results showed that in univariate analysis, HCQ was the only independent predictor of reduction in proteinuria by > 50%, see Table 5.
Table 5 Independent predictors of reduction in proteinuria by > 50%univariate and multivariate logistic regression analysisAdverse reactions
The difference in adverse reactions was not significantly different between the two groups, with no severe adverse reactions occurring in either group (Table 6). In the HCQ treatment group, one patient who presented with blurred vision withdrew from the study due to suspected HCQ-related retinal toxicity. No significant changes in QT intervals were observed in either the treatment HCQ group or the control group during the study period. In addition, there were 3 patients with skin pruritus, 2 patients with nausea, hepatic dysfunction, skin rashes and palpitation, and 1 patient with abdominal pain and dizziness, all of which were relieved after symptomatic treatment. In the control group, 2 patients had nausea, skin pruritus, and skin rashes and 1 patient each had either hepatic dysfunction, abdominal pain, palpitation, or dizziness. The evaluation in combination with six months of medication indicated that the safety of drugs was good in the two groups.
Table 6 Adverse reactions in the two groups 

留言 (0)