
記住我
In the 500 MSA cases, we identified a total of 13 variants including eight missense (p.I20V, p.R202Q, p.R301H, p.S310G, p.V334I, p.L483P, p.A495P, and p.I528V) variants, two synonymous (p.V499V and p.K505K) variants, and three variants including a splicing variant (c.115+1G>A) and two indels (p.H313del and c.del1447_1466insTG) by either short-read or Sanger sequence analysis (Supplementary Table 1). Notably, inconsistencies in variant calling between the Sanger and the short-read sequence analyses were observed in variant calls for the five variants (p.A495P–p.V499V and c.115+1G>A were called only by short-read sequence analysis, whereas p.H313del, p.L483P and c.del1447_1466insTG were called only by Sanger sequence analysis) (Table 1).
Table 1 Variants in GBA1 with inconsistencies among the Sanger, short-read, and long-read sequence analysesMisalignment attributable to rare variants registered in GBA1LP of the reference genome (GRCh38)Case 1: p.L483P was detected by Sanger sequence analysis, but undetected by short-read sequence analysis with alignment to GRCh38Chr1:155,233,639 – chr1:155,235,252 containing exons 10–11 of GBA1 and adjacent MTX1LP have an extraordinarily high sequence homology with the corresponding GBA1LP and MTX1 regions located in the vicinity of GBA1 on chromosome 1. In GBA1LP, GRCh38 registers a minor allele C with an allele frequency (AF) of 0.0017 instead of a major allele G at chr1:155,214,576, a minor allele C with an AF of 0.0107 instead of a major allele G at chr1:155,214,590, a minor allele C with an AF of 0.0108 instead of a major allele T at chr1:155,214,276, and a minor allele A with an AF of 0.213 instead of a major allele G at chr1:155,214,266 (Fig. 1). In contrast, GRCh37 registers major alleles at these four positions in GBA1LP. When the short reads were aligned to GRCh38, the reads containing C–C–G completely matched with the reference at chr1:155,214,576, chr1:155,214,590, and chr1:155,214,625 in GBA1LP, while the reads showed a mismatch at chr1:155,235,252 in GBA1. Consequently, p.L483P was not called a variant in GBA1 by the short-read sequence analysis (Fig. 2A). When the reads were aligned to GRCh37, the reads containing C–C–G showed two mismatches at chr1:155,184,367 and chr1:155,184,381 in GBA1LP, whereas the reads showed only one mismatch at chr1:155,205,043 in GBA1, resulting in correct alignment of all the short reads containing A at chr1: 155,205,043 (GRCh37) to the GBA1 locus. Consequently, p.L483P was called a variant in GBA1.
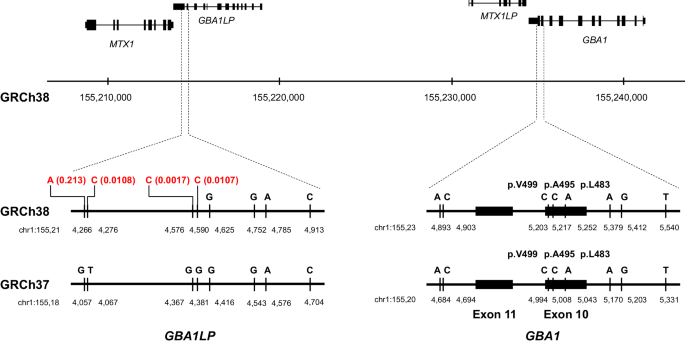
Fig. 1
Physical map of GBA1, GBA1LP, MTX1, and MTX1LP. The positions of the major alleles different between GBA1 and GBA1LP are shown. Allele frequencies from the Japanese population (8.3KJPN) are displayed in red at the positions on GBA1LP (GRCh38) where the minor alleles, identical to the major alleles in GBA1, are registered. In GRCh37, the major alleles are registered at the corresponding positions
Fig. 2
Misalignment of short reads attributable to rare variants registered in GBA1LP of the reference genome (GRCh38) in cases 1 and 2. Short-read alignments to GBA1 and GBA1LP in each case are displayed using IGV (with the mapping quality threshold = 20). The tables below the images of IGV show the allele depths retrieved from VCF files at the base positions on chromosome 1 of the reference genomes used for alignment. Note that the number of read bars shown in the IGV based on BAM files does not necessarily completely match with the read depths retrieved from the VCF. A Case 1 No variants were called by short-read sequence analysis, whereas p.L483P was detected by Sanger sequence analysis. When the short reads were aligned to GRCh38, the reads with C–C–G showed a complete match at chr1:155,214,576, chr1:155,214,590, and chr1:155,214,625 in GBA1LP, whereas the reads showed a mismatch at chr1:155,235,252 in GBA1. Consequently, p.L483P was not called a variant in GBA1. When the reads were aligned to GRCh37, the reads containing C–C–G showed two mismatches at chr1:155,184,367 and chr1:155,184,381 in GBA1LP. Consequently, p.L483P is called a variant in GBA1. B Case 2 p.A495P and p.V499V were called by short-read sequence analysis, whereas no variants were detected by Sanger sequence analysis. When the short reads were aligned to GRCh38, the reads with G–G–A showed two matches at chr1:155,235,203 and chr1:155,235,217 in GBA1, and the reads showed three mismatches at chr1:155,214,576, chr1:155,214,590, and chr1:155,214,625 in GBA1LP, resulting in alignment of the reads containing G–G–A to both GBA1 and GBA1LP. Consequently, p.A495P and p.V499V were called variants in GBA1. When the reads were aligned to GRCh37, the reads containing G–G–A had two mismatches to the reference genome of GBA1 at chr1:155,235,203 and chr1:155,235,217, whereas they had only one mismatch to the reference genome of GBA1LP at chr1: 155,184,416, and all the reads were correctly aligned to the GBA1LP sequences. As a result, neither p.A495P nor p.V499V was called at GBA1
Given the above results, we reanalyzed the variant calling of the other two cases with p.L483P in detail (Cases 5 and 6). In Cases 5 and 6, p.L483P was identified by Sanger sequence analysis as well as by short-read sequence analysis even with alignment to GRCh38. However, the allele depths in the VCF files obtained from alignment to GRCh38 were 13 and 4 (ref/alt) in Case 5, and 15 and 3 (ref/alt) in Case 6, indicating markedly biased allele balances, and reduced reliability in the variant calling. When a filtering option was set based on allele balance or read depth, p.L483P may well be missed in variant calling. In contrast, mapping to GRCh37 resulted in more reliable variant calling, with allele depths of 13 and 15 (ref/alt) and 16 and 7 (ref/alt) in Case 5 and Case 6, respectively.
Case 2: p.A495P and p.V499V were called by short-read sequence analysis with alignment to GRCh38, whereas the variants were not detected by Sanger sequence analysisSimilar to Case 1, due to the minor alleles registered in the GBA1LP in the reference genome (GRCh38), a misalignment of reads was observed. When the reads were aligned to GRCh38, the reads containing G–G–A showed two mismatches at chr1:155,235,203 and chr1:155,235,217 in GBA1, and the reads showed three mismatches at chr1:155,214,576, chr1:155,214,590, and chr1:155,214,625 in GBA1LP (Fig. 2B). Thus, the short-read sequence analysis employing GRCh38 as the reference genome could not unequivocally determine whether the reads containing G–G–A are derived from GBA1 or GBA1LP. Indeed, while the majority of the short reads containing G–G–A were aligned to GBA1LP, a limited number of short reads containing G–G–A were aligned to GBA1. Consequently, p.A495P and p.V499V were called by short-read sequence analysis with alignment to GRCh38. When the reads were aligned to GRCh37 (major alleles are registered in GBA1LP at the four positions), the reads containing G–G–A showed two mismatches to the reference genome of GBA1 at chr1:155,235,203 and chr1:155,235,217, whereas they showed only one mismatch to the reference genome of GBA1LP. As a result, reads containing G–G–A were fully aligned to the GBA1LP locus, and the p.A495P and p.V499V variants were not called in GBA1.
Case 3: c.del1447_1466insTG was detected by Sanger sequence analysis, but not called by short-read sequence analysis with alignment to GRCh38Similar to Cases 1 and 2, the registration of four minor alleles in GBA1LP in GRCh38 increases the homology between GBA1 and GBA1LP, leading to fewer reads being specifically aligned to GBA1. Consequently, c.del1447_1466insTG was not called by short-read sequence analysis with alignment to GRCh38. When a read does not contain a GBA1-specific variant, it could be aligned to either GBA1 or GBA1LP, leading to a MAPQ value of 0. As a result, there are only three reads with a MAPQ > 20 (Supplementary Fig. 1), and the variant was missed through the variant calling process. Conversely, when the reads were aligned to GRCh37, which registers major alleles in GBA1LP, it became easier to align the reads specifically to GBA1. Consequently, there are twelve reads with a MAPQ > 20, and the variants were accurately called employing GRCh37 as the reference genome through the variant calling process.
Misalignment attributable to a structural variant involving GBA1/GBA1LP Case 4: c.115+1G>A was called by short-read sequence analysis, while p.H313del was called by Sanger sequence analysisWhen the read depth data of the short-read sequence analysis were analyzed, we noticed that the read depths in the part of the GBA1 region were increased to about 1.5, whereas those in the GBA1LP region were decreased to about 0.5, raising the possibility that the copy numbers of GBA1 and GBA1LP regions are three and one, respectively (Fig. 3A). Of note, long-read sequence analysis revealed that the long-reads 1 and 2 indeed contained a chimeric structure containing the GBA1LP–MTX1 and the GBA1 regions. The long-reads 3 and 4 contained a chimeric structure containing the GBA1LP–MTX1 and the GBA1–MTX1LP regions (Fig. 3B). Based on these results, we concluded that a gene conversion event occurred in the GBA1LP–MTX1 region due to the extraordinarily high homology between the GBA1–MTX1LP and GBA1LP–MTX1 regions. The region spanning the intron 2 of GBA1LP and the intron 5 of MTX1 (NC_00001.11:g.155213012_155218391 indicated by a box in Fig. 3B) was replaced by the region spanning the intron 2 of GBA1 and the intron 5 of MTX1LP (NC_00001.11:g.155233640_155240628). Of note, there is a deletion of CAC in this region (NC_00001.11:g.155237401_155237403del). Taken together with these observations, the complex structural variant is described as NC_00001.11:g.155213012_155218391delins[NC_00001.11:g.155233640_155237400; NC_00001.11:g.155237404_155240628] according to the guidelines of the Human Genome Variation Society (https://www.hgvs.org/content/guidelines). Consistent with the above interpretation, one of the paired-end reads spanning the breakpoint between GBA1 (upstream) and GBA1LP (downstream) contained GBA1-specific sequences derived from GBA1. On the other hand, the other reads contained sequences derived from GBA1LP, whose sequences are identical to that of GBA1 except for a mismatched base corresponding to c.115+1G>A in GBA1. Consequently, the reads were aligned to GBA1 resulting in the miscalling of c.115+1G>A in GBA1 (Fig. 3C). Regarding the p.H313del, which was called only by Sanger sequence analysis as the variant in GBA1, it was found to be a variant located in the structural variant involving GBA1LP as determined by the long-read sequence analysis (Fig. 3B). Thus, both Sanger sequence and short-read sequence analyses failed to correctly call the variants.
Fig. 3
Structural variant involving the region spanning intron 2 of GBA1LP and intron 5 of MTX1. A The read depth ratios of the short reads aligned to GBA1, GBA1LP, MTX1. and MTX1LP of Case 4 were calculated as the ratio to the average read depth of the five control subjects, and plotted with chromosomal positions. The depth ratio in the GBA1 region was increased to about 1.5, while that in the GBA1LP region was decreased to about 0.5, raising the possibility that the copy numbers of GBA1 and GBA1LP are three and one, respectively. B Physical maps of the GBA1–GBA1LP locus in the reference genome and the structural variant derived from gene conversion involving the GBA1LP–MTX1 locus in Case 4 are shown. The region spanning intron 2 of GBA1LP (ENST00000689630.1) and intron 5 of MTX1 was replaced by the region spanning intron 2 of GBA1 and intron 5 of MTX1LP with a deletion of CAC (c.937_939del) in this region (NC_00001.11:g.155237400_155237404), which was clearly demonstrated by the four long-reads 1–4. C Across the breakpoint of GBA1 and GBA1LP of the complex structural variant, there are several sets of paired-end reads that were preferentially aligned to GBA1 because one of the paired-end reads contains an increased number of bases specific to the GBA1 reference sequence than those specific to GBA1LP. Consequently, c.115+1G>A was miscalled at GBA1 by the short-read sequence analysis. The regions with nucleotide sequences identical between GBA1 and GBA1LP are shown in gray. The regions with nucleotide sequences specific to GBA1 are shown in blue, whereas those specific to GBA1LP are shown in red
Variants pathogenic for Gaucher disease identified in MSA casesPathogenic variants for Gaucher disease identified in the MSA cases include p.S310G, p.L483P, and c.del1447_1466insTG (Table 2). Of the 499 MSA cases, three were heterozygous for p.L483P (AF: 0.003), one was heterozygous for c.del1447_1466insTG (AF: 0.001), and one was heterozygous for p.S310G (AF: 0.001) (Supplementary Table 1). In summary, five of the 499 (AF: 0.005) MSA cases were carriers of GBA1 variants pathogenic for Gaucher disease. The demographic features of the five MSA patients with the GBA1 variants are described in Supplementary Table 2. The ages at onset of the five patients ranged from 43 to 73 with the mean age at onset (standard deviation) of 58.6 (9.6), which was not significantly different from those of non-carriers. The clinical phenotypes of these five patients included three MSA-C and two MSA-P patients. Four patients were classified as probable MSA, while one was classified as possible MSA. The combined allele frequency of all the pathogenic variants in the MSA cases was higher than those described in the previous report [10], which, however, did not reach statistical significance. Of note, the allele frequency of p.L483P (0.003) in the MSA cases in this study was comparable to that (0.0035) described in the previous report and higher than that (0.0011) in control samples, which, however, did not reach a statistical significance, either (Table 2). We then conducted a meta-analysis of p.L483P combining the results of the current study (3/998 alleles for the disease group vs 20/17,554 alleles derived from the control group) and those of our previous study (4/1148 alleles for the disease group vs 2/1800 alleles for the control group) [10]. Since between-study variability was not observed (I2 = 0%, τ2 = 0, p = 0.83), the common effects model was employed for the meta-analysis, which demonstrated the odds ratio of 2.92 (95% CI; 1.08 – 7.90, p = 0.0353), indicating that the allele frequency of p.L483P is significantly higher in MSA than in control samples in the Japanese population (Fig. 4)
Table 2 Variants pathogenic for Gaucher disease in MSA cases and controlsFig. 4
Forest plot showing the results of the meta-analysis of the association of p.L483P with MSA. The forest plot shows the results of the meta-analysis of the association of p.L483P with MSA combining the current study and the previous report [10]. Squares and horizontal lines represent estimated ORs and 95% CIs for individual series. The size of each square represents the statistical weight, the mean of the effect sizes using the inverse variance of the individual studies. Diamonds show the overall effects with 95% CIs. Since between-study variability was not observed (I2 = 0%, τ2 = 0, p =0.83), the common effects model was employed for the meta-analysis, which demonstrated the odds ratio of 2.92 (95% CI; 1.08 – 7.90, p = 0.0353), indicating that the allele frequency of p.L483P is significantly higher in MSA than in control samples in the Japanese population
留言 (0)