
記住我

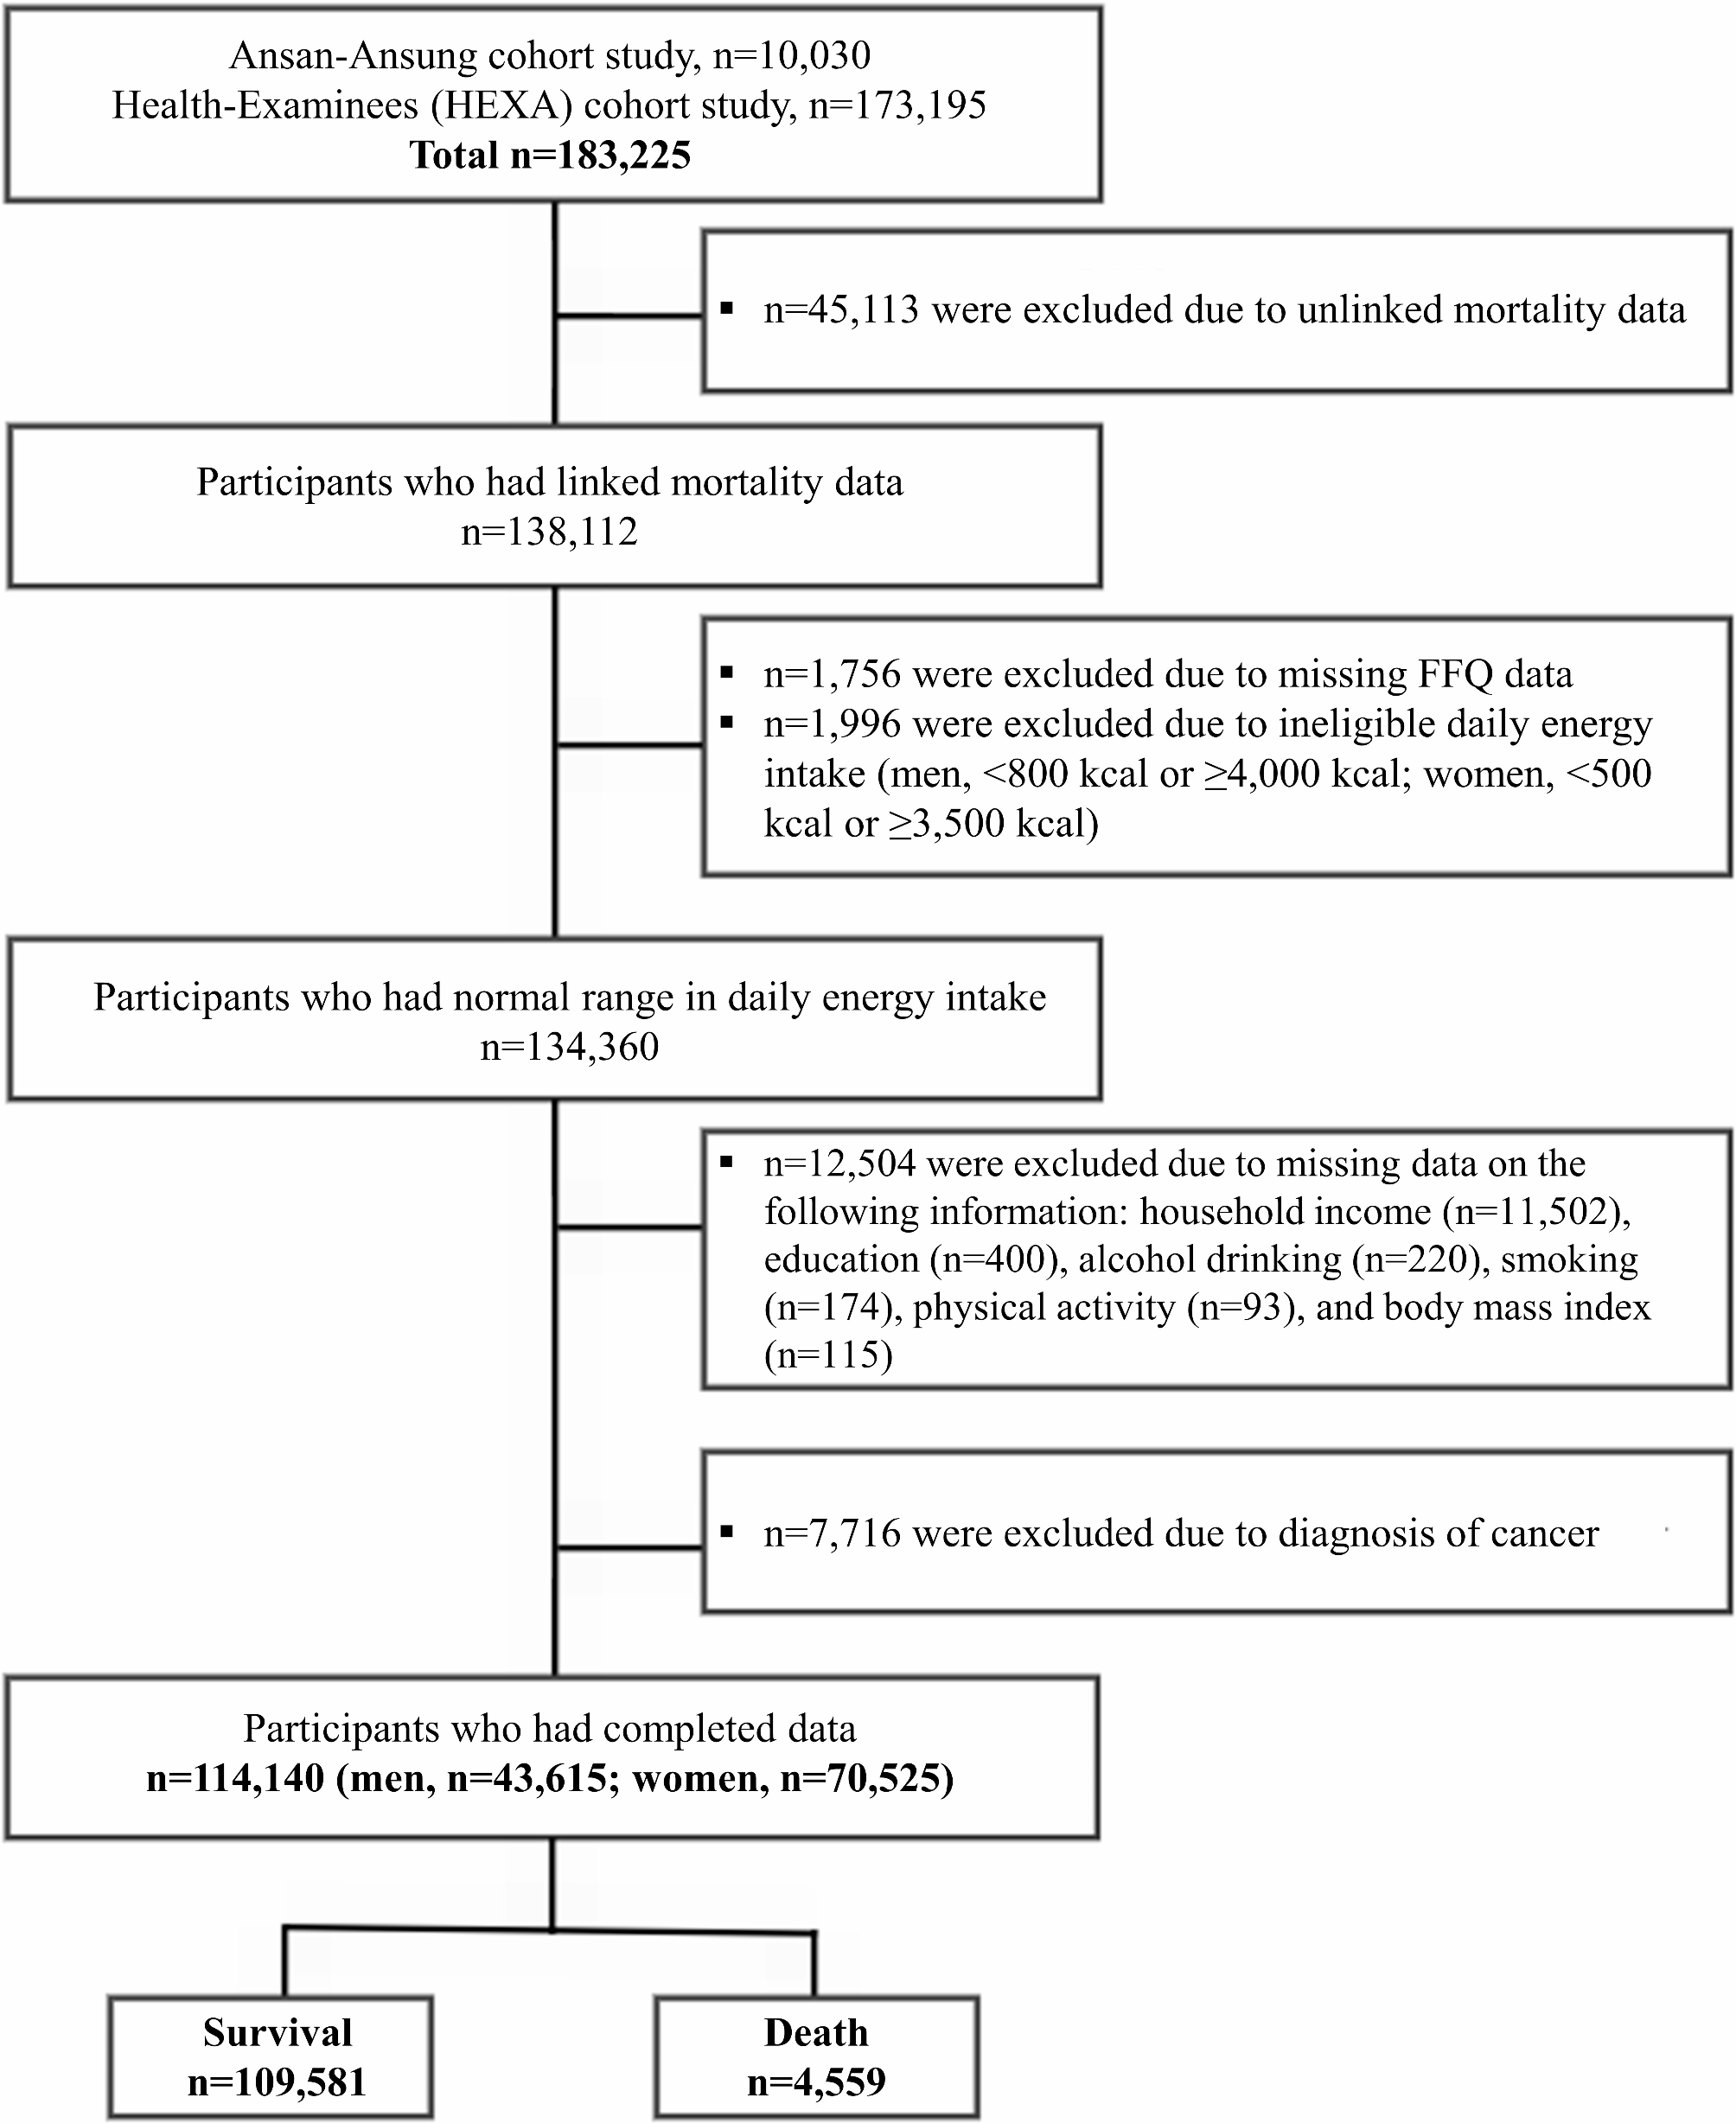


This retrospective study was performed in two teaching hospitals, and both were affiliated to School of Medicine, Shanghai Jiao Tong University in Shanghai, China. All the adult inpatients who were admitted to Ren Ji Hospital from January 1, 2018, to October 31, 2022, or to Xin Hua Hospital from January 1, 2020, to December 31, 2022, and with the availability of serum level of phosphate with 48 h after admission, were included. A total number of 35,428 adult patients were initially recruited. We then performed a sequential process of recruitment: excluding those without information on age (n = 8), height (n = 4,278), body weight (n = 189), LOS (n = 139), or estimated glomerular filtration rate (calculated by Chronic Kidney Disease Epidemiology Collaboration equation, eGFR-EPI) (n = 180), those who were older than 100 years or younger than 18 years (n = 15), those whose LOS < 2 days (n = 4,279), or those whose eGFR-EPI < = 30 ml/min/1.73m2 (n = 2,730), or with the history of end-stage of renal disease according to admission diagnosis (n = 131). Finally, a total number of 23,479 patients (14,073 males and 9,406 females, 57.7 ± 16.8 years) were included in the analysis (shown in Fig. 1). Patients included were younger, with a higher rate of surgery, lower Charlson comorbidity index (CCI) [26], lower level of serum phosphate and serum prealbumin, and lower mortality rate than those out of the study (details shown in Supplemental Table 1). The study protocol was approved by the Ethical Committee of Ren Ji Hospital (LY-2022-057-B) and Xin Hua Hospital, (XHEC-C-2023-014-1). As a retrospective study, patients’ written consents were waived.
Fig. 1
The process of sample recruitment
Note: 1. Abbreviation: eGFR-EPI, estimated glomerular filtration rate calculated by Chronic Kidney Disease Epidemiology Collaboration equation; LOS, length of hospital stays
2. History of end-stage of renal disease was confirmed according to admission diagnosis in the medical record
Serum level of phosphate (exposure)All the biochemical parameters were tested within 48 h after admission. Venous blood samples were drawn into vacuum tubes containing Ethylene Diamine Tetraacetic Acid (EDTA) in the morning after participants fasted for at least eight hours as the regular hospital practice in China. Serum level of phosphate was measured by photometric analysis (Roche 701 Bioanalyzer, Roche, UK). The lower limit of detection was 0.1mmol/L. The intra-assay coefficients of variability (CV) were 0.5-0.9% and the inter-assay CV were 1.2-1.9% (Roche 701 Bioanalyzer, Roche, UK).
Patients were further classified into five groups based on serum phosphate level (inorganic phosphorus, iP) [27]: G1, iP < 0.64 mmol/L; G2, iP 0.64–0.8 mmol/L; G3, iP 0.8–1.16 mmol/L; G4, iP 1.16–1.45 mmol/L; and G5, iP ≥ 1.45 mmol/. Patients in G4 were treated as the reference group.
Clinical outcomesLOS was defined as the time between the measurement of serum phosphate and discharge time or the time of death. In-hospital mortality was confirmed based on medical records regardless of the cause of death during hospitalization.
Assessment of covariatesBaseline characteristics, including age, sex, primary disease for the admission, and comorbidities were abstracted from medical records. CCI without terms of human immunodeficiency virus (HIV) infection and acquired immune deficiency syndrome (AIDS), was used to assess the disease severity because information on HIV infection and AIDS was lacking in the two hospitals. Height and body weight were measured by registered nurses and were abstracted from medical records.
All other laboratory examinations were also abstracted from medical records. Serum levels of calcium, magnesium, sodium, potassium, chloride, liver function test such as alanine aminotransferase (ALT), aspartate aminotransferase (AST), alkaline phosphatase (ALP), gamma glutamyl-transferase (γ-GT), total bilirubin (TBIL), direct bilirubin (DBIL), albumin, and pre-albumin, renal function such as eGFR-EPI, fasting blood glucose (FBG), total cholesterol (TC), triglycerides (TG), low density lipoprotein cholesterol (LDL-C) and high-density lipoprotein cholesterol (HDL-C) were also measured by enzyme linked immunosorbent assay (Roche 701 Bioanalyzer, Roche, UK). White blood cell (WBC) and hemoglobin concentration were measured using an automated hematology analyzer (DxH 690T, Beckman Coulter, USA).
Levels of 25-hydroxyvitamin D [25(OH)D] were determined through an electrochemiluminescence immunoassay, and levels of 25-hydroxyvitamin D3 (vitamin D3) and 25-hydroxyvitamin D2 (vitamin D2) were measured by isotope dilution liquid chromatography tandem mass spectrometry. Serum 25(OH)D, vitamin D2 and vitamin D3 were conducted in Ren Ji Hospital while only 25(OH)D was conducted in Xin Hua Hospital. Low vitamin D status was defined as serum 25(OH)D level < 20 ng/ml [28] or sum of serum vitamin D3 and vitamin D2 level < 20 ng/ml [29] in the absence of 25(OH)D measurement.
To avoid the effects of hypoalbuminemia on serum level of calcium, albumin-corrected calcium was applied for further analysis, which was calculated as the following equation: serum total calcium (mmol/L) + 0.8×[40-serum albumin (g/L)] [30]. Liver injury was determined as any of the following: ALT (≥120 U/L), AST (≥150 U/L), ALP (≥250 U/L), γ-GT (≥100 U/L), or TBIL (≥34.2 μmol/L) [31].
Anemia was determined if serum level of hemoglobin was less than 120 g/L in males or less than 110 g/L in females [32]. Dyslipidemia was determined if one of the following criteria was met: serum TC ≥ 6.2 mmol/L, TG ≥ 2.3 mmol/L, LDL-C ≥ 4.1 mmol/L, or HDL-C < 1.0 mmol/L [33].
Missing dataIn our study, there were 31 (0.1%), 30 (0.1%), 33 (0.1%), 263 (1.1%), 33 (0.1%), 263 (2.2%), 371 (1.6%), 1,311 (5.6%), 109 (0.5%), 1,524 (6.5%), 475 (2%), 859 (3.7%), 1,031 (4.4%), 690 (2.9%), 691 (3%), 707 (5.1%), 676 (2.9) and 264 (0.8%) patients with missing data for ALT, AST, ALP, γ-GT, TBIL, DBIL, sodium, calcium, magnesium, chloride, albumin, prealbumin, FBG, TC, TG, LDL-C, HDL-C, WBC and hemoglobin, respectively. Multiple imputations were performed for all the above missing data using chained equation via SPSS in this study. The results with and without multiple imputation were similar (displayed in the Supplemental files). Therefore, we reported the results using origin data.
Statistics analysisContinuous variables were tested with the Shapiro-Wilk test for the normality of the distribution and were expressed as the mean±standard deviation (SD) in normal distribution or the median and interquartile range if in abnormal distribution. One-way analysis of variance or the Mann-Whitney U test was performed for comparisons of continuous variables among groups. Categorical variables were described as a number with percentages and were compared using the χ2-test or Fisher exact test.
We performed stepwise regression models to evaluate the association between phosphate categories and LOS. A univariate regression model was analyzed to recruit the risk factors for LOS (Supplemental Table 2), and variables with p < 0.1 on univariate analysis were further entering into the multivariate regression model. We used three models to adjust potential confounders. Model 1: adjustment of sex and age (“18–45 y”, “45–65 y” or “≥65 y”); model 2: adjustment of variables in model 1 and further CCI (“0”, “1–2”, or “≥3”), surgery (“no” vs. “yes”), hospital (Ren Ji Hospital vs. Xin Hua hospital), LOS (adjusted for mortality) (“<7 days”, “7–13 days” or. “≥14 days”), and BMI (“<18.5 kg/m2”, “18.5–24 kg/m2”, or “≥24 kg/m2”); model 3: adjustment of variables in model 2 and further serum level of eGFR-EPI (“30–60 ml/min/1.73m2”, “60–90 ml/min/1.73m2”, or “≥90 ml/min/1.73m2”), vitamin D status (“normal” vs. “low”), calcium (“<2.25 mmol/L”, “2.25–2.75 mmol/L”, or “≥2.75 mmol/L”), magnesium (“<0.75 mmol/L” vs.“≥0.75 mmol/L”), sodium (“<135 mmol/L”, “135–145 mmol/L”, or “≥145 mmol/L”), chloride (“<96 mmol/L”, “96–108 mmol/L”, or “≥108 mmol/L”), albumin (“≥35 g/L” vs. “<35 g/L”), pre-albumin (“≥160 mg/dL” vs. “<160 mg/dL”), anemia (“no” vs. “yes”), liver injury (“no” vs. “yes”), dyslipidemia (“no” vs. “yes”), fasting blood glucose (for mortality) (“<3.5mmol/L”, “3.5-7mmol/L”, or “≥7mmol/L”), and white blood cell count (“<10 × 109/ml” vs. “≥10 × 109/ml”).
We also examined the non-linear relationship between serum phosphate level as continuous variable and LOS using a restricted cubic spline in fully-adjusted model, and confirmed the inflection point if a non-linear relationship existed. Moreover, a two-piecewise linear regression analysis was performed on both sides of the inflection point on the association between each 0.1mmol/L change in serum phosphate level and LOS.
To test the robustness of main results of association between serum phosphate levels and LOS, we performed multiple sensitivity analyses: [1] excluding patients with CCI of 3 points or more (n = 3,070) [34]; [2] excluding patients whose eGFR-EPI < 60 ml/1.73m2 (n = 2,348) [35]; [3] excluding patients whose BMI ≥ 24 kg/m2 (n = 9,587) or BMI < 18.5 kg/m2 (n = 1,835) [36, 37]; [4] excluding patients with low vitamin D status (n = 15,924) [38]; [5] excluding patients whose hospital LOS ≥ 30 days (n = 742); [6] excluding patients whose serum phosphate were not tested within 24 h (n = 3,330).
Subgroup analyses were performed for the stratification factors by introducing an interaction term with LOS. Patients were sub-grouped by sex (“male” vs. “female”), age (“18–45 y”, “45–65 y”, or “≥65”), hospital (Ren Ji Hospital vs. Xin Hua Hospital), CCI (“0”, “1–2”, or “≥3”), serum albumin (“≥35 g/L” vs. “<35 g/L”), prealbumin (“≥160 mg/L” vs. “<160 mg/L”), magnesium (“<0.75 mmol/L” vs. “≥0.75 mmol/L”), and vitamin D status (“normal” vs. “low”).
Moreover, multivariate logistic regression analysis was performed to evaluate the association between serum phosphate categories and in-hospital mortality in fully adjusted model.
All the data were analyzed by SPSS (version 21.0, IBM Corp) and R statistical software tools (http://www.r-project.org, The R Foundation) was used to figure out non-linear relationship. P value of < 0.05 was considered as statistical significance.
留言 (0)