
記住我
Coronavirus Disease-2019 (COVID-19) is a contagious respiratory disorder caused by Severe Acute Respiratory Syndrome Coronavirus 2 (SARS-CoV-2), a newly emerged β coronavirus belonging to the Coronaviridae family (Karim and Khan, 2020). Since its discovery in Wuhan, China, in December 2019, COVID-19 established itself as a devastating global pandemic that has created disruptions across healthcare, economic, and social systems (Chen et al., 2020).
COVID-19 is characterized by a range of clinical phenotypes that reflect the spectrum of disease severity (i.e., mild, moderate, and severe herein defined as disease phases). Disease phenotypes are broadly classifiable as asymptomatic and symptomatic with approximately 85% of infected patients (vaccinated and non-vaccinated) showing mild to moderate symptoms and approximately 15% of infected patients suffering from potentially life-threatening complications (Singhal, 2020). The mild to moderate disease phase includes disease conditions with few or no infection symptoms, hospitalization with either no oxygen therapy required or with oxygen given by mask or nasal prongs, and no fatalities. In contrast, the severe disease phase includes disease conditions that, besides death, could involve one or a combination of hospitalization, oxygen therapy involving mechanical ventilation, respiratory failure, and significant immune dysregulation (Karim and Khan, 2020).
Each COVID-19 disease phase (i.e., mild, moderate, and severe) is marked by changes in omics profiles with corresponding changes in the expression levels of biosignatures (Blanco-Melo et al., 2020; Messner et al., 2020; Sun et al., 2020). In the context of this research, we define biosignatures as omics features that include proteins, transcripts, lipids, and metabolites. Although some of these biosignatures have a connection to the pathology of COVID-19 illness, not all of them actively impact the expressed disease phenotype when they are dysregulated. Different major dysregulated biosignatures including but not limited to Interferon Alpha 1 (IFNA1), Interferon Alpha Inducible Protein 6 (IFI6), Toll-Like Receptor 4 (TLR4) and interleukin-6 (IL6) are linked to host responses to COVID-19 (Bernardes et al., 2020; Ovsyannikova et al., 2020; Schulte-Schrepping et al., 2020; Aschenbrenner et al., 2021). Such biosignatures may serve not only as potential biomarkers to stratify patients according to disease severity and/or provide detailed prognostic information but could also contribute to the development of treatments that are more specifically targeted at particular disease states.
Several individual-omics (Fraser et al., 2020; Alqutami et al., 2021; Daamen et al., 2021; Jain et al., 2021; Patel et al., 2021; Zhong et al., 2021; Ciccarelli et al., 2022; Jia et al., 2022; Páez-Franco et al., 2022; Roberts et al., 2022; Suhre et al., 2022) and multi-omics COVID-19 investigations (Barh et al., 2020; Bernardes et al., 2020; Overmyer et al., 2020; Su et al., 2020; Stephenson et al., 2021; Sun et al., 2021; Suvarna et al., 2021; Chattopadhyay et al., 2022; Gygi et al., 2023) have identified biosignatures that are associated with disease progression. Individual omics studies provide specific insights into the contributions/manifestations of biosignatures at that omics level during disease progression but have not accounted for the impact(s) of other omics layers. Multi-omics studies present a means to collectively compare multiple omics data from different experiments either on the same samples or across studies, to yield a more holistic understanding of the biochemical underpinnings of COVID-19 outcomes. However, few of these omics studies (Barh et al., 2020; Bernardes et al., 2020; Overmyer et al., 2020; Su et al., 2020; Stephenson et al., 2021; Sun et al., 2021; Suvarna et al., 2021; Chattopadhyay et al., 2022) focusing on identifying the biochemical drivers of COVID-19 clinical heterogeneity have computationally integrated multi-omics data from different study samples with existing biological knowledgebases to explore biosignatures of different omics types and their connections across different disease phases. We suggest that this kind of multi-omics data integration is essential when attempting to explain the molecular dynamics underpinning the heterogeneity of COVID-19 infections while accounting for both prior knowledgebase and data from independent studies.
Network-based integrative approaches have revolutionized multi-omics analyses by providing the framework to build on existing knowledgebases when using new data to infer interactions between multiple different omics profiles within the context of a graph representation (Agamah et al., 2022). This has been shown to provide the opportunity not only to elucidate interactions that can occur among all classes of biomolecules in a biological system but also, to prioritize biosignatures that could discriminate disease severity. The approach represents the biomolecules that are most indicative of differences between disease states (i.e., the biosignatures) as nodes in the graph and infers relationships between them. For this reason, we hypothesized that i) investigating biosignatures across different phases of COVID-19 disease will provide insights into the molecular underpinnings of the enormous clinical heterogeneity of COVID-19 and ii) associations between biosignatures within a biologically meaningful network would permit the prioritization of biosignatures that discriminate between the disease states and could yield leads for potential drug targets.
Our study implemented a multi-omics network-based approach to identify and characterize biosignatures underlying various COVID-19 disease phases by integrating transcriptomics, metabolomics, proteomics, and lipidomics data (each representing a different data layer) with known interactome data (i.e., our present knowledgebase). We built disease-state specific omics-graphs and applied a network diffusion-based method to predict biosignatures and their associated interactions—both within and between omics layers—that are linked to the various COVID-19 disease phases. This is a form of intermediate-stage multi-omics integration or a multi-dimensional integration approach where multi-omics data are integrated simultaneously during the analysis (Adossa et al., 2021; Agamah et al., 2022).
The major contributions of this work are; 1) a new method of harmonizing patient disease severity metrics by leveraging the WHO Ordinal Scale (WOS) and patient metadata; 2) the assembly of a unified COVID-19 knowledge graph from different curated sources of interactome data (our resent knowledgebase); 3) the construction of a disease-state specific omics-graph by integrating curated transcriptomics, proteomics, lipidomics, and metabolomics datasets from two different multi-omics studies; and 4) identified biosignatures and their associated interactions that are shared and/or unique to mild, moderate, and severe COVID-19 disease-states. Overall, this study identifies biosignatures that discriminate between disease states. These results suggest that COVID-19 disease severity is influenced by interactions across different omics layers. Importantly, this study’s reproducible analysis pipelines offer a valuable tool for identifying biosignatures and interactions not just in COVID-19, but also in other diseases with distinct stages.
Materials and MethodsStudy design and proceduresThe approach for this study (Figure 1) consists of five main steps including: 1) data curation and pre-processing; 2) disease severity harmonization; 3) construction of disease-state specific omics-graphs; 4) multi-layer network-based random walk analysis; and 5) enrichment analysis.
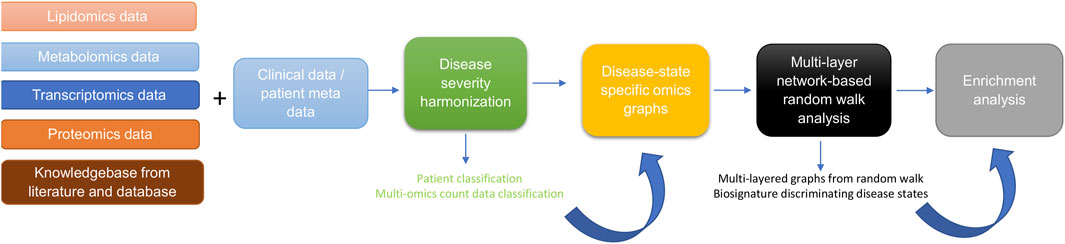
Figure 1. Diagram illustrating the workflow implemented in this study. The workflow begins with curating lipidomics, metabolomics, transcriptomics, proteomics data, and their associated patient metadata and knowledge graph from literature and databases. Next, we leveraged the patient metadata to perform disease severity harmonization. To harmonize the clinical severity of patients, we used the WOS as the reference for classifying disease severity into three disease states, such that: 1) mild disease state represents COVID-19 patients with WOS 1–2, 2) moderate disease state represents COVID-19 patients with WOS 3–4, and 3) severe disease state represents COVID-19 patients with WOS 5–9. We then used the harmonized information to split the omics datasets according to disease severity before constructing coexpression networks and disease-state specific omics-graphs. We then performed random walk analysis on the graphs to predict biosignatures discriminating the various disease states. Finally, we performed enrichment analysis on the proteins, transcripts, metabolites, and lipids.
Data sourcesMulti-omics experimental dataMulti-omics experimental datasets from two independent studies were used in this study; quantified blood plasma transcript, protein, and metabolite count data from (Su et al., 2020), and transcript, protein, metabolite, and lipid count data from (Overmyer et al., 2020). For both studies by (Su et al., 2020), and (Overmyer et al., 2020), patient recruitment and sample collection occurred in 2020 during the peak of COVID-19 cases. The methodologies utilized for data collection and patient treatment in both studies are different and are outlined in the original studies. For (Su et al., 2020), the study samples consisted of 139 COVID-19 patients (60 males and 79 females) and 258 healthy controls (Supplementary Data Table S1). These enrolled COVID-19 patients had an age range from 18 to 89 years (median = 58). The patients from which blood is drawn were classified as WHO Ordinal Scale (WOS) = 3–4 (n = 83) and WOS = 5–7 (n = 47). The authors used an unpaired Wilcoxon test to determine the statistical difference between WOS = 3–4 and WOS = 5–7, and p values were FDR adjusted. The Overmyer et al., 2020), study samples were collected from 128 adult patients of which 102 (64 males and 38 females) were COVID-19-positive and 26 (13 males and 13 females) were negative (Supplementary Data Table S1). There were no significant differences between the average ages of males and females in either the COVID-19 positive group—(61.3 years for females and 63.1 years for males; (p-value = 0.56; calculated using t-test) or the COVID-19 negative group (59.5 years for females and 67.0 years for males; p-value = 0.25).
Protein-protein interactomeWe retrieved 1832 names of human genes associated with COVID-19 from the DisGeNET database version 5 (Piñero et al., 2020). GeneMANIA (Franz et al., 2018) was used to generate an interactome for 1,692 of these genes (140 were unrecognized by the GeneMANIA database). Interactions between genes were based on co-expression, physical interaction, co-localization, shared protein domains, genetic interaction, or predictions from manual curation.
Metabolite-metabolite interactomeA co-expression network was constructed from the metabolomics measurement data. Specifically, Pearson’s correlations were used to estimate the individual relationships between features for every pre-processed omics measurement using an in-house R script Highly correlated pairwise interaction scores ≥0.7 were used to select components of the metabolite-metabolite interactome that was used for downstream analysis. The threshold of 0.7 was determined after carefully evaluating the structural behaviour of the co-expression network and the observed associations at different thresholds.
Lipid-lipid interactomeA co-expression network was constructed from the lipidomics measurement data. Similar to the process implemented for metabolite-metabolite interactome above, highly correlated pairwise interaction scores ≥0.7 were used to select components of the lipid-lipid interactome that was used for downstream analysis.
COVID-19 knowledge graphWe further included a multi-modal, knowledge model of COVID-19 pathophysiology (COVID-19 Knowledge Graph version 0.0.2, https://github.com/covid19kg/covid19kg) (Domingo-Fernández et al., 2021). The graph incorporates nodes, covering 10 entity types (e.g., proteins, genes, chemicals, and biological processes) and relationships between the nodes, and we considered only protein, genes, transcripts, lipids, and metabolites node types and their interactions for downstream analysis.
Cross-layer interactomeWe retrieved protein-transcript, metabolite-protein, and lipid-protein associations from (Su et al., 2020), and (Overmyer et al., 2020), and used these to construct a bipartite graph for network analysis.
Harmonizing the clinical severity of patientsPatient sample metadata from both the (Su et al., 2020), and (Overmyer et al., 2020), sources were used for disease severity harmonization. For (Su et al., 2020), metadata, the disease state linked to the samples was described using the WHO Ordinal Scale (WOS) based on specific categories and characteristics including 1) uninfected—no evidence of infection; 2) infected but ambulatory with no limitation of activities; 3) infected with limitation of activities but still ambulatory; 4) hospitalized with no or mild oxygen therapy; 5) hospitalized with oxygen administered by mask or nasal prongs; 6) hospitalized with non-invasive ventilation or high-flow oxygen; 7) hospitalized with intubation and mechanical ventilation; 8) hospitalized, with intubation and mechanical ventilation together with additional organ support; and 9) death.
In the metadata (Overmyer et al., 2020), disease severity was quantified using hospital-free days at day 45 (HFD-45) scores: a composite outcome variable that accounts for the length of hospital stay. The utility of the HFD-45 score is derived from the fact that severe COVID-19 patients are those who are admitted to the hospital the longest as they require ventilatory support, while those with the most extreme cases die during hospitalization (Overmyer et al., 2020). The variable assigns a zero value (0-free days) to patients with severe disease who remain admitted longer than 45 days or die due to respiratory deterioration while admitted, and higher values of HFD-45 to patients with shorter hospitalizations and milder disease severity.
To harmonize the clinical severity of patients, we used the WOS as the reference for classifying disease severity into three disease states, such that: 1) mild disease state represents COVID-19 patients with WOS 1–2, 2) moderate disease state represents COVID-19 patients with WOS 3–4, and 3) severe disease state represents COVID-19 patients with WOS 5–9.
The (Overmyer et al., 2020), sample metadata included the following variables: 1) ICU Status (an indicator variable of the patient’s ICU status), 2) HFD-45, 3) Acute Physiologic Assessment and Chronic Health Evaluation II (APACHE II) Score (an indicator variable ranging from 0 (best health) to 71 (worst health) based on physiologic variables, age, and health conditions), and 4) Mechanical Ventilation Status (MVS) (an indicator variable describing the patient’s mechanical ventilation status). There was a correlation between the HFD-45 and ICU status with APACHE II and MVS. These variables could feasibly be mapped onto the WOS scale, knowing that the WOS scale is primarily based on respiratory status and oxygen/ventilation support. Accordingly, we leverage this metadata to map characteristics of the (Overmyer et al., 2020) study patients on the WOS. Specifically, we assigned: a mild disease state to COVID-19 patients with HFD-45 between 29–45 with no time spent in the ICU, a moderate disease state to COVID-19 patients with HFD-45 between 29–45 who spent time in the ICU, or an HFD-45 between 21–28 regardless of time spent in the ICU, and severe disease state to COVID-19 patients with HFD-45 less than 20 regardless of time spent in the ICU.
Data pre-processingWe conducted a two-step data pre-processing operation on the omics experimental data using a custom script. Outlier and missing values were removed, and data were normalized. Samples with more than 20% missing data in a certain data type were excluded. Similarly, biological features such as mRNA expression, with more than 20% of values missing across patients were dropped from the data. Z-score normalization was then applied such that each feature of the data (samples as columns and features as rows) had an average of 0 and a standard deviation of 1.
Feature mapping to unified identifiersTo ensure that the feature labels were unified, transcript and protein identifiers were mapped to gene-level IDs using the UniProt (https://www.uniprot.org/) and NCBI databases (https://www.ncbi.nlm.nih.gov/gene/). Metabolite and lipid name descriptors were maintained for all analyses other than functional analysis for which KEGG or PubChem IDs were used.
Building a unified knowledge graphWe assembled a unified knowledge graph by merging the protein-protein interactome, the metabolite-metabolite interactome, the lipid-lipid interactome, and the extracted data from the COVID-19 knowledge graph using a custom script (Domingo-Fernández et al., 2021).
Building disease-state specific omics-graphsProtein-protein, transcript-transcript, lipid-lipid, and metabolite-metabolite co-expression networks for the various COVID-19 disease states (i.e., mild, moderate, severe) were constructed based on an integrated unified knowledge graph, and the pre-processed omics data using an R script. From the (Su et al., 2020), omics data, we constructed three co-expression networks (protein-protein, transcript-transcript, and metabolite-metabolite) for each disease state. Likewise, we constructed four co-expression networks (protein-protein, transcript-transcript, lipid-lipid, and metabolite-metabolite) for each disease state from the (Overmyer et al., 2020), data. This was achieved by evaluating the correlation between the expression of each linked feature pair where each feature is represented in the unified knowledge graph (i.e., transcript-transcript, protein-protein, metabolite-metabolite, lipid-lipid feature pairs). Pearson’s correlations were used to estimate the individual relationships between features for every pre-processed omics measurement using an in-house R script.
The interaction between feature pairs is represented by the Pearson Correlation Coefficient (PCC) ranging between −1 (perfect negative correlation) and 1 (perfect positive correlation), with values of zero representing no correlation. We further rescaled the PCC score for each pairwise interaction by computing the absolute value to attain positive scores ranging between 0 and 1. Additionally, we defined a threshold of 0.1 for edge filtering after careful consideration of the results at different threshold points. We suggest that these steps contributed significantly to addressing the potential for spurious findings and contributed significantly to the reliability of our findings. The co-expression networks constructed from each single omics dataset formed the baseline for the network integration. Specifically, the co-expression networks of the same omics data type constructed from the two independent studies were integrated by merging the networks to construct four omics-specific graphs (one for each omics type) for each of the three disease states.
Random walk network analysisCOVID-19 disease state graph exploration by a random walk with restartWe adapted multiXrank (Baptista et al., 2022; Baptista et al., 2024), a random walk with restart on a multilayer network algorithm to explore the disease-state specific omics-graphs. This algorithm was chosen because it enables random walk with restart on any kind of multilayer network generated from different data sources as compared to other methods that are limited in the combination and heterogeneity of networks that they can handle (Agamah et al., 2022). We modified the configuration script for the algorithm to accept four disease-state specific omics-graphs for our analysis.
For network exploration on each disease state, the disease-state specific omics-graphs, cross-layer interactome, and seed nodes were used as inputs for the algorithm. Outputs were multi-layered graphs that described the exploration of the seed nodes across the different disease-state specific omics-graphs and a list of features in each disease-state specific omics-graph ranked according to their proximity to seed nodes.
The parameter values for global restart probability (set to 0.7), and inter-layer jump probability in a given disease-state specific omics-graph (set to 0.5), were maintained. The probability to restart in a specific layer of a specific disease-state specific omics-graph was set to 1: a setting that meant the disease-state specific omics-graph was classifiable as a monoplex network.
The probability of restarting in a specific disease-state specific omics-graph was set to 0. This meant that the random walker stayed within the network within which it began with a probability equal to 1.
To achieve homogeneous exploration, the initial probability of jumping across different disease-state specific omics-graphs was set to 0.25 in consideration of the four disease-state network layers.
Briefly, the first step of the algorithm is to create adjacency matrices for the input graphs, followed by computing different transition probabilities of the random walk with restart on the graphs. The probabilities are estimated based on the concept that an imaginary particle starts a random walk from the seed node to other nodes in the network. These different transition probabilities describe the walks within a graph and the jumps between graphs. A higher probability score (close to 1) suggests a higher likelihood of walking or jumping between graphs.
Identifying seed nodes for multi-layered network explorationTo select seed nodes for the analysis, we implemented two approaches; 1) a data-driven approach where we selected, after merging the different co-expression networks, the features with the highest node integrated centrality score in each omics layer as seeds, and 2) a hypothesis-driven approach where we selected seeds based on their impact on disease severity to test the hypothesis of their differential associations with mild, moderate, and severe COVID-19 disease states. Hypothesis-driven has the advantage of bringing the question being investigated into focus by designing the model with a specific biological hypothesis in mind and exploring variations across disease phases while the data-driven, enables a more unbiased and informed model through computationally intensive use of the data (Arazi et al., 2013; Eriksson et al., 2022). Although hypothesis- and data-driven modeling approaches are not mutually exclusive, it is worth noting that this diversity is beneficial: most model-building tools and models have a specific and clear role, however at the same time, combining hypothesis- and data-driven approaches in an interoperable way, provide an immense impact on our understanding of the disease phases as modelling and integrating data at different biological scales (Arazi et al., 2013; Eriksson et al., 2022).
For the data-driven approach, the features were ranked by leveraging the node degree, closeness, betweenness, and eigenvector centrality metrics to compute an integrated score (see Supplementary Data Equations S1–S3). These centrality metrics provide insight into the importance of a node. For instance, the closeness metric measures how close a node is to all other nodes in the network. A lower closeness centrality score indicates the node is on average closer to other nodes, potentially making it a faster “information hub.” The degree metric measures the number of edges (connections) a node has with other nodes. A higher degree means the node has more direct connections, suggesting it might be more influential or receive more information flow. The betweenness metric captures how often a node lies on the shortest path between other pairs of nodes. A higher betweenness centrality score suggests the node acts as a crucial bridge for information flow within the network. The eigenvector metric considers not just the number of connections a node has, but also the “importance” of its neighbours. Nodes with high eigenvector centrality are considered influential due to their connections to other influential nodes.
Ranking candidate multi-omics features for COVID-19 disease statesAll the network nodes were scored and ranked by the algorithm according to their proximity to the seed nodes (Baptista et al., 2022). The computed score was the geometric mean of the node’s proximity to the seeds.
Enrichment analysisMetabolite pathwayMetabolite pathway enrichment analysis was performed using the MetaboAnalyst 5.0 online Pathway Analysis tool (Pang et al., 2021) (accessed 26 January 2023). Metabolite names were entered as KEGG IDs, and when necessary, metabolite names were automatically adjusted to match the nomenclature recognized by MetaboAnalyst (e.g., Hydroxypropanoate as hydroxypropanoic acid). Using high-quality KEGG metabolic pathways as the backend knowledgebase, we used the hypergeometric statistical test to examine the overrepresentation of metabolites predefined in the KEGG pathway present in the queried metabolites. This approach determined whether a particular group of compounds was represented more than expected by chance within the user-uploaded compound list.
Lipid pathwayWe conducted lipid pathway enrichment analysis using the LIPEA online Pathway Analysis tool (Acevedo et al., 2018) (accessed 26 January 2023). Lipid names were entered as a compound list and, when necessary, these names were adjusted to match the nomenclature recognized by LIPEA. The resource computes an unadjusted p-value on overrepresented pathways, and a p-value adjusted with Bonferroni correction to reduce false positives.
Gene ontology analysisProtein/transcript enrichment analysis was performed using the online Enrichr Gene Ontology Resource (Kuleshov et al., 2016) (accessed 26 January 2023). The resource provides gene-set libraries made of a set of related genes that are associated with a functional concept such as a biological pathway or process (Kuleshov et al., 2016). Gene ID identifiers were used as input for the enrichment analyses. The resource computes Fisher’s exact test followed by a correction based on a mean rank and standard deviation from the expected rank for each term in each gene-set library (Kuleshov et al., 2016).
ResultsHarmonized clinical severity between patients’ metadataThe clinical severity harmonization was a crucial step in integrating and analysing data from multiple sources and platforms to gain a more comprehensive understanding of biological systems and disease mechanisms. There were more severe samples than any other in the (Overmyer et al., 2020) dataset followed by mild and then moderate samples (Figure 2). For the (Su et al., 2020), dataset, there were similar numbers of mild and moderate samples and fewer severe samples. The classified samples (Supplementary Data Table S2) were used to split the omics counts data into disease states before constructing the disease-state specific omics-graphs.
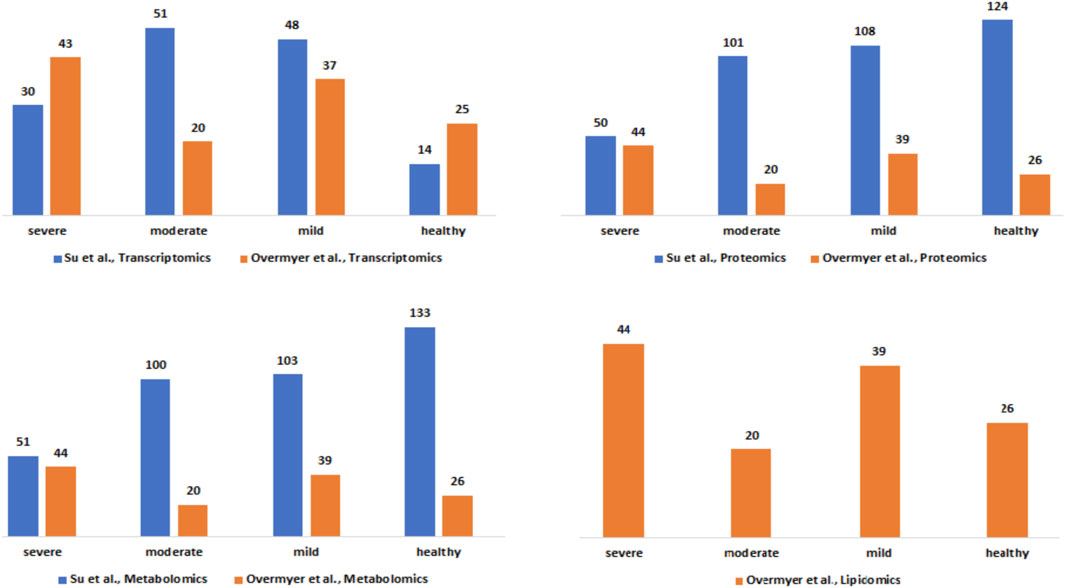
Figure 2. Description of the Su et al., and Overmyer et al., samples based on the omics data type and the disease severity levels after the harmonization process.
Integrative network-based multi-omics analysisConstruction of disease-state specific omics-graphsWe constructed a unified knowledge graph (Figure 3A) comprising four different edge types by merging the protein-protein interaction data from GeneMANIA, metabolite-metabolite interactome, lipid-lipid interactome, and the extracted data from the COVID-19 knowledge graph. Importantly, the unified knowledge graph formed the basis for integrating the processed multi-omics data (Figure 3B) and constructing disease-state specific omics-graphs for mild, moderate, and severe COVID-19 disease states (Supplementary File S1). Additionally, the disease-state specific omics-graphs enabled us to investigate COVID-19 disease states in the context of specific omics data types.
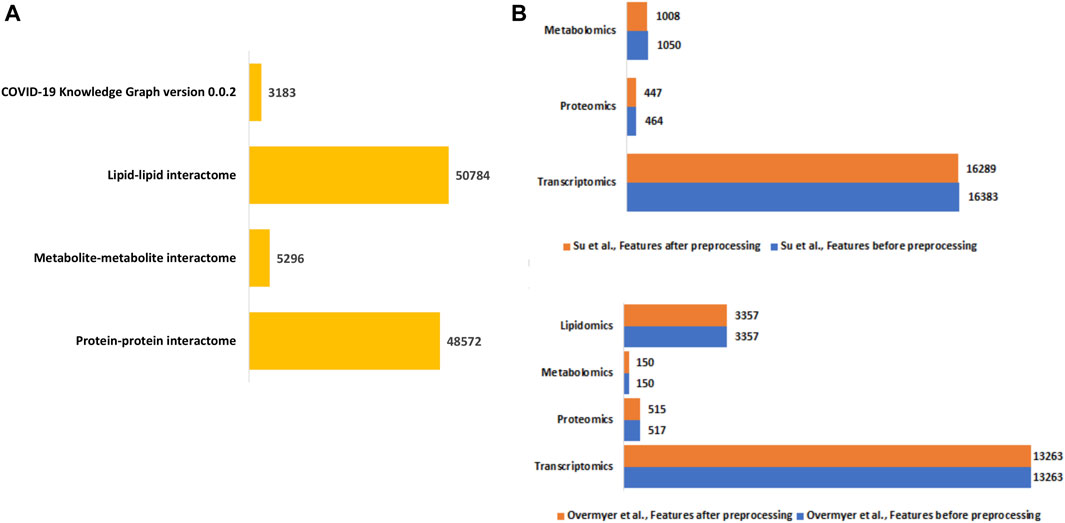
Figure 3. (A) Summary of the edge count in the interactome datasets used to construct the unified knowledge graph. (B) Distribution of features in the omics experimental datasets before and after data processing.
Identified seed nodes for network explorationThe random walk method is a technique for detecting the flow of biological information throughout networks. The concept behind the random walk method is such that a hypothetical particle exploring the network structure takes random discrete steps (walks) in some direction from a seed node (Agamah et al., 2022). The walk explores different layers based on the premise that nodes related lie close to each other in the network (Valdeolivas et al., 2019).
We selected the seed nodes at which random walks began (Table 1) using both data-driven and hypothesis-driven approaches. Whereas for the data-driven approach, we selected a seed primarily based on network topology by computing an integrated node centrality metric score (Supplementary Data), for the hypothesis-driven approach, we selected nodes based on previously reported associations of molecular features with COVID-19 disease states and to test the differential association these nodes with disease outcomes.

Table 1. Selected seeds for random walk network exploration.
For the data-driven approach, one selected seed node was the Signal Transducer And Activator Of Transcription 1 (STAT1) from the transcriptomics layer. STAT1 is known to be involved in immune responses and antiviral activity (Lucas et al., 2020) and is reported to be upregulated in mild and severe COVID-19 cases, with the phosphorylation of the gene highly enhanced in severe disease states (Rincon-Arevalo et al., 2022). Another selected seed node from the proteomics layer was Superoxide Dismutase 2 (SOD2), an essential antioxidant enzyme that protects cells from superoxide radical anions which are known to be significantly under-expressed in the plasma (Žarković et al., 2022), and in the lung cells of severely infected COVID-19 patients (Zarkovic et al., 2022). From the metabolomics layer, we used 3-hydroxyoctanoate, as a seed: 3-hydroxyoctanoate is a metabolite of medium-chain fatty acid oxidation that has been identified as a marker for primary defects of beta-hydroxy fatty acid metabolism and it is a conjugate acid to 3-hydroxyoctanoate, a biomarker of asymptomatic COVID-19 infection that is involved in important pathways such as the activation of macrophage and platelet aggregation (Franz et al., 2018). From the lipidomics layer, we identified unknown_mz_815.61548_+_RT_27.063, an uncharacterized lipid as a seed.
For the hypothesis-driven approach, we selected interleukin-6 (IL6) and interleukin-6 receptor (IL6R) as seeds. Besides the pathologic roles of these molecules in immune-inflammatory diseases such as COVID-19, it has been hypothesized that inhibition of IL6 receptors (IL6Rs) by tocilizumab ameliorates the symptoms of severe COVID-19 and reduces mortality (Kaye and Siegel, 2020; Samaee et al., 2020). We aimed to find out how IL6 and IL6R influence disease severity.
Random walk analysis on disease-state specific omics-graphs using data-driven seedsWe used various omics features (Table 1) as seed nodes for the random walk analysis. Subsequently, features in each disease-state specific omics-graph were ranked by their proximity to the seeds. The generated multi-layered graphs (accessible at http://cytoscape.h3africa.org), describing the exploration of the seeds during the random walk analysis for each disease state, suggested that cross-layer interactions between the different omics data types influence disease severity. This is evidenced particularly in the protein-metabolite (e.g., HGF and 1-palmityl-GPC, HGF and 6-bromotryptophan), transcript-metabolite (e.g., CCL2 and taurine, CCL2 and 1-(1-enyl-palmitoyl)-2-oleoyl-GPC)), and protein-transcript (e.g., HGF and HLA-B) interactions. For each omics layer, we identified highly connected features (Table 2) forming large subnetworks and defined these as “key hubs.”
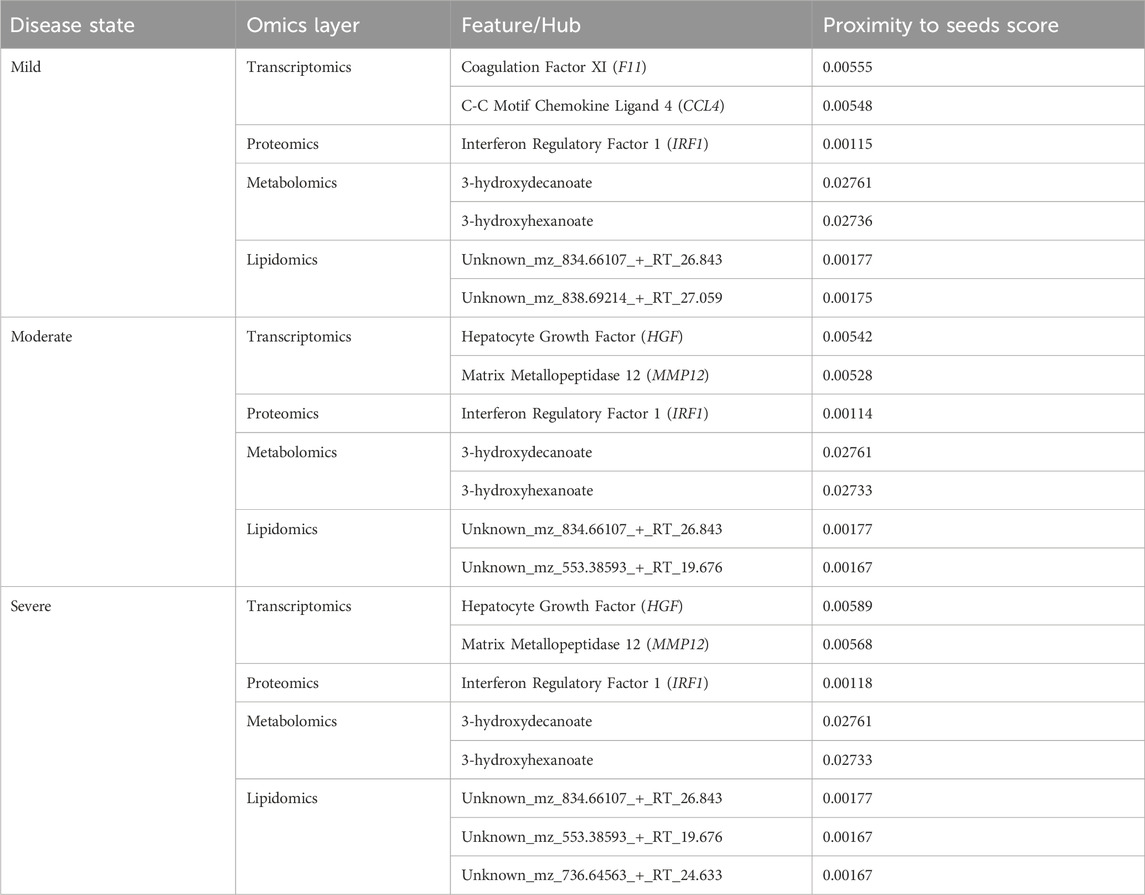
Table 2. Key hubs identified in the disease-state specific omics-graphs upon using seeds from the data-driven approach.
Random walk analysis on disease-state specific omics-graphs using hypothesis-driven seedsLike the network exploration using data-driven seeds, we repeated the analysis with hypothesis-driven seeds. We observed from the multi-layer graphs (accessible at http://cytoscape.h3africa.org) that IL6 interaction with features of different omics data types increased with disease severity, thus indicating the differential association of IL6 with the different disease states. On the other hand, we observed IL6R interactions mainly with proteins and transcripts to increase with disease severity as compared to interactions with metabolites. The results suggest IL6 interaction with proteins (e.g., IFNB, IFIT3), transcripts (e.g., CXCL1, CXCL2, CCL3), and metabolites (e.g., 1-(1-enyl-palmitoyl)-GPC, 1-(1-enyl-palmitoyl)-2-oleoyl-GPC (P-16:0/18:1)) may contribute to its significant role in disease severity. Similar to analysis using data-driven seeds, we identified key hubs from each omics layer (Table 3). The hubs with zero proximity scores establish subnetworks with no direct interaction with seed nodes (IL6 and IL6R) (as shown in http://cytoscape.h3africa.org).
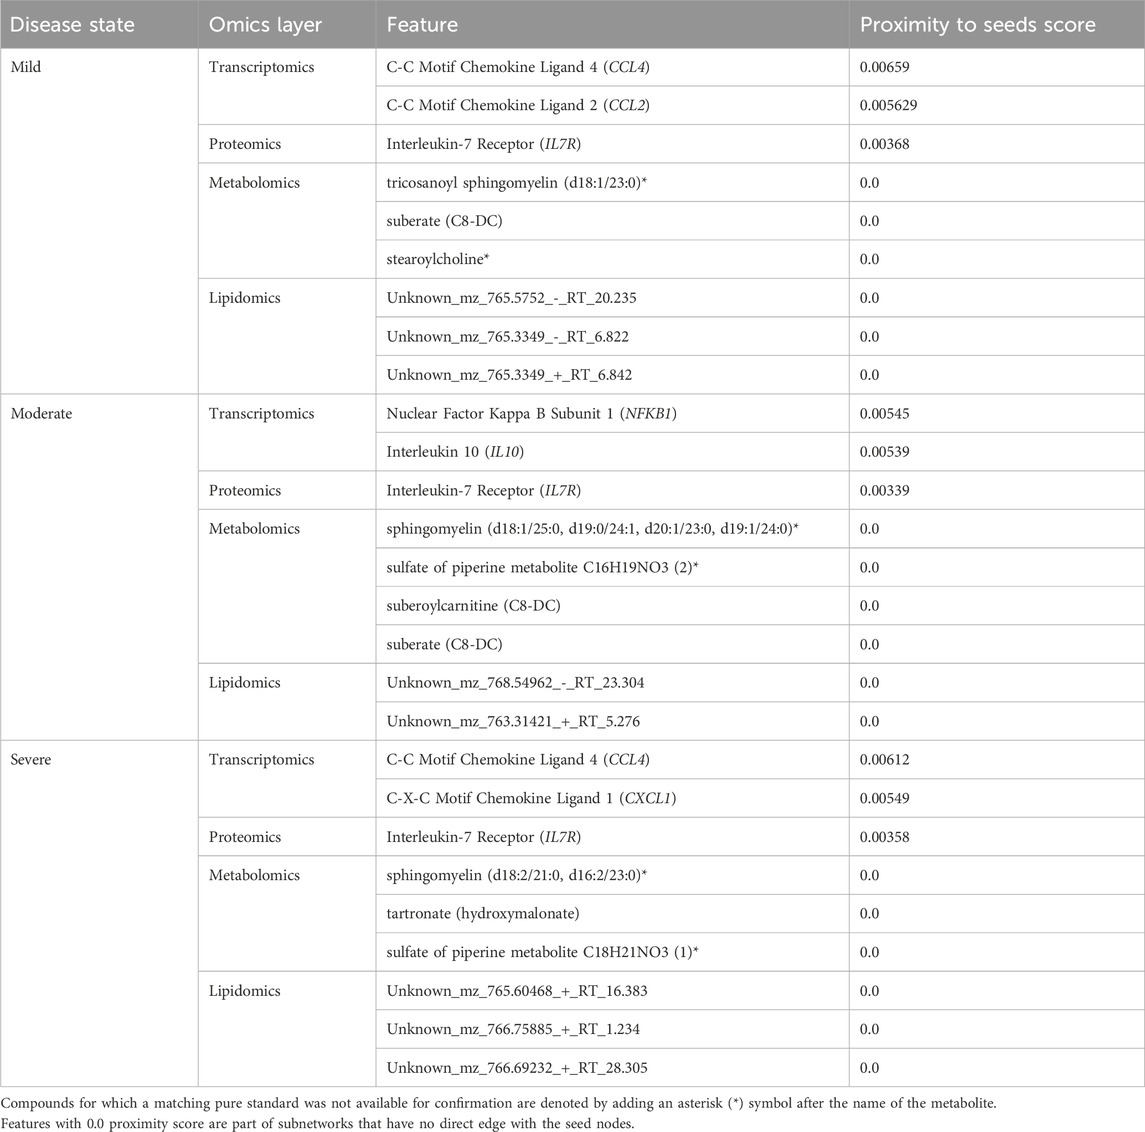
Table 3. Key hubs identified in the disease-state specific omics-graphs upon using seeds from the hypothesis-driven approach.
Evaluating features and interactions of generated multi-layered graphsIn this section, we dissect different multi-layered graphs generated from random walk analysis to examine common and unique feature interactions related to disease severity. The multi-layered networks generated for each disease state contain four types of nodes (proteins, transcripts, lipids, and metabolites), and at most six types of edges (transcript-transcript, protein-protein, protein-transcript, protein-metabolite, metabolite-metabolite, lipid-lipid). We did not observe protein-lipid edge types across all the networks. This observation is because the seed exploration prioritizes nodes that have an either direct or indirect connection to the seeds (i.e., related to the seeds), thus no observed protein-lipid edge type is an indication that there was limited bipartite data that captures interactions between nodes and seeds of interest.
Evaluating multi-layered graphs generated using data-driven seedsWe evaluated the feature interactions (Supplementary File S2) present in the multi-layer graphs (accessible at http://cytoscape.h3africa.org) identifying 204 interactions associated with a specific disease state of which 79%, 15%, and 6% are transcript-transcript, lipid-lipid, and protein-protein interactions respectively. Of these interactions, most (88%) are associated with the mild disease state. Additional investigation of 263 interactions associated with only two of the three disease states revealed more pairwise interactions common between the moderate and severe disease states as compared to those in common between the mild-moderate and mild-severe disease state pairs (Supplementary File S2). Also, an investigation of 397 interactions common across the three disease states revealed a higher proportion of interactions between transcripts associated with various cellular processes and about 1% each for metabolite-metabolite, protein-protein, and protein-metabolite interactions (Supplementary File S2).
In addition to subnetworks formed by the seed nodes, we observed CCL4, F11, and IRF1 interact directly with seed nodes SOD2 and STAT1 and form subnetworks in the multi-layered graph generated for the mild disease state. CCL4 established interactions with human leucocyte antigen, co-stimulatory molecules (e.g., CD2, CD4, CD8, CD83, CD53, CD3D HLA-DPA1, HLA-DPB1, HLA-DRA), and other molecules expressed in monocytes and macrophages (e.g., CCL5, CCL7, CCL8) to be highly predominant in the mild disease state (Figure 4A). This observation may suggest a more efficient immune response to the virus among patients with mild disease as compared to those with moderate and severe disease, thus leading in the latter group to decreased recruitment of immune cells to the site of infection (Lucas et al., 2020).
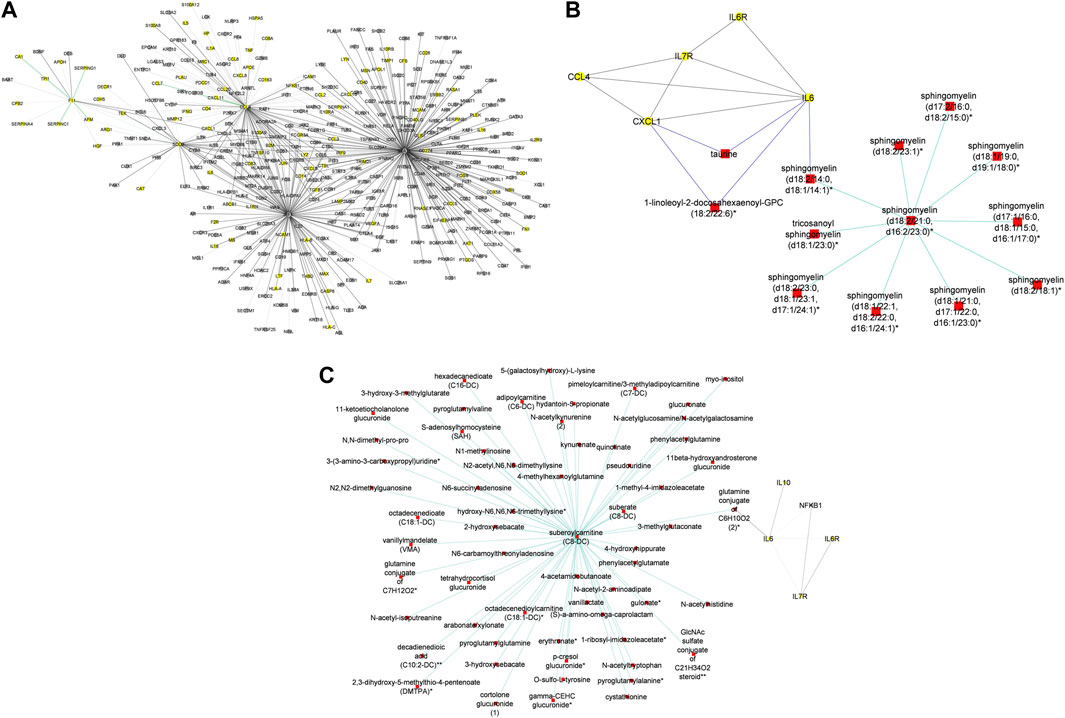
Figure 4. (A) Graph representation of subnetworks formed by hubs CCL4, F11, and IRF1, that establish direct interaction with seed nodes (STAT1 and SOD2) as observed in the multi-layered graph generated for the mild disease state. The graph highlights the interaction of these hubs with other molecular features including proteins (yellow nodes) and transcripts (grey nodes) (B) Graph representation of subnetworks formed by hubs HGF, IRF1, and MMP12, that establish direct interaction with seed nodes (STAT1 and SOD2) as observed in the multi-layered graph generated for the moderate disease state. The graph highlights the interaction of these hubs with other molecular features including proteins (yellow nodes), transcripts (grey nodes), and metabolites (red nodes). (C) Graph representation of subnetworks formed by hubs HGF, and IRF1 that establish direct interaction with seed nodes (STAT1 and SOD2) as observed in the multi-layered graph generated for the severe disease state. The graph highlights the interaction of these hubs with other molecular features including proteins (yellow nodes), transcripts (grey nodes), and metabolites (red nodes). The grey edges represent transcript-transcript interactions, the yellow edges represent protein-protein interactions, the cyan edges represent metabolite-metabolite interactions, the green edges represent protein-transcript interactions and the blue edges represent both protein-metabolite and transcript-metabolite interactions. Compounds for which a matching pure standard was not available for confirmation are denoted by adding an asterisk (*) symbol after the name of the compound.
We identified intra-omics interactions (specifically transcript-transcript and protein-protein) shared between mild-severe and mild-moderate disease state pairs. Notable interactions were among STAT1, interferons (e.g., IFNB1, ISG20) and SOD2. STAT1 is involved in regulating T-cell activation and differentiation responses, thus regulating the pathogenesis of COVID-19. Therefore, associations between STAT1 and T-cell receptors (e.g., CD38, CD40, CD48, CD68) in the mild-severe disease state, may suggest a more efficient role in the immune response to viral infections during mild disease state and higher STAT1 activation in severe disease state contributing to the cytokine storm and hyperinflammation that are characteristic of severe COVID-19 (Hadjadj et al., 2020). Further, interactions between STAT1 and interferons highlight the critical role of STAT1 in the regulation of interferon-stimulated genes, because interferons are key cytokines in the immune response to viral infections. Also, interactions between interferons and other genes (e.g., TNFRSF25, TLR3, MAPK1) involved in interferon-mediated pathways, highlight the likelihood of innate and adaptive immune stimulatory effects.
A distinctive factor for severe-moderate compared to mild-moderate and mild-severe disease state pairs was the cross-layer interactions between protein-metabolite and protein-transcript. Particularly, Hepatocyte Growth Factor (HGF) and Matrix Metallopeptidase 12 (MMP12) interactions with metabolites (e.g., 6-bromotryptophan, cortolone glucuronide, 1-palmityl-2-linoleoyl-GPC, 1-(1-enyl-stearoyl)-2-linoleoyl-GPC, sphingomyelin) and proteins implicated in various cellular processes were highly predominant in the moderate disease state (Figure 4B). On the other hand, HGF cross-layer interaction in the severe disease state was predominant and not MMP12 (Figure 4C) as observed in the moderate disease state.
HGF plays a critical role in tissue repair and regeneration, particularly in the liver and lungs, and has been found to have potential therapeutic effects in COVID-19 due to its ability to reduce lung injury and improve pulmonary function. Studies have shown that COVID-19 patients with severe respiratory symptoms have significantly lower levels of HGF in their blood and that treatment with HGF can reduce lung inflammation and prevent the progression of COVID-19-related lung injury (Xiao et al., 2020). HGF has also been shown to have antiviral effects against the SARS-CoV-2 virus in vitro, suggesting that it may help to inhibit viral replication in infected cells (Quartuccio et al., 2021; Wang et al., 2021). Thus, the observed interactions may suggest a protective role for HGF in ameliorating the progression of COVID-19, as well as a target for drug research (Quartuccio et al., 2021; Wang et al., 2021).
Evidence suggests that both HGF and MMP12 levels are significantly elevated in the lungs of patients with severe disease (Perreau et al., 2021; Salomão et al., 2023). Particularly, elevated MMP12 levels play a role in controlling disease pathogenesis and lung injury, acknowledging that excessively elevated levels can disrupt the balance of the extracellular matrix, resulting in tissue damage (Salomão et al., 2023).
Therefore, the observed cross-layer interactions for HGF and MMP12 in moderate and severe diseases suggest that cross-layer interactions influence clinical heterogeneity, thus influencing the dynamics of disease severity.
Evaluating multi-layered graphs generated using hypothesis-driven seedsIn this section, we evaluated the feature interactions (Supplementary File S2) in the multi-layered graphs (accessible at http://cytoscape.h3africa.org) generated from hypothesis-driven seeds (Table 1).
To begin with, we evaluated the topology of the generated multi-layered graphs. Analysis of the generated multi-layered graphs revealed subnetworks established beyond those formed by the seed nodes, IL6 and IL6R. Specifically, analysis of the multi-layered graph generated for the mild disease state revealed additional subnetworks, beyond those formed by the seed nodes (IL6 and IL6R), involving hubs CCL2, CCL4, and IL7R (Figure 5A). These hubs establish direct interactions with the seed nodes and interactions with other molecular features, including interleukins (e.g., IL13, IL18, IL1A), and chemokines (e.g., CCL3, CCL7, CXCL10). Notable cross-layer interactions for the mild disease state were between IL6 and CCL2 with metabolites involved in various metabolic and inflammatory processes. These include but not limited to, taurine, 1-(1-enyl-palmitoyl)-2-oleoyl-GPC, 1-(1-enyl-palmitoyl)-GPC, 1-(1-enyl-palmitoyl)-GPE, 1-(1-enyl-stearoyl)-2-dihomo-linolenoyl-GPE, proline, 1-(1-enyl-palmitoyl)-GPC, 6-bromotryptophan, 1-margaroyl-GPC, and 1-myristoyl-GPC. This observation may further suggest a more efficient immune response to the virus among patients with mild disease. Specifically, 6-bromotryptophan is a biomarker indicative of COVID-19 severity, which is a finding concurrently echoed in the study by (Krishnan et al., 2021). The 6-bromotryptophan possess antiviral properties that can inhibit viral replication. Moreover, such brominated compounds are understood to exert influence on the immune system, particularly by modulating the kynurenine pathway of tryptophan metabolism, which is involved in regulating immune responses (Krishnan et al., 2021; Cihan et al., 2022; Takeshita and Yamamoto, 2022).
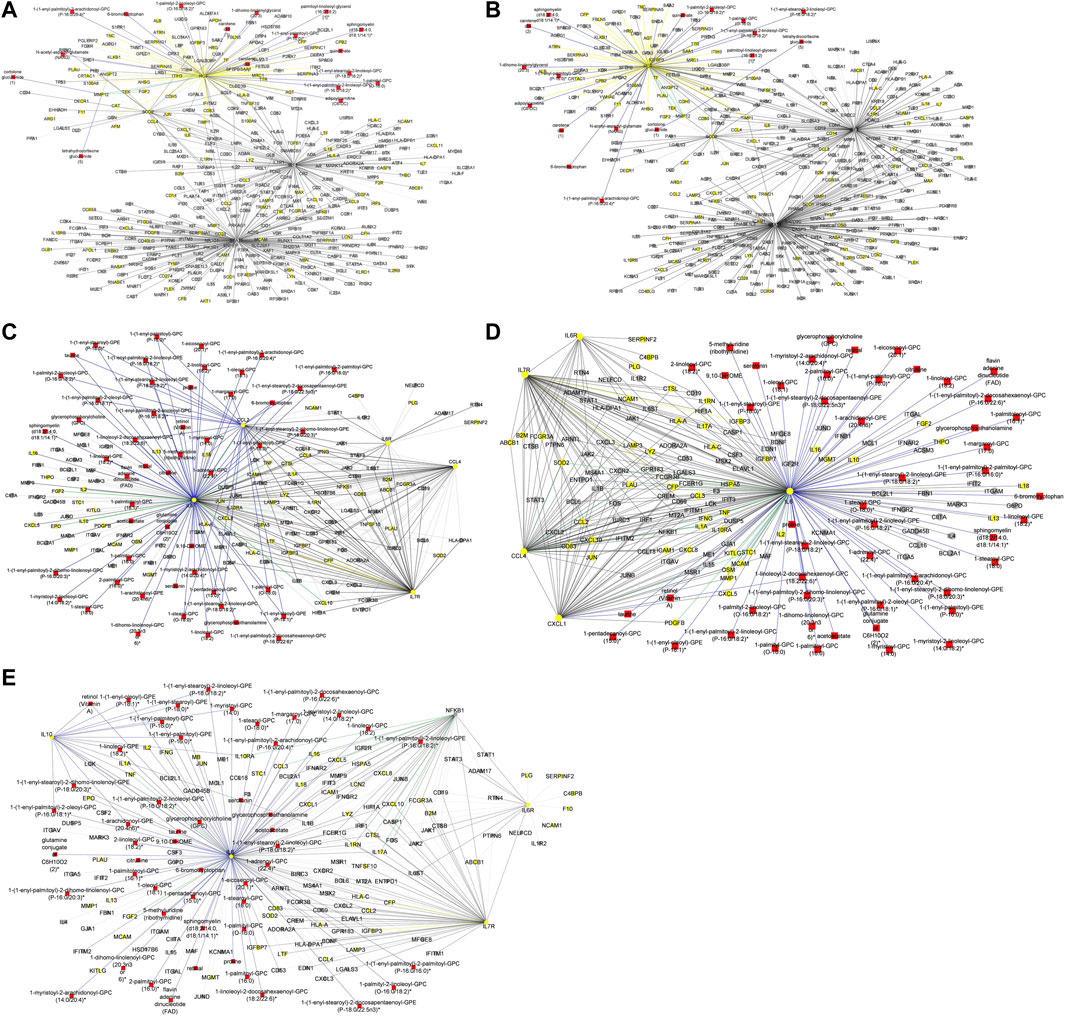
Figure 5. (A) Graph representation of subnetworks formed by hubs CCL2, CCL4, and IL7R, that establish direct interaction with seed nodes (IL6 and IL6R) as observed in the multi-layered graph generated for the mild disease state. The graph highlights the interaction of these hubs with other molecular features including proteins (yellow nodes), transcripts (grey nodes), and metabolites (red nodes). (B) Graph representation of subnetworks formed by hubs IL10, IL7R, and NFKB1, that establish direct interaction with seed nodes (IL6 and IL6R) as observed in the multi-layered graph generated for the moderate disease state. The graph highlights the interaction of these hubs with other molecular features including proteins (yellow nodes), transcripts (grey nodes), and metabolites (red nodes). (C) Graph representation of subnetwork formed by suberoylcarnitine metabolite and the cross-layer interaction with seed nodes (IL6 and IL6R), NFKB1, IL7R, and IL10 hubs. (D) Graph representation of subnetworks formed by hubs IL7R, CCL4, and CXCL1, that establish direct interaction with seed nodes (IL6 and IL6R) as observed in the multi-layered graph generated for the severe disease state. The blue edges represent protein-metabolite and transcript-metabolite interactions, the green edges represent protein-transcript interactions, the grey edges represent transcript-transcript interactions and, the yellow edges represent protein-protein interaction. (E) Graph representation of subnetwork formed by sphingomyelin (d18:2/21:0, d16:2/23:0) and the cross-layer interaction with seed nodes, IL6 and IL6R, and hubs IL7R, CCL4, IL6R, and CXCL1 as observed in the multi-layered graph generated for the severe disease state. The grey edges represent transcript-transcript interactions, the yellow edges represent protein-protein interactions, the cyan edges represent metabolite-metabolite interactions, the green edges represent protein-transcript interactions and the blue edges represent both protein-metabolite and transcript-metabolite interactions. Compounds for which a matching pure standard was not available for confirmation are denoted by adding an asterisk (*) symbol after the name of the compound.
Our analysis of the multi-layered graph generated for the moderate disease state revealed new subnetworks formed by hubs IL10, IL7R, and Nuclear Factor Kappa B Subunit 1 (NFKB1). These hubs directly interact with the seed nodes (IL6 and IL6R), but also with chemokines (e.g., CCL4, CXCL5, CXCL8) and other biosignatures such as HLA-C, TNF, IFNG, and IFNAR2, indicating a more complex interplay of immune cell recruitment and activation (Figure 5B). We also observed cross-layer interactions between IL10 and IL6, and their connections to specific metabolites. Particularly, the cross-layer interactions involving IL10 indicate a potential link between the immune and metabolic responses in moderate disease, suggesting a potential
留言 (0)