
記住我


Late-onset Alzheimer’s disease (LOAD) is a progressive neurological disorder that affects more than 5 million elderly in the United States (Matthews et al., 2019). Currently, there are no effective drugs that can permanently prevent the progression of Alzheimer’s disease (AD)-associated cognitive decline. Previously, members of our team at Mount Sinai used multiscale causal network-based approaches to identify the dual specificity protein phosphatase 6 (DUSP6), also known as mitogen-activated protein kinase (MAPK) phosphatase 3 (MKP3), as a key hub in the VGF gene network that regulates AD (Beckmann et al., 2020). DUSP6 is a member of the dual specificity protein phosphatase (DUSP) family that regulates MAPK activity (Chen et al., 2019). MAPK signaling pathways are involved in many cellular processes, including inflammation (Manzoor and Koh, 2012), and AD pathogenesis and progression in brain is associated with and potentially driven by immunological mechanisms, including the upregulation of disease-associated microglial (DAM) genes (Sobue et al., 2021).
Neuroinflammation is a double-edged sword, as it is hypothesized to be either protective or detrimental, perhaps depending on disease stage (Castranio et al., 2023). Microglia are the innate immune cells of the brain, responsible for maintenance of brain homeostasis through the detection and elimination of harmful stimuli. However, activation of microglia in a disease state can exert both injurious and favorable effects in context-dependent manners. MAPKs, including extracellular signal-regulated kinase (ERK), c-Jun N-terminal kinase (JNK), and p38, are involved in the regulation of early immune responses through serial phosphorylation events (Cargnello and Roux, 2011), which are involved in cellular proliferation and inflammation and are usually transient, while prolonged activation can lead to chronic inflammatory microglial responses (Kim et al., 2004) that can be damaging. Phosphoproteomic analysis of microglia, isolated from 5xFAD mice, show a significant increase of phosphorylated ERK (Chen et al., 2021), suggesting an imbalance in MAPK signaling. DUSPs, including DUSP6, are involved in maintaining the homeostatic level of phosphorylated ERK. DUSP6 is a cytoplasmic MAPK phosphatase that has high selectivity for extracellular signal-regulated kinases 1 and 2 (ERK1/2), which is associated with the high affinity binding of its N-terminal kinase-interacting motif (KIM) to ERK1/2 (Arkell et al., 2008). DUSP6 is downregulated in several neurological and neuropsychiatric diseases including AD (Banzhaf-Strathmann et al., 2014), schizophrenia (Kondo et al., 2022), and major depressive disorder (Labonte et al., 2017), the latter frequently co-morbid with AD (Martín-Sánchez et al., 2021; Arnaud et al., 2022).
Amyloid plaques and neurofibrillary tangles (NFTs) are the pathological hallmarks of AD. Microglia are involved in clearance of aggregated proteins, including amyloid beta (Aβ), through phagocytosis. The exact mechanisms involved in the phagocytosis of amyloid plaques by microglia are not fully understood. Microglia recognize Aβ through triggering receptor expressed on myeloid cells 2 (TREM2). Binding of Aβ to TREM2 enhances the interaction of TREM2 with its adaptor TYROBP, which induces downstream signaling and promotes microglial clearance of amyloid plaques (Zhao et al., 2018). TREM2 and phosphorylated ERK (pERK) levels are increased in microglia acutely isolated from the 5xFAD AD mouse model, and pERK is an upstream regulator of DAM gene expression including Trem2 and Tyrobp (Chen et al., 2021). Interestingly, DUSP6 overexpression has been demonstrated to protect against Aβ-induced neural stem cell injury, including against oxidative and ER stress and mitochondrial dysfunction, and to reverse Aβ-induced ERK1/2 activation (Liao et al., 2018).
We investigated the role that DUSP6 plays in AD pathogenesis and progression, determining the effects of adeno-associated virus (AAV)-mediated hippocampal DUSP6 overexpression in 5xFAD mice on AD-related behavioral, neuropathological, and transcriptomic phenotypes. DUSP6 overexpression improved spatial memory, decreased plaque load, and decreased BACE1 expression only in male 5xFAD mice. Reduced hippocampal microglial activation and msh homeobox 3 (Msx3) gene expression were observed in male and female 5xFAD overexpressing DUSP6 (5xFAD-DUSP6), while transcriptomic profiling of female 5xFAD further demonstrated that DUSP6 overexpression downregulated neuroinflammatory and ERK/MAPK signaling pathways. Gene ontology (GO) analysis of differentially expressed genes showed that DUSP6 regulated more pathways associated with synaptic structure and function in male 5xFAD-DUSP6 than in female 5xFAD-DUSP6. Our findings suggest that DUSP6 may function in sex-specific and shared pathways to regulate neurodegeneration, neuroinflammation, and synaptic function in the 5xFAD mouse model.
2 Materials and methods 2.1 Animal studies5xFAD transgenic mice that overexpress human APP (695) with Swedish (K670N, M671L), Florida (I716V) and London (V717I) familial AD (FAD) mutations and human Presenilin1 (PS1) with the M146L and L286V FAD mutations (Oakley et al., 2006) were purchased from Jackson Labs (Bar Harbor, ME; JAX#34840) and were maintained on a mixed B6/SJL genetic background as described (Beckmann et al., 2020). Female and male wild-type (WT) and 5xFAD mice at 4 months of age were stereotactically infused using a twenty-five gauge needle (Hamilton, Reno, NV) with 1.0 μL of AAV5-GFP or AAV5-DUSP6 (4 × 10¹²vg/ml) into dorsal hippocampus (dHc) (AP = −2.0 mm, ML = ±1.5 mm, and DV = −2.0 mm relative to Bregma) at a rate of 0.2 μL per minute. Data obtained from female and male WT and 5xFAD mice overexpressing GFP, used in this study, were previously published in an analysis of DUSP4 overexpression, and all were co-sequenced with those from DUSP6 overexpressing mice to avoid batch effects (Pan et al., 2022). AAV5-injected mice were allowed to recover for a month before behavioral testing. AAV5-GFP (control), and AAV5-DUSP6 (VectorBuilder Inc., Chicago, IL; AAV-5′ITR-CAG-mDUSP6-WPRE-BGHpA-3′ITR) (AAV5 serotype/AAV2 genotype) were prepared by the Vector Core at the University of North Carolina at Chapel Hill. All mice were housed under standard conditions (12 h light-dark cycle with ad libitum access to food and water). All experimental procedures were conducted in accordance with the NIH guidelines for animal research and were approved by the Institutional Animal Care and Use Committee (IACUC) at the Icahn School of Medicine at Mount Sinai (ISMMS).
2.2 Barnes maze testingThe Barnes maze test was performed using a standard apparatus (Barnes, 1979), as described (Audrain et al., 2019). Briefly, 5-month-old 5xFAD or WT mice were habituated in the testing room for 30 min prior to the test. Then the mice were transferred to the center of the platform using a closed chamber where they remained for 10 s prior to exploring the maze for 3 min. Any mice that failed to enter the escape box within 3 min were directed to the escape box by the experimenter, and the latency was recorded as 180 s. Mice were allowed to remain in the escape box for 1 min before being transferred back to their cages. After each test, the platform and the escape box were cleaned with 70% ethanol to eliminate the use of olfactory cues to locate the target hole. Two trials were conducted, and all trials were recorded by video camera and analyzed with ANY-maze video tracking software (Stoelting Co, Wood Dale, USA).
The Barnes maze data for 5xFAD and WT mice overexpressing GFP used in this study were previously published in our DUSP4 overexpression paper (Pan et al., 2022). These mice were analyzed in the same Barnes maze test with those overexpressing DUSP6 that are reported here.
2.3 Tissue collection and sample preparationTwo days after the final behavioral test, mice were transcardially perfused with 20 mL ice-cold phosphate buffered saline (PBS). The right hemisphere was fixed in 4% PFA for 24 hr followed by incubation in 30% sucrose until the brains sunk to the bottom. Then the brains were cut into 30 μm coronal sections by a cryostat (Leica). The contralateral hemisphere was dissected to isolate dHc, which was cut symmetrically in half. Half of the dHc was homogenized in RIPA buffer (Millipore Sigma) containing phosphatase (Roche) and protease (Roche) inhibitors, centrifuged for 20 min at 15,000 × g and the supernatant was collected, while the other half was used for RNA extraction employing the RNeasy Mini Kit (Qiagen).
2.4 RNA extraction and quantitative real-time PCR analysisThe QIAzol® Lysis Reagent (Qiagen) and the miRNeasy® Mini Kit (Qiagen) were used to extract RNAs from hippocampi following the manufacturer’s instructions. The purities and the concentration of the RNA extracts were determined by NanoDrop 2000c (ThermoFisher Scientific). A high-capacity RNA-to-cDNA™ kit (Applied Biosystems, 4387406) was used to reverse transcribe the total RNA into cDNA in a 20 μl reaction volume using the thermal cycler (T100, Bio-Rad). The QuantStudio 7 Flex Real-Time PCR System (Applied Biosystems) was used for Real-time PCR reactions with the Maxima SYBR Green/ROX qPCR Master Mix (ThermoFisher Scientific, K0221). Reactions were carried out in duplicate in 384-well plates (Applied Biosystems) according to the manufacturer’s three-step cycling protocol. The relative gene expression of each transcript was normalized to the reference gene Gapdh with the ΔCt method. The sequences of oligonucleotides used are:
Gapdh 5′-AACGACCCCTTCATTGACCT-3′ and
5′-TGGAAGATGGTGATGGGCTT-3′,
Dusp4 5′-CCTGCTTAAAGGTGGCTATGAGA-3′ and
5′-GGTGCTGGGAGGTACAGGG-3′,
Dusp6 5′-CTCGGATCACTGGAGCCAAAAC-3′ and
5′-TCTGCATGAGGTACGCCACTGT-3′,
Vgf 5′-CGAAGAAGCAGCAGAAGCTC-3′ and
5′-TCGAAGTTCTTGGAGCAAGG-3′,
Sst 5′-CCGTCAGTTTCTGCAGAAGT-3′ and
5′-CAGGGTCAAGTTGAGCATCG-3′,
Bdnf 5′-GAAGAGCTGCTGGATGAGGAC-3′ and
5′-CGAGTTCCAGTGCCTTTTGTC-3′,
Scg2 5′- AGGGTTGACGAGGAACAAA-3′ and
5′-CTGGACTGGGCACTCTCTTC-3′,
Mouse Ps1 5′-CAAAAACAGAGAGCAAGCCC-3′ and
5′-TCTCTCAAGTCACTGAGGGACA-3′,
Human PS1 5′-GCAGTATCCTCGCTGGTGAAGA-3′ and
5′-CAGGCTATGGTTGTGTTCCAGTC-3′,
Ps2 5′-CTGGTGTTCATCAAGTACCTGCC-3′ and
5′-TTCTCTCCTGGGCAGTTTCCAC-3′,
Adam10 5′-TAAGGAATTATGCCATGTTTGCTGC-3′ and
5′-ACTGAACTGCTTGCTCCACTGCA-3′,
Adam17 5′-TTGGAGCAGAACATGACCCTGATGG-3′ and
5′-TGCAGCAGGTGTCGTTGTTCAGGTA-3′,
Bace1 5′-TCTTTTCCCTGCAGCTCTGT-3′ and
5′-ACTGCCCGTGTATAGCGAGT-3′
Nct 5′-CCAAGCTTCCCATTGTGTGC-3′ and
5′-TGCTGAAGGTGCTCTGGATG-3′
Aph1a 5′- GTGCTGCTGTCTCTGTCCTT-3′ and
5′-TCTGTCGGATGGAGATGGGT-3′
Aph1b 5′- CTGGGGCGTTGTGTTCTTTG-3′ and
5′-AAATGCCCAGATGCCCATGA-3′
Aph1c 5′-TTCCTCATCGCTGGTGCTTT-3′ and
5′-CGCTCCGAAGATGAGCAGAT-3′
Cd68 5′-TCCAAGCCCAAATTCAAATC-3′ and
5′-ATGGGTACCGTCACAACCTC-3′
Aif1 5′-GTCGCACTCAGCAACAGG-3′ and
5′-ACTTCTGGTCACAGAGGAACTC-3′
Human APP 5′-GTGGCATTCTTTTGGGGCTG-3′ and
5′-GAACCTGGTCGAGTGGTCAG-3′
Mouse APP 5′-TCCGTGTGATCTACGAGCGCAT-3′ and
5′-GCCAAGACATCGTCGGAGTAGT–3′
RT-PCR data for the following VGF network genes (Dusp4, Dusp6, Sst, Bdnf, mouse Ps1, human Ps1, and Ps2) and the following APP processing enzyme genes (Adam10, Bace1, Nct, Aph1a, Aph1b, and Aph1c), analyzing RNA levels in 5xFAD and WT overexpressing GFP, were previously published with our DUSP4 overexpression RT-PCR data (Pan et al., 2022), all of which were analyzed in the same RT-PCR assay with the DUSP6 data reported here.
2.5 ImmunohistochemistryCoronal sections (30 μm thickness) from dHc were first washed with PBS, and then incubated with the following primary antibodies in 0.1% Triton X-100 in PBS overnight at 4°C: anti-DUSP6 (1:1,000, Abcam; ab76310); anti-Aβ (1:1,000, 6E10, Biolegend, 803001); anti-GFAP (1:1000, Abcam, ab53554); anti-NeuN (1:1000, Invitrogen, MA5-33103), or anti-IBA1 (1:1,000, Fijifilm, 019-19741). On the second day, sections were rinsed with PBS and incubated for 1 h at room temperature with appropriate secondary antibodies: anti-rabbit Alexa Fluor IgG 488 or 568 (1:1,000, Invitrogen) and anti-mouse IgG Alexa 488 (1:1000, Invitrogen). Then sections were then washed with PBS, and were allowed to dry before mounting with Hardset Vectashield plus DAPI mounting medium (Vector Laboratories, H1500) and sealed with coverslips. Thioflavin S (Sigma-Aldrich, T1892, 1% w/v stock solution) was used for labeling amyloid deposits. Images were acquired by Nikon Eclipse TE 200 and Zeiss LSM 780 microscopes. The images were captured with constant parameters, and the quantification of images was conducted by an operator blinded to the treatment groups. Staining was analyzed by Fiji software (ImageJ, v2.1.0) at the same threshold setting for each immunostained marker.
For microglial number, IBA1-immunolabeled sections were thresholded and particles were analyzed by Fiji (ImageJ, v2.1.0). A “microglial cluster” was counted when three or more microglial somas occurred within, or touching the margins of, a 20 μm2 virtual graticule subregion in the hippocampal region (Paasila et al., 2020). IBA1-immunolabeled sections and Aβ-immunolabeled sections were prepared from separate slices obtained from the same 5xFAD mice and hippocampal region with Aβ presence. Microglial clusters were counted only in the 568 nm (IBA1-positive) channel to minimize the false-positive counts in the presence of Aβ.
2.6 Colocalization of DUSP6 with neuronal, microglial, or astrocytic markers via confocal microscopyNeuN (neuron), IBA1 (microglia), or GFAP (astrocyte) was co-stained with DUSP6 in hippocampal brain sections, as described above. Colocalization was analyzed by JACoP plugin in Fiji (ImageJ, v2.1.0). The output of colocalization was calculated using thresholded Manders’ correlation coefficient of global statistical analysis, considering pixel intensity distributions. At least 4 brain sections from each animal were analyzed, and the percentage of the fraction of DUSP6 in the neurons, microglia, or astrocytes was expressed as the mean ± standard error of the mean (SEM).
2.7 Quantification of amyloid plaque loadHippocampal amyloid plaques were quantified based on mean gray value of percentage thresholded area. The total numbers of amyloid plaque clusters from each brain section were manually counted using Fiji software (ImageJ, v2.1.0). The results are represented as 6E10 intensity or number of plaques in dHc. The image quantification of 6E10 was performed by an operator blinded to the treatment groups. Thioflavin S-labeled plaque number and size in hippocampi were analyzed by Fiji software (ImageJ, v2.1.0) as described (Christensen and Pike, 2020).
2.8 Aβ assays by ELISAHippocampal Aβ1–40 and Aβ1–42 from RIPA-extracted supernatants were quantified by human/rat Aβ1–40/1–42 ELISA kits (Wako, #294-64701, #290-6260) following the manufacturer’s instructions. Absolute concentrations of Aβ were normalized to the initial tissue weight.
2.9 Western blottingProtein samples were resolved by electrophoresis on 4–12% Bis-Tris gels (Bio-Rad) and were transferred to polyvinylidene difluoride membranes using the iBlot system (Invitrogen). Membranes were then blocked in Odyssey blocking buffer for 1 h at room temperature before incubation with the following primary antibodies in blocking buffer (Odyssey) and 0.1% Tween-20 at 4°C overnight: anti-DUSP6 (1:1,000, Abcam; ab76310); anti-BACE1 (1:1,000, Abcam; ab2077); or anti-Aβ (1:1,000, Biolegend, 803001). Membranes were washed the next day with 0.1% Tween-20 in PBS followed by incubation in a mixture of secondary antibodies: goat anti-rabbit 800CW (1:15,000, LI-COR, Lincoln, NE) and goat anti-mouse 680LT (1:20,000, LI-COR, Lincoln, NE) in Odyssey blocking buffer with 0.1% Tween-20 and 0.01% SDS at room temperature for 1 hr. After the incubation, the membranes were washed with 0.1% Tween-20 in PBS and then were washed with PBS. After the final wash with PBS, the membranes were analyzed using an Odyssey infrared imager (LI-COR, Lincoln, NE). Bands were quantified using Odyssey Imager analysis software and were normalized using β-actin as an internal loading control.
2.10 RNA sequencing and differential expression analysisMouse hippocampal RNA samples were sequenced by Novogene for transcriptomic profiling using Illumina Novaseq 6000 S4 flow cells. RNA quality of each sample was assessed and only the samples with RNA integrity number (RIN) > 9 were included. Non-directional libraries were constructed with an NEB kit using the manufacturer’s protocol. RNA sequencing assays were performed after ribosomal RNA depletion by Ribo-Zero. RNA reads were aligned to the mm10 reference genome using STAR (Dobin et al., 2013) (version 2.7.5b) to obtain the raw counts for each gene. Differential expression analysis was performed in R (version 3.6.3) using edgeR (Robinson et al., 2010). Genes with counts per million reads (cpm) > 1 in at least 5 samples were included for further analysis. Differentially expressed genes with FDR < 0.05 were considered statistically significant in each comparison.
Transcriptomic data for WT and 5xFAD overexpressing GFP were previously published with our DUSP4 overexpression dataset (Pan et al., 2022), all of which were sequenced in the same batch with the DUSP6 transcriptomics reported here.
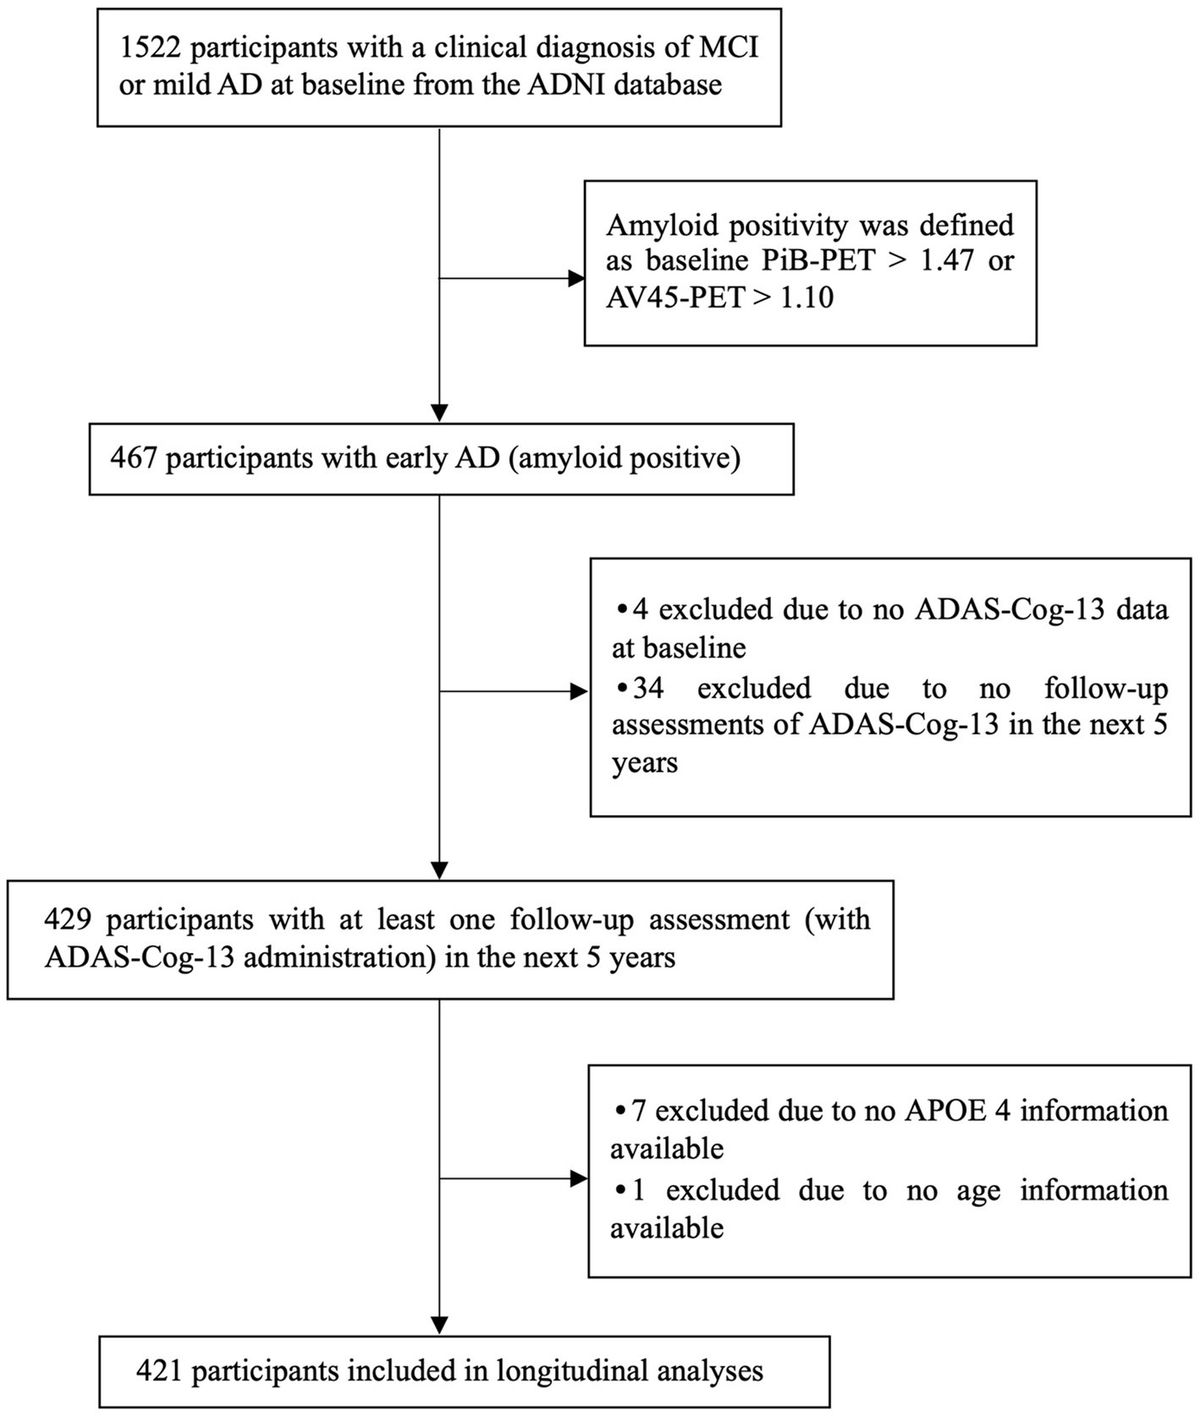
2.11 Human brain data analysis methodsThe expression patterns of DUSP6 genes in human AD brains, with a sample size of 82-133 per sex, were analyzed using our recently published RNA-seq data in the hippocampal gyrus (PHG) region of postmortem brains of AD and controls from the Mount Sinai Brain Bank (MSBB) (Wang M. et al., 2018; Wang et al., 2021). Here we used the preprocessed data which had been normalized and corrected for known covariates, except sex which was excluded from the covariate correction. The gender-specific gene expression distribution stratified by clinical dementia rating (CDR) scale were presented using boxplots. In addition, we calculated the Spearman correlation coefficients between gene expression values and CDR scale in males and females, separately.
2.12 Analysis of the University of California, Irvine (UCI) 5xFAD mouse RNA-seq dataThe raw RNA-seq data from hippocampus of 4, 12 and 18 month old 5xFAD mice were obtained from the AMP-AD Portal (2021). Details about the sample processing, library construction and sequencing are available at SYNAPSE (AMP-AD Portal, 2021).
Paired-end 43bp sequencing reads were aligned to mouse reference genome mm10 using STAR aligner v2.5.3a (Dobin et al., 2013) guided by a customized mouse GENCODE gene model release v15. Mapped reads were summarized to gene levels using the featureCounts program v1.6.3 (Liao et al., 2014). Raw count data were normalized as counts per million (CPM) at the log2 scale by the voom function in the R limma package (Ritchie et al., 2015). Expression patterns of Dusp6 were visualized per age-genotype-gender combinations by boxplot. The expression difference between 5xFAD and age-gender-matched control was calculated by one-sided t-test.
2.13 Differentiation of hiPSCs to microglial cellshiPSC-derived microglial cells were generated using defined conditions with several modifications to the previously published protocol (Mancuso et al., 2019; Fattorelli et al., 2021). All hiPSC lines with a normal karyotype were regularly checked and confirmed negative for mycoplasma. hiPSCs, maintained in complete mTeSR1 medium (StemCell Technologies) according to WiCell protocols, were dissociated by Accutase (Thermo Fisher Scientific) to obtain a single-cell suspension. Approximately 10,000 cells were plated in each well of an ultra-low-attachment 96-well plate (Corning) in complete mTeSR1 medium supplemented with human BMP4 (50 ng/mL), human VEGF (50 ng/mL), human SCF (20 ng/mL) and 10 μM Rho-associated protein kinase inhibitor (ROCKi, Selleck Chemicals). Embryoid bodies were fed every day from day 1 to day 3, then transferred to 6-well plates (Corning) in the differentiation media containing X-VIVO 15 media (LONZA), 2 mM GlutaMAX, 50 U/mL of penicillin-streptomycin, 0.055 mM 2-mercaptoethanol, and supplemented with human SCF (50 ng/mL), human M-CSF (50 ng/mL), human IL3 (50 ng/mL), human FLT3 (50 ng/mL) and human TPO (5 ng/mL). After 4 days, embryoid bodies were fed with the same differentiation media. On differentiation day 11, a full medium change was performed and embryoid bodies were maintained in differentiation media plus human FLT3 (50 ng/mL), human M-CSF (50 ng/mL) and human GM-CSF (25 ng/mL). On day 18, floating microglial progenitors in the medium were collected and cultured in RPMI 1640 medium (Thermo Fisher Scientific) containing 2 mM GlutaMAX, 50 U/mL of penicillin-streptomycin, 10 ng/mL GM-CSF and 100 ng/mL IL-34 for 2 weeks in order to generate mature microglial cells. All cytokines were purchased from R&D Systems.
2.14 Cortical neuron differentiation from human induced pluripotent stem cells (hiPSCs)hiPSC-derived cortical neurons were generated as described (Chambers et al., 2009; Qi et al., 2017). hiPSCs were dissociated with Accutase and plated at 200,000 cells per cm2 onto Matrigel-coated plates in complete mTeSR1 medium with ROCKi (10 μM). After 1–2 days when cells were 100% confluent, the medium was replaced with differentiation media (DMEM/F12:Neurobasal (1:1), 2 mM GlutaMAX, 1% N2 supplement, 2% B27 minus Vitamin A supplement) containing LDN193189 (100 nM, Stemgent), SB431542 (10 μM, Selleck Chemicals) and XAV939 (1 μM, Tocris) for 10 days of differentiation. Cultures were fed with differentiation media with XAV939 (1 μM) for an additional week to allow the expansion of neural progenitor cells. Neural progenitor cells were then dissociated and replated on poly-l-ornithine/fibronectin/laminin-coated plates and maintained in BrainPhys Basal medium (StemCell Technologies) containing B-27 supplement, BDNF (40 ng/mL, R&D Systems), GDNF (40 ng/mL, R&D Systems), Laminin (1 μg/mL, Life Technologies), L-Ascorbic acid (200 μM, Sigma), dbcAMP (250 μM, Sigma), for neuronal differentiation and maturation, with the addition of SU5402 (10 μM, Selleck Chemicals), DAPT (10 μM, Tocris) and PD0325901 (10 μM, Selleck Chemicals) for the first week of differentiation.
2.15 RNA in situ hybridizationBrain sections (30 μm) were used in RNA in situ hybridization (RNAscope®). RNAscope® fluorescent in situ hybridization (FISH) was performed according to the manufacturer’s instructions (Advanced Cell Diagnostics, Inc.). Briefly, Dusp6 and NeuN mRNAs of the mounted sections were probed with Mouse Dusp6 (Advanced Cell Diagnostics, 429321-C2-R) and Rbfox3-C4 (Advanced Cell Diagnostics, 313311-C4) from ACD at 1:50 dilution. Then the microglial cells were detected by rabbit anti-IBA1 antibody (Fujifilm Wako Chemicals, 01919741) and secondary Alexa Fluor 488 anti-rabbit antibody. Finally, the slides were sealed with Hardset Vectashield plus DAPI mounting medium (Vector Laboratories, H1500). Images were obtained by Zeiss LSM 780 microscopy.
2.16 StatisticsGraphs represent the mean of all samples in each group ± SEM. Sample sizes (n values) and statistical tests are indicated in the figure legends. One-way or two-way ANOVA was used for multiple comparisons. A Student’s t-test was used for simple comparisons. Significance is reported at *p < 0.05, **p < 0.01, ***p < 0.001, and ****p < 0.0001.
3 Results 3.1 DUSP6 gene expression is decreased in human AD and 5xFAD hippocampusTo determine DUSP6 gene expression patterns in human AD brains, we used our recently published RNA-seq data from the hippocampal gyrus (PHG) region of postmortem brains of AD subjects and controls from the Mount Sinai Brain Bank (MSBB) (Wang M. et al., 2018; Wang et al., 2021). The Spearman correlation coefficients showed that the downregulation of DUSP6 gene expression is correlated with increased clinical dementia rating (CDR) scores in both sexes (Figure 1A). Although our current and published studies with manipulation of DUSP expression (El Gaamouch et al., 2020) utilize 5xFAD mice on a mixed B6/SJL genetic background, the availability of raw RNA-seq data (AMP-AD portal) from 5xFAD mice on a congenic C57BL/6J genetic background allowed us to determine hippocampal Dusp6 gene expression at 4, 12, and 18 months of age (Figure 1B). Both female and male 5xFAD mice showed a significant decrease in hippocampal Dusp6 expression at 4 and 12 months of age, which normalized by 18 months of age (Figure 1B).
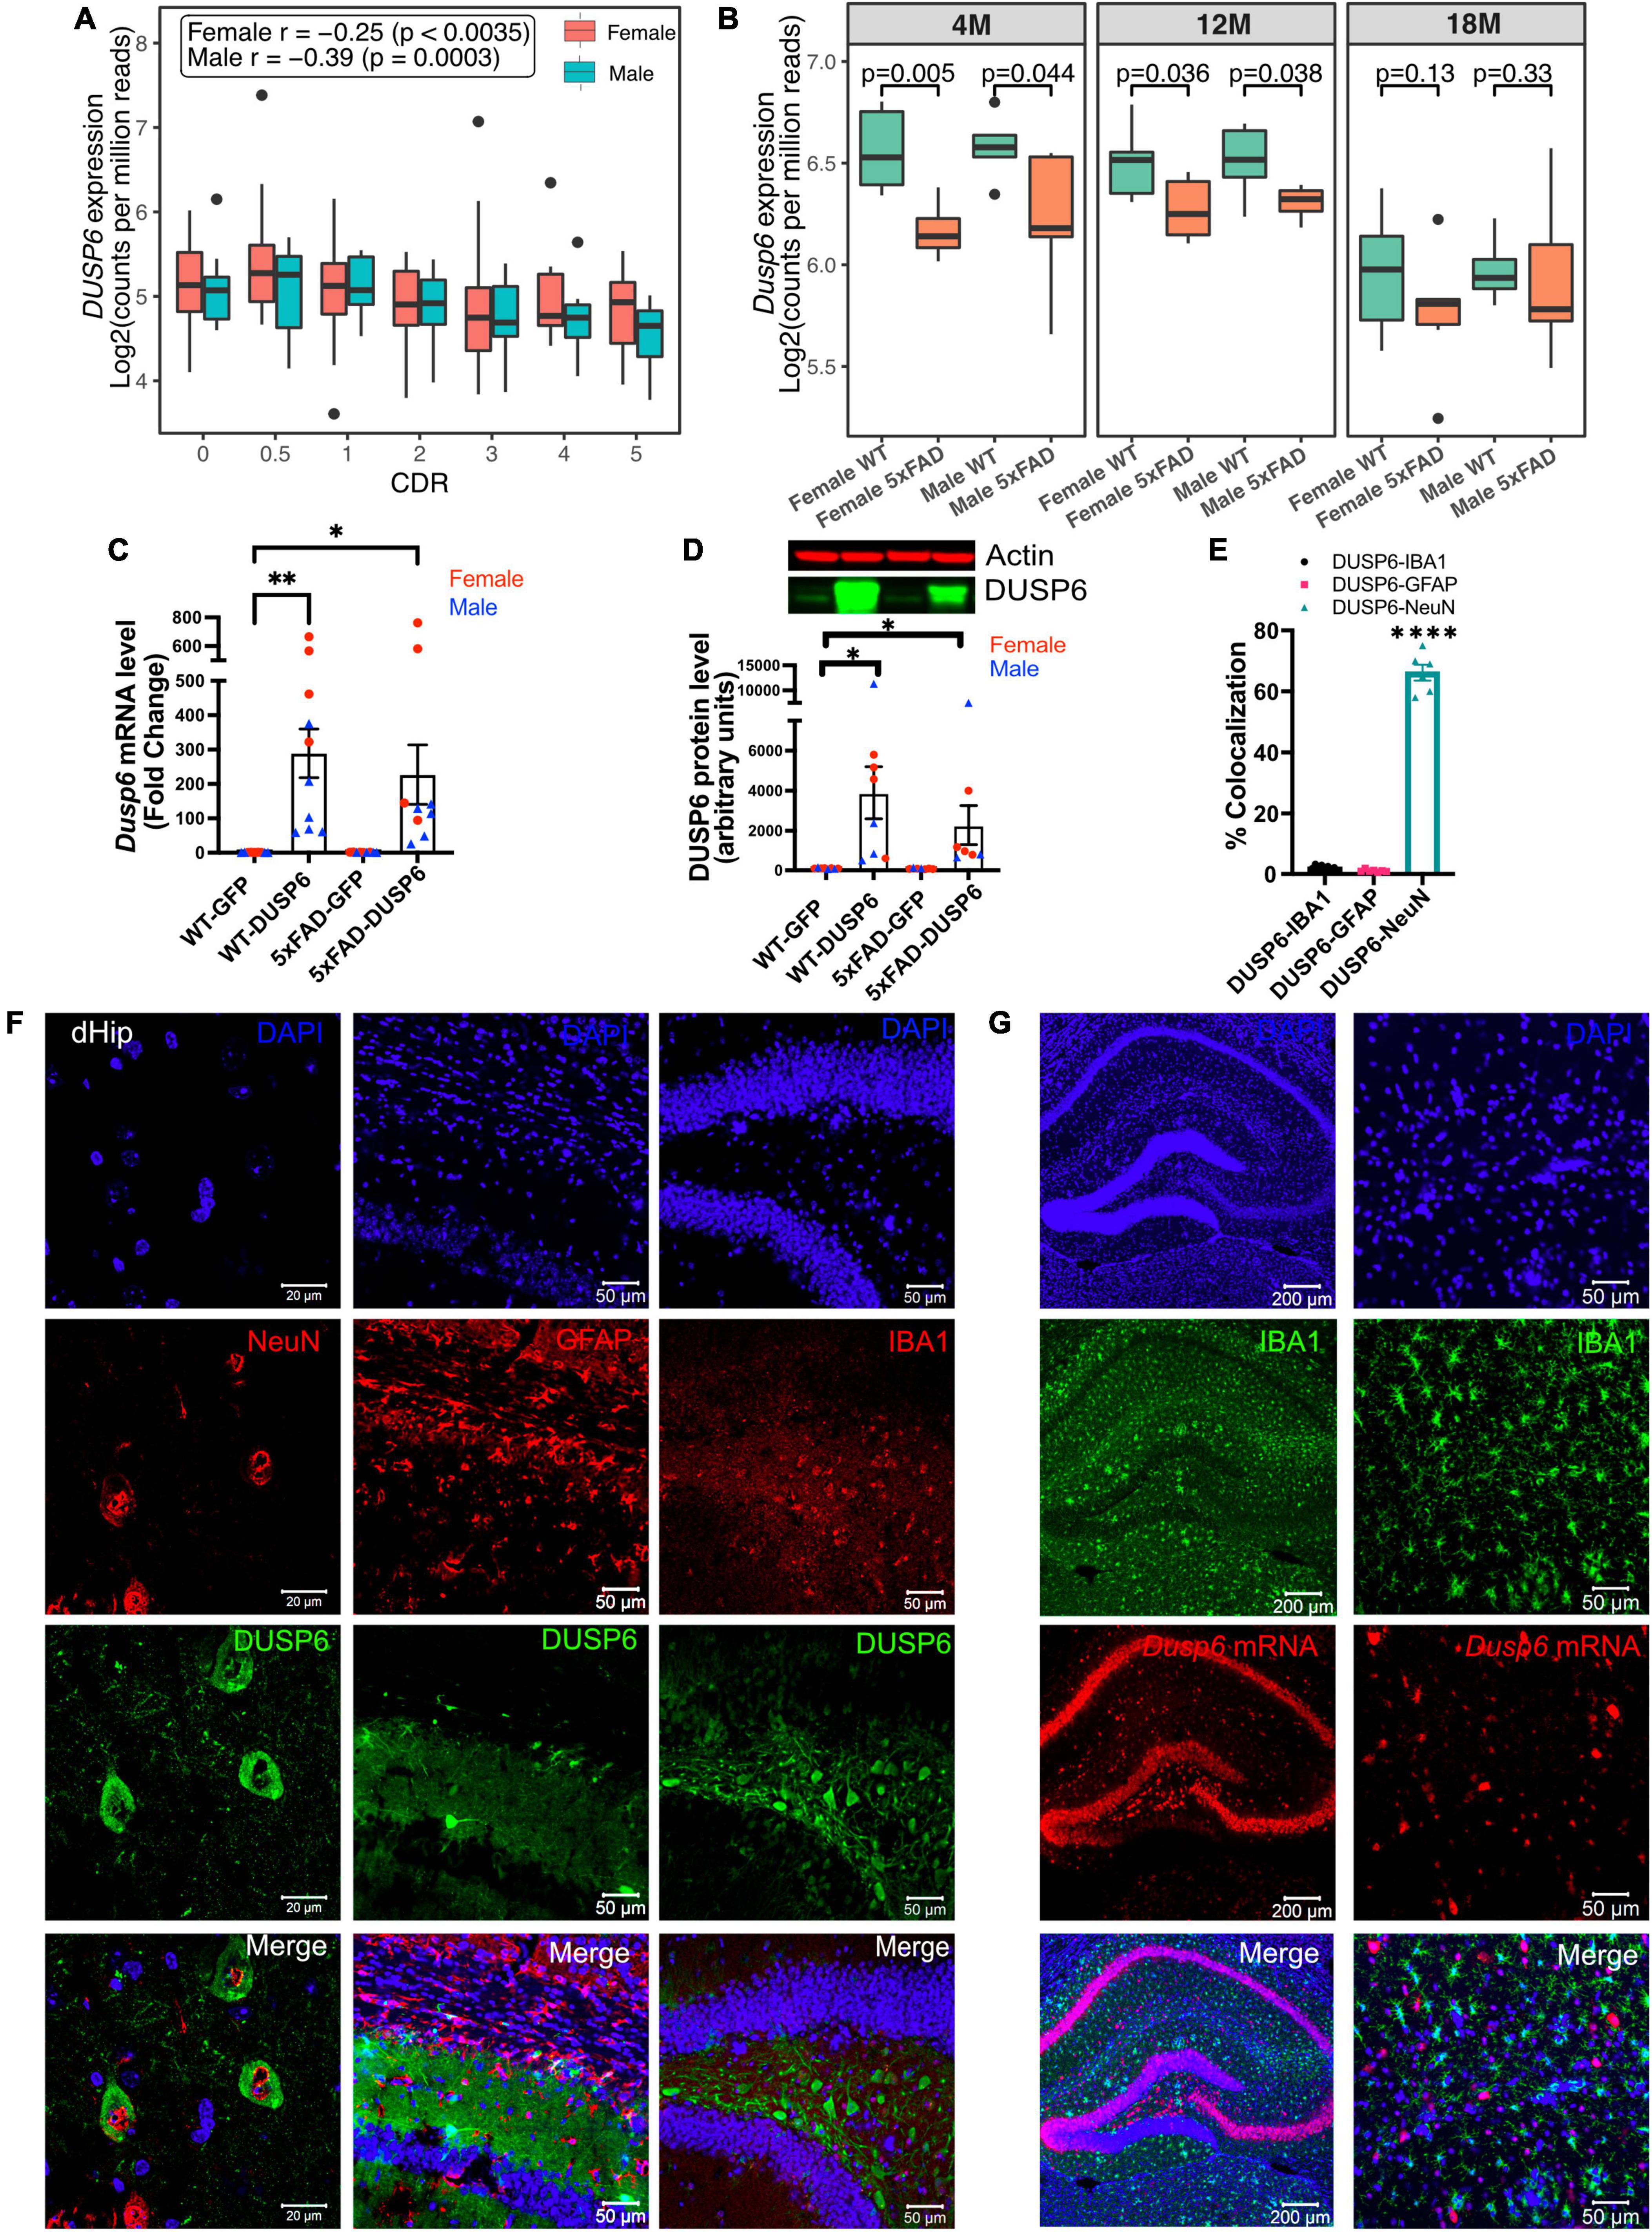
Figure 1. AAV5-mediated overexpression of DUSP6 in dorsal hippocampus (dHc) of 5-month-old 5xFAD and WT mice. (A) Boxplot shows expression of hippocampal DUSP6 mRNA [Log2(counts per million reads)] in AD postmortem brain samples from the Mount Sinai Brain Bank (MSBB) stratified by clinical dementia rating CDR; r, Spearman’s correlation coefficient. n = 82–133/sex. (B) Boxplots compare the expression of hippocampal Dusp6 mRNA among female and male 5xFAD and WT mice at different ages using RNAseq data obtained from the AMP-AD portal (see 2 Materials and methods). n = 4–16/sex/age. (C) RT-PCR and (D) western blot analyses of DUSP6 overexpression in 5xFAD and WT, n = 9–10 mice/group. (E) Graph shows percentage of colocalization using Mander’s correlation coefficient, and the thresholded Mander’s M-values corresponding to the fraction of DUSP6 in NeuN (neurons), IBA1 (microglia), or GFAP (astrocytes) analyzed by the JACoP plugin from ImageJ, n = 6–9 mice/group. (F) Co-staining NeuN (left), GFAP (middle), or IBA1 (right) with DAPI and DUSP6 in hippocampi of WT-DUSP6 mice. (G) RNA scope images of IBA1 protein and Dusp6 mRNA in hippocampi of WT-DUSP6. Scale bars = 20, 50, or 200 μm. Error bars represent means ± SEM. Statistical analyses were performed using a one-way ANOVA followed by a Tukey’s post-hoc test, *p < 0.05, **p < 0.01, ****p < 0.0001.
Utilizing proteinatlas.org and brainrnaseq.org to determine cell-type specific expression of DUSP6 mRNA in human and mouse brain, we found that DUSP6 mRNA was most abundant in endothelial cells, and was additionally expressed in neurons, astroglia, and microglia (Supplementary Figure 1A). Consistent with these data, we detected DUSP6 mRNA in cultured human iPSCs differentiated into either microglia or neurons (Supplementary Figure 1B). To determine whether overexpression of DUSP6 in the 5xFAD mouse model rescued AD-related phenotypes and neuropathology, we stereotactically infused AAV5-DUSP6 or AAV5-GFP (control) into dHc at 4 months of age. Western blot and RT-qPCR analyses confirmed the overexpression of DUSP6 protein and mRNA in WT or 5xFAD mice administered AAV-DUSP6 (Figures 1C, D). To determine in which cell type(s) DUSP6 was overexpressed, we quantified the colocalization of cell-type specific markers IBA1 (microglia), NeuN (neurons), or GFAP (astrocytes), with DUSP6, which showed that overexpressed DUSP6 co-localized with NeuN, but not with GFAP or IBA1 (Figures 1E, F). RNA scope additionally confirmed that AAV-mediated DUSP6 mRNA was not expressed in microglia (Figure 1G) or astrocytes (data not shown). Overexpression of DUSP6 detected predominantly in neurons is consistent with the previously reported neurotropism of AAV5 (Haery et al., 2019).
3.2 Overexpression of DUSP6 in dorsal hippocampus improves spatial learning behavior in male but not female 5xFAD miceWe assessed spatial learning in male and female mice overexpressing DUSP6 or GFP in the dHc at 5 months of age using the Barnes maze test. During the 5-day training session, male 5xFAD-GFP took longer to enter the hidden tunnel (escape box) (Figure 2A) and traveled less distance in the target quadrant (location of escape box) (Figure 2B), compared to male WT-GFP, consistent with a learning behavior deficit. Male 5xFAD mice overexpressing DUSP6 in dHc (abbreviated 5xFAD-DUSP6) took significantly less time to enter the hidden tunnel compared to those overexpressing GFP (5xFAD-GFP), but spent significantly more time than WT-GFP (Figure 2A), suggesting that DUSP6 overexpression may partially rescue learning behavior deficits in male 5xFAD. No significant differences in distance traveled in the target quadrant were found comparing male 5xFAD-DUSP6 and 5xFAD-GFP during the 5-day training period, although on days 3 and 5, male 5xFAD-DUSP6 did show a trend toward an increase in the percentage of distance traveled in the target quadrant compared to 5xFAD-GFP (Figure 2B). On the other hand, female 5xFAD-DUSP6 showed no significant changes in Barnes maze performance compared to 5xFAD-GFP (Figures 2C, D). These results indicated that DUSP6 overexpression in dHc partially rescued learning behavior deficits in male but not female 5xFAD mice, and contrasted with previously reported dHc DUSP4 overexpression that resulted in rescued learning behavior deficits in female but not male 5xFAD mice (Pan et al., 2022), with all mice analyzed in the same Barnes maze test (see Materials and Methods).
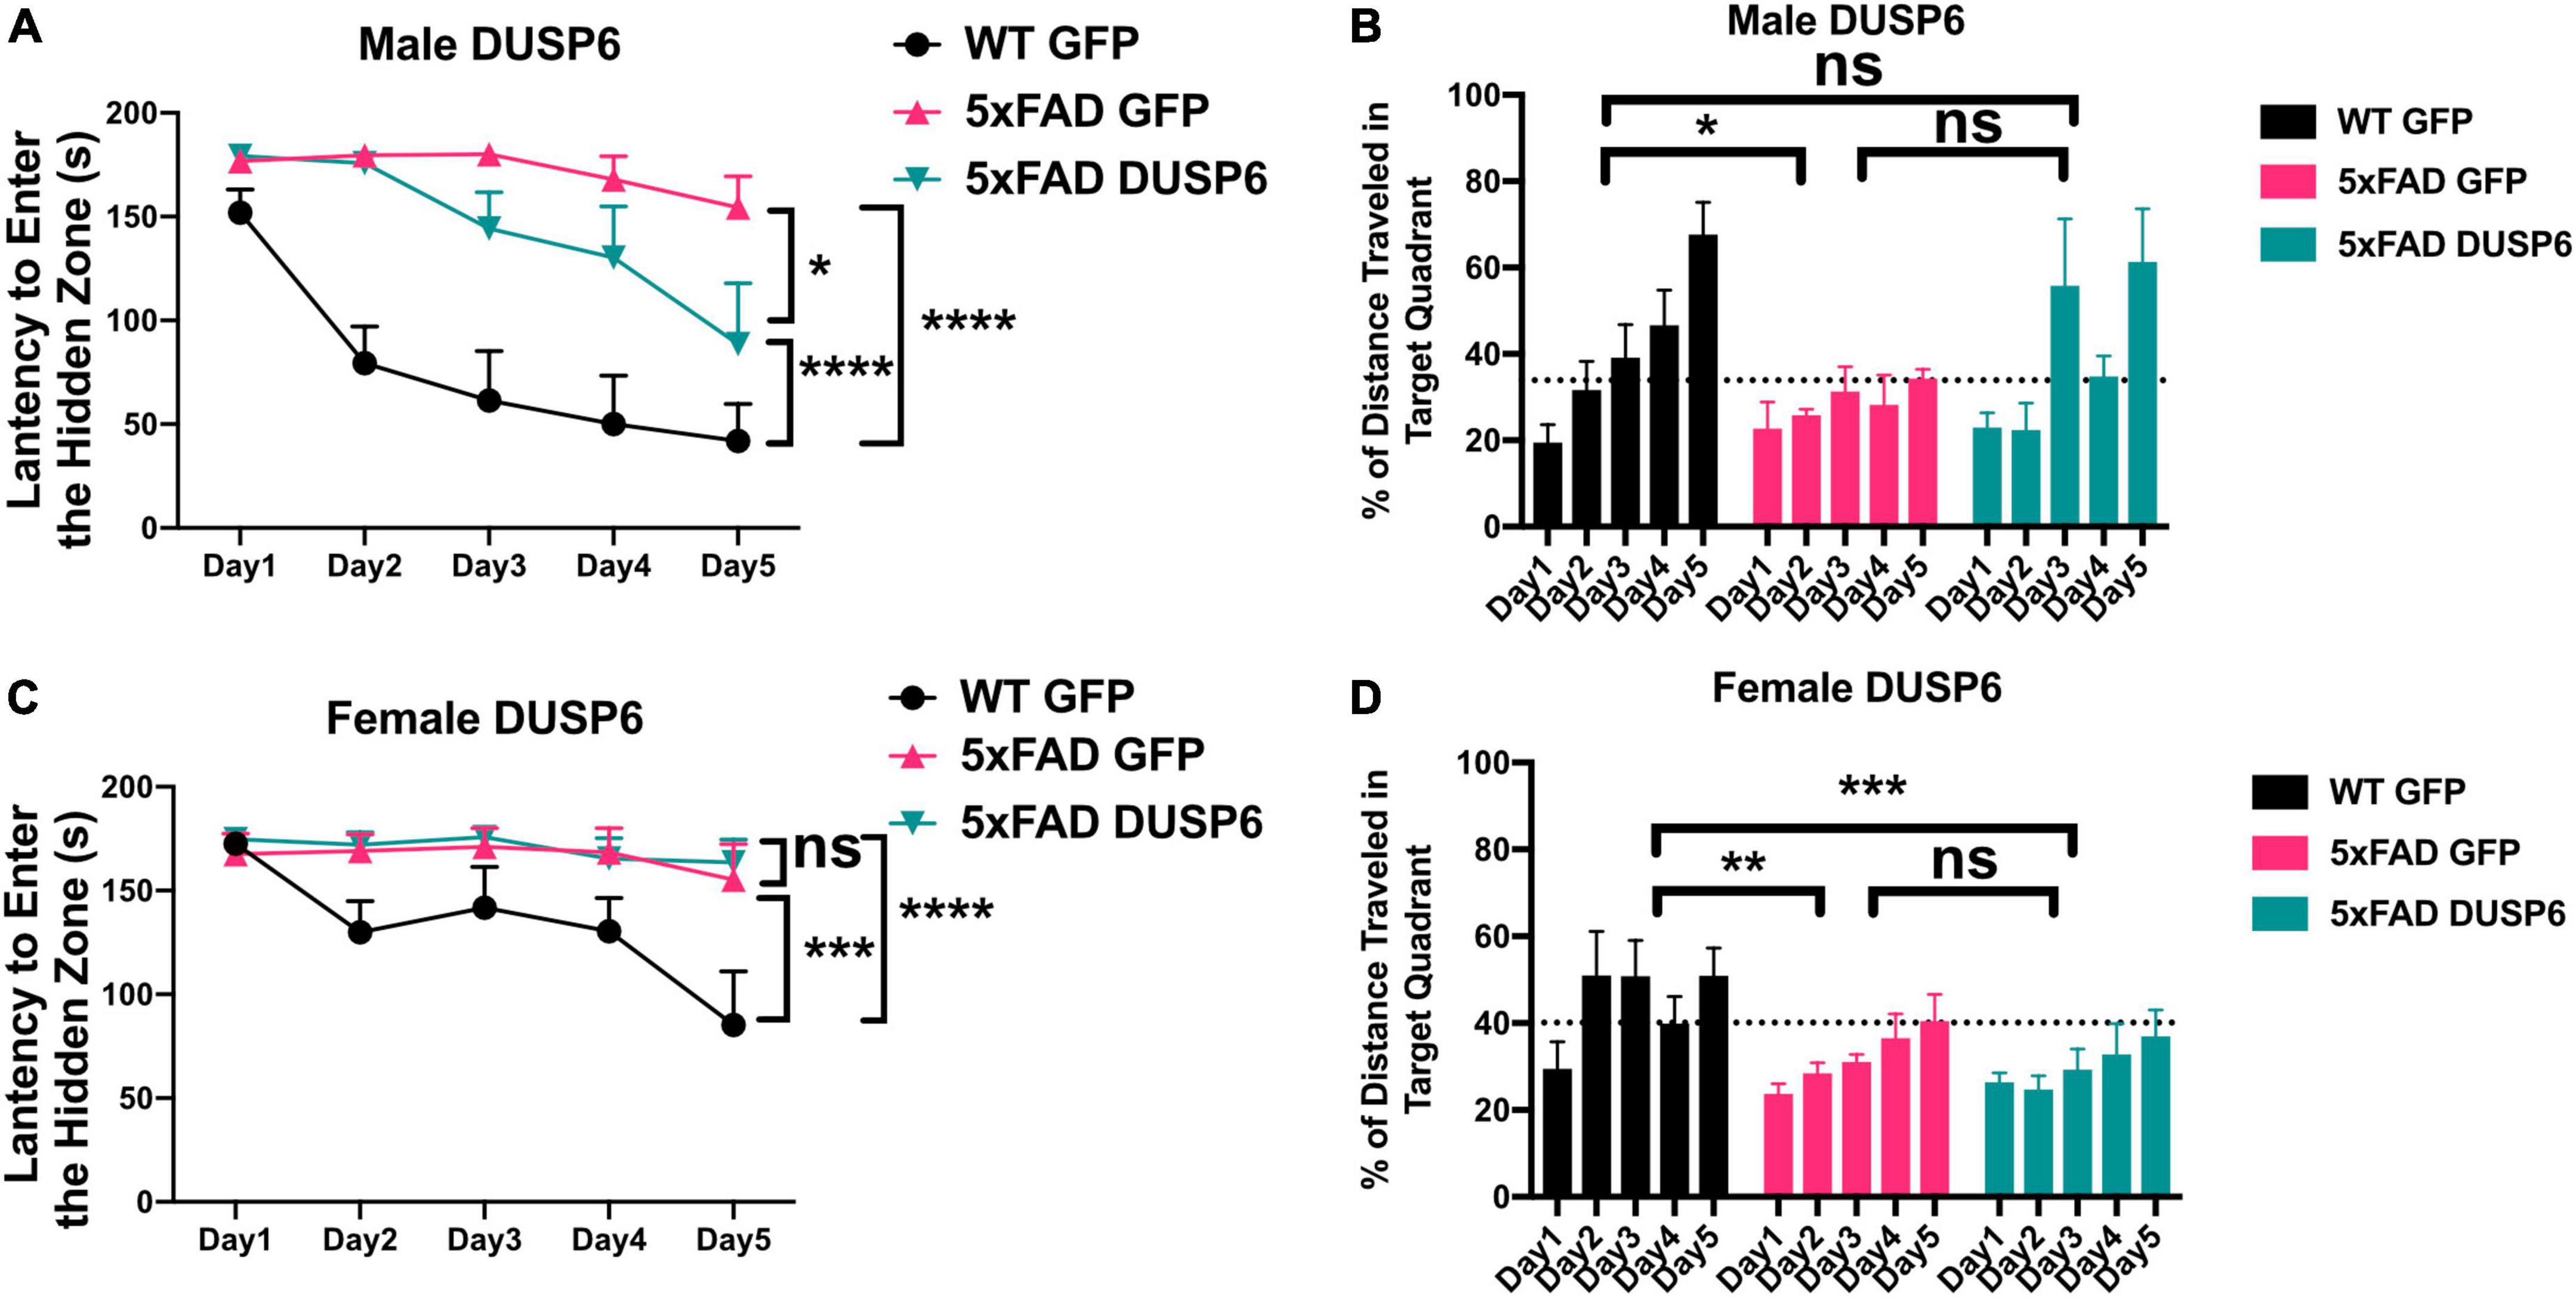
Figure 2. Barnes Maze testing of 5xFAD mice overexpressing DUSP6. (A,B) Male and (C,D) female 5xFAD and WT overexpressing DUSP6 or GFP were tested in the Barnes Maze at 5 months of age, n = 6–7 mice/group. Training was performed in a 5-day session with two trials per day, and the time (A,C) spent to enter the hidden tunnel and the percentage of distance traveled in the target quadrant (B,D) were recorded. Error bars represent means ± SEM. Statistical analyses were performed using a Two-Way ANOVA followed by a Tukey’s post-hoc test, *p < 0.05, **p < 0.01, ***p < 0.001, ****p < 0.0001; ns nonsignificant.
3.3 Overexpression of DUSP6 reduces amyloid plaque load in male 5xFAD mice but not in female 5xFADWe sought to determine whether DUSP6 overexpression reduced amyloid burden in 5xFAD mice which could contribute to the partial rescue of learning deficits. DUSP6 overexpression significantly reduced 6E10-immunolabeled amyloid plaque density in male 5xFAD but not female 5xFAD mice (Figures 3A, B). Western blot analysis revealed that levels of human APP-related proteins containing the 6E10 epitope were reduced in male 5xFAD-DUSP6 but not in female 5xFAD-DUSP6, compared to 5xFAD-GFP mice (Figure 3C). However, RT-qPCR analysis showed that human APP and mouse App mRNA levels were not altered by DUSP6 overexpression (Supplementary Figure 4), indicating that DUSP6 did not affect APP at the transcriptional level. Aβ1–40 and Aβ1–42 peptide levels were reduced in male 5xFAD-DUSP6 but not female 5xFAD-DUSP6 mice, compared to sex- and age-matched 5xFAD-GFP mice (Figure 3D). Taken together, these data suggest that DUSP6 is potentially involved in the regulation of hAPP translation, Aβ peptide production, degradation, and/or amyloid plaque clearance.
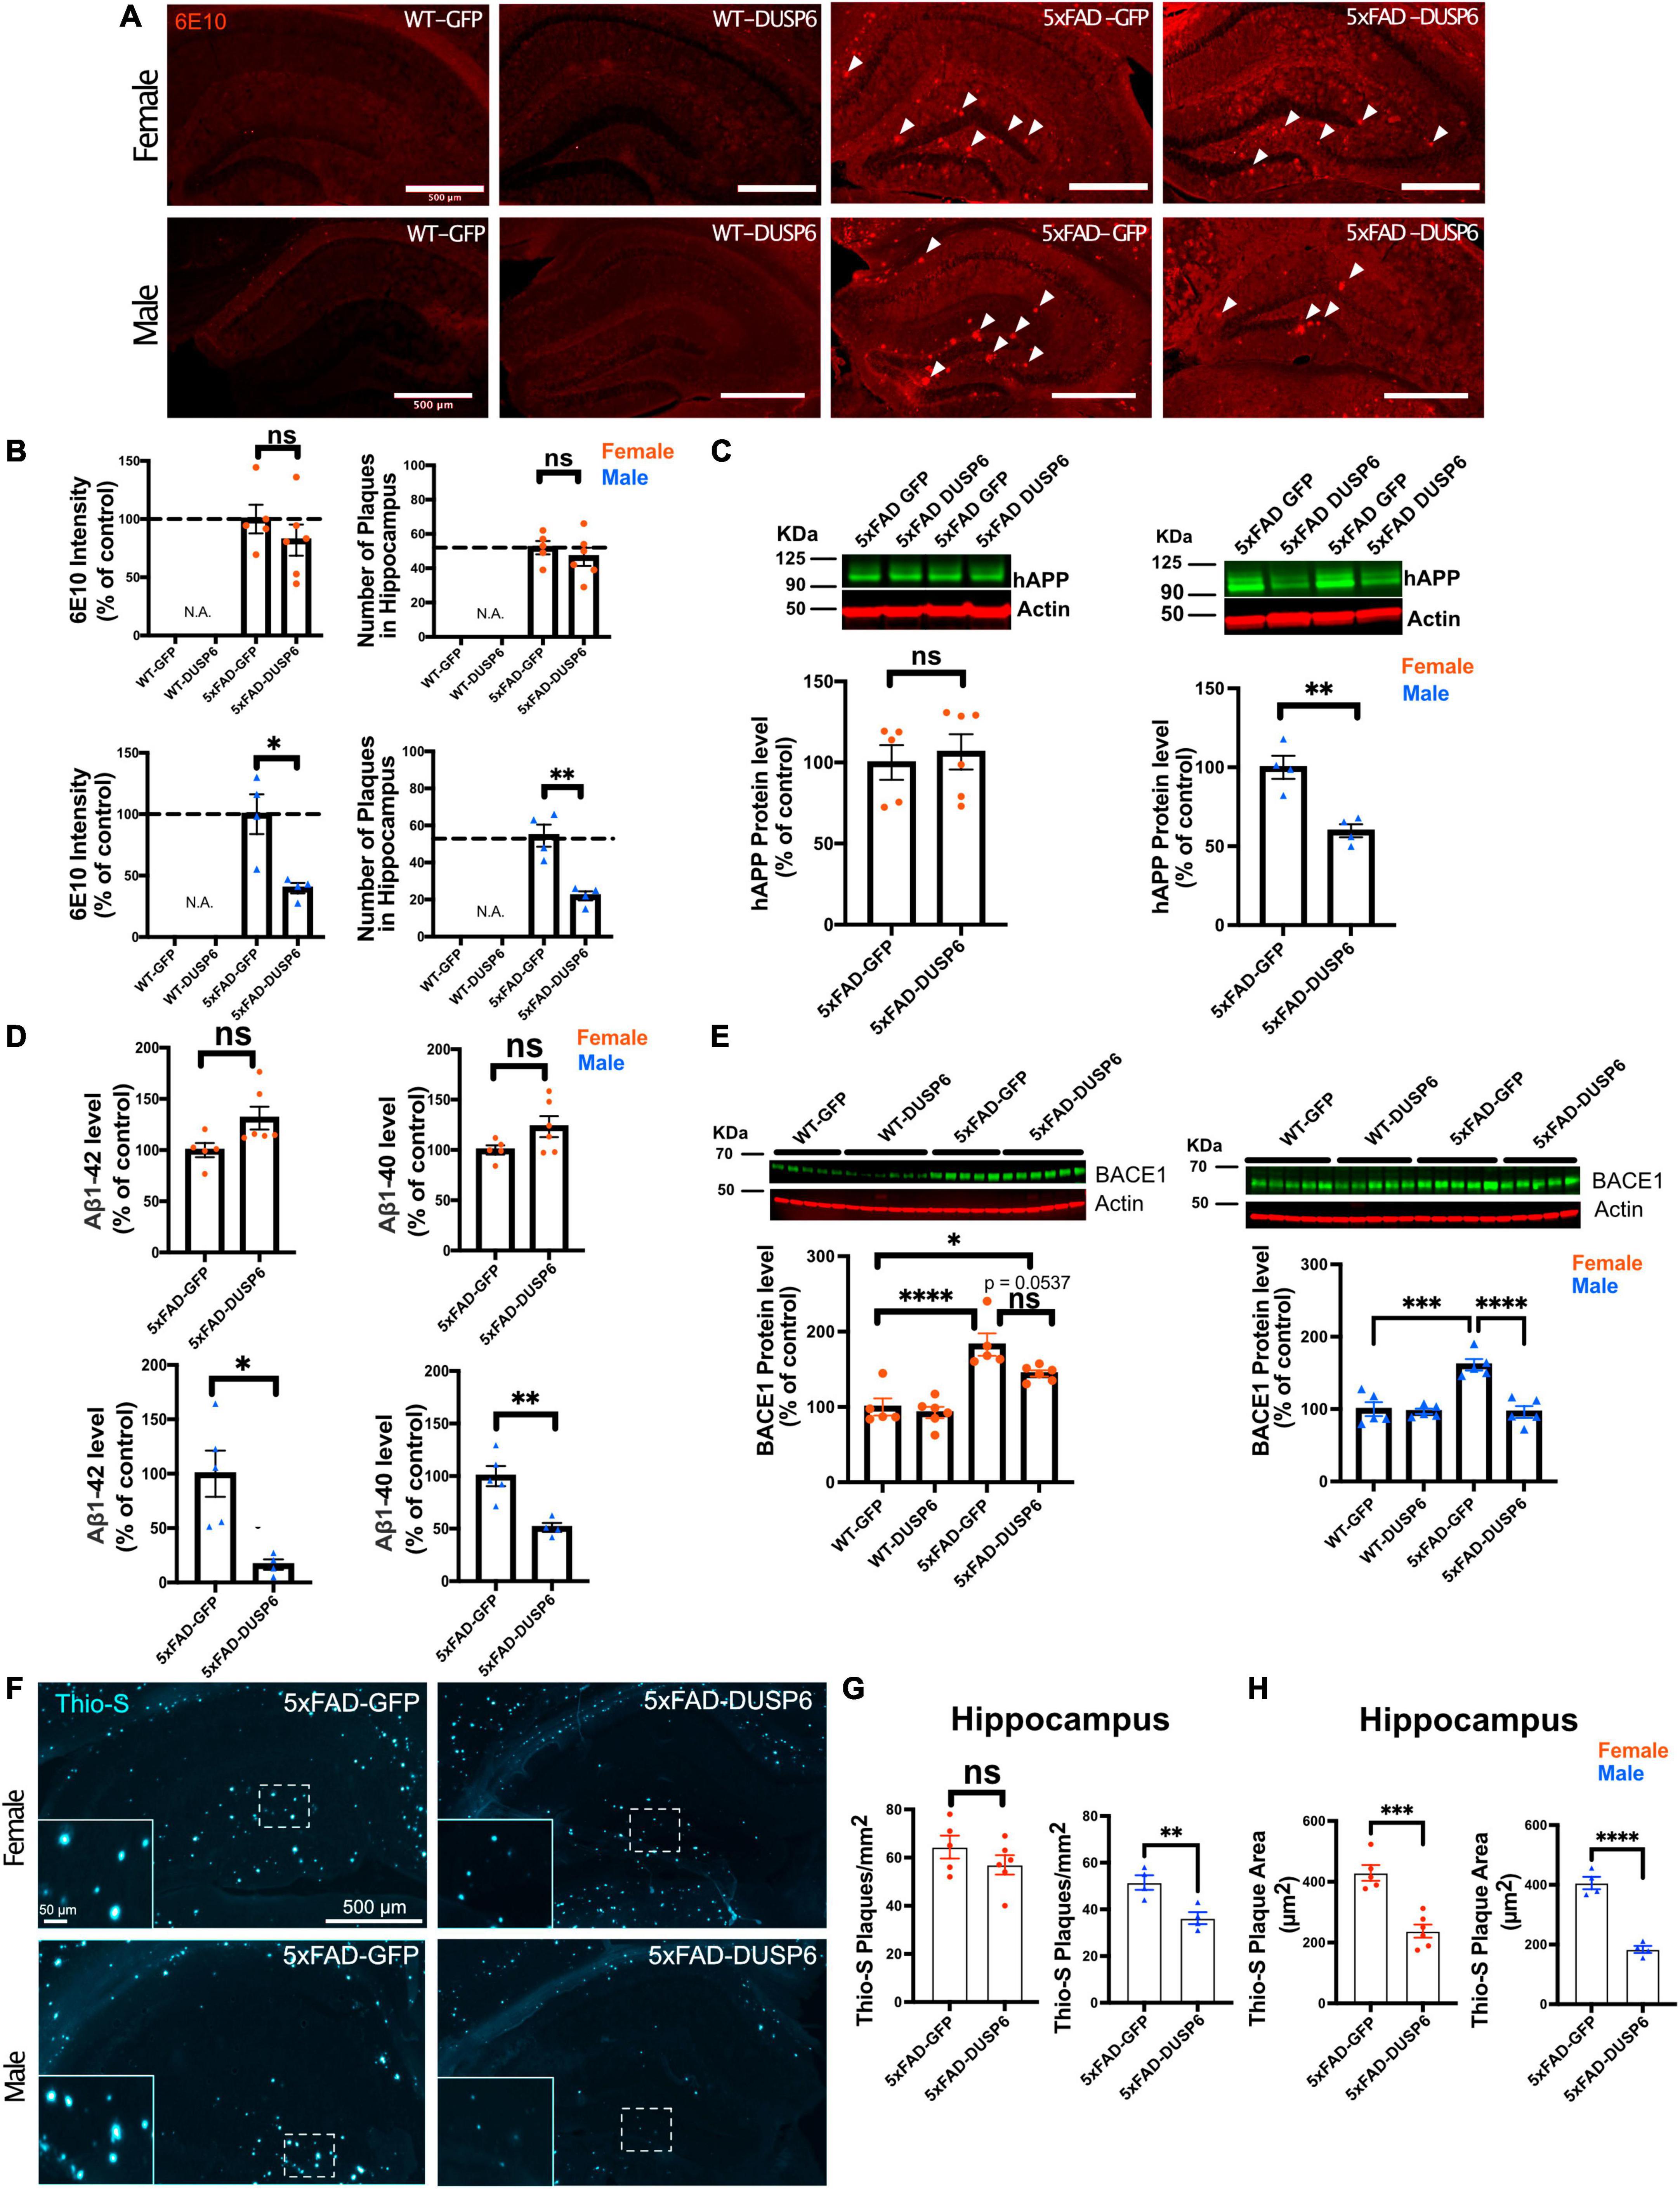
Figure 3. Immunohistochemistry and ELISA analyses of amyloid plaque load in hippocampi of 5xFAD mice overexpressing DUSP6. (A) Representative images of 6E10 staining in male and female 5xFAD and WT mice overexpressing DUSP6 or GFP at 5 months of age. Arrows indicate amyloid plaques in the hippocampus. Scale bar = 500 μm. (B) Quantification of intensity and number of 6E10-positive plaques in the hippocampi of male and female 5xFAD and WT mice overexpressing DUSP6 or GFP at 5 months of age. n = 4–6 mice per group and per sex with 3 coronal sections per animal. (C) Western blot analysis of human APP proteins (clone 6E10) in hippocampus of female and male 5xFAD and WT overexpressing DUSP6 or GFP. n = 4–6 mice per group. (D) Human Aβ1–40 and Aβ1–42 levels were quantified by ELISA in hippocampi of female and male 5xFAD and WT overexpressing DUSP6 or GFP. (E) BACE1 levels in hippocampi of female and male 5xFAD and WT mice overexpressing DUSP6 or GFP were quantified by western blot. n = 5–6 mice per group. (F) Representative images of thioflavin S (Thio-S) staining in male and female 5xFAD mice overexpressing DUSP6 or GFP at 5 months of age. (G) Quantification of the number of Thio-S positive plaques in the hippocampus. n = 4–6 mice/sex/group (H). Quantification of the average plaque area in the hippocampus. n = 4–6 mice/sex/group. Error bars represent means ± SEM. Statistical analyses were performed using a one-way ANOVA followed by a Tukey’s post-hoc test for BACE1 western blots and a Student’s t-test for all other graphs, *p < 0.05, **p < 0.01, ***p < 0.001, ****p < 0.0001; ns = nonsignificant.
3.4 DUSP6 overexpression reduces BACE1 levels in male but not female 5xFAD mice and slows plaque formation in both female and male 5xFAD miceThree key enzymes, α-, β- and γ-secretases, regulate APP processing, and Aβ peptide is produced by the proteolytic action of β- and γ-secretases on APP in the amyloidogenic pathway. We used RT-qPCR to quantify the transcripts encoded by the mouse γ-secretase subunit genes Ps1 and Ps2, the mouse β-secretase APP cleaving enzyme 1 (Bace1), and by transgenic human PS1, in 5xFAD mouse hippocampus. As we have shown previously through the analysis of gene expression in these samples from 5xFAD-GFP and WT-GFP hippocampus, when we investigated the efficacy of DUSP4 overexpression to slow progression of neuropathology in 5xFAD mice (Pan et al., 2022), most of these processing enzyme genes were upregulated in both female and male 5xFAD-GFP compared to WT-GFP, except for Ps2 mRNA levels in male and Bace1 mRNA levels in female, where no changes were observed when compared to WT-GFP mice (Supplementary Figure 2). DUSP6 overexpression in 5xFAD significantly reduced hippocampal Bace1 mRNA levels in males only (Supplementary Figure 2C, right panel), and did not significantly affect expression of any other APP-processing enzymes. Western blotting indicated that BACE1 protein levels were significantly decreased in male 5xFAD mice overexpressing DUSP6, while female 5xFAD mice overexpressing DUSP6 showed a trend of reduction in BACE1 protein levels (Figure 3E).
BACE1 catalyzes the rate liming step in the production of β-amyloid, and the inhibition of BACE1 has been reported to significantly reduce the rate of plaque formation (Peters et al., 2018). To determine whether DUSP6 overexpression altered amyloid plaque formation, we analyzed the number and size of thioflavin S-labeled plaques. The total number of thioflavin S-positive plaques was significantly reduced only in male 5xFAD mice overexpressing DUSP6 (Figures 3F, G), while the average size of thioflavin S-positive plaques was reduced in both female and male 5xFAD mice overexpressing DUSP6 (Figure 3H), suggesting that DUSP6 overexpression reduces the rate of amyloid plaque formation.
To investigate whether DUSP6 overexpression regulated the non-amyloidogenic APP processing pathway, we quantified mRNA levels of α-secretases Adam10 and Adam17 by RT-qPCR. Levels of Adam10 and Adam17 mRNAs in 5xFAD were previously reported as increased at one month of age, and by 9 months of age, Adam10 mRNA was decreased and Adam17 also showed a trend of reduction at the same age (Reinhardt et al., 2014). We found that Adam10 and Adam17 mRNAs were upregulated in female and male 5xFAD-GFP at 5 months of age compared to WT-GFP (Supplementary Figure 2D). Overexpression of DUSP6 in either female or male 5xFAD mice did not affect the levels of Adam10 and Adam17 mRNAs compared to 5xFAD-GFP. Lastly, transcripts encoded by γ-secretase subunit genes including Nct, Aph1a, Aph1b, and Aph1c were quantified, and Nct mRNA levels were upregulated in female and male 5xFAD-GFP compared to WT-GFP, while no changes were observed in 5xFAD mice overexpressing DUSP6 compared to 5xFAD-GFP (Supplementary Figures 2E, F). Taken together, these results indicate that the amelioration of amyloid burden by DUSP6 overexpression is not obviously caused by widespread changes in the expression of the major secretase-type APP-processing enzymes.
3.5 DUSP6 overexpression reduces AD-associated microglial activation and clusteringTo determine whether DUSP6 overexpression affects AD-associated microglial activation in a sex-dependent manner, we assayed microglia-associated markers. We first assessed hippocampal Aif1 (IBA1) and Cd68 mRNA levels in female and male 5xFAD overexpressing GFP by real-time quantitative polymerase chain reaction (RT-qPCR), and found a ∼10-fold increase in Cd68 and a ∼6-fold increase in Aif1 mRNA levels in female 5xFAD-GFP and a ∼13-fold increase in Cd68 and ∼3-fold increase in Aif1 mRNA levels in male 5xFAD-GFP, compared to sex-matched WT-GFP (Figures 4A, B), consistent with AD-associated microglial activation. There were no significant changes in Cd68 and Aif1 mRNA levels in female or male WT-DUSP6 mice, compared to WT-GFP (Figures 4A, B). Both female and male 5xFAD overexpressing DUSP6 had significantly decreased Cd68 and Aif1 mRNA levels compared to 5xFAD-GFP mice (Figures 4A, B). However, only Aif1 mRNA levels showed a consistent reduction in female 5xFAD-DUSP6 vs 5xFAD-GFP in both RNAseq (p = 0.022) and RT-qPCR (p < 0.001) data, while male 5xFAD-DUSP6 vs 5xFAD-GFP showed a reduction by RT-qPCR (p < 0.001) but no significant change in RNAseq (p = 0.52) analysis. The discrepancy between these results may be due to the masking of microglial gene expression as a result of bulk RNA sequencing analysis, which takes average gene expression across all cells in the sample. Therefore, we assayed IBA1 by immunohistochemistry (IHC), finding that the intensity of IBA1-positive staining increased in both female and male 5xFAD-GFP hippocampal sections compared to WT-GFP, while IBA1 staining intensity in the hippocampus of female and male 5xFAD mice overexpressing DUSP6 was significantly reduced compared to 5xFAD-GFP (Figures 4C–F).
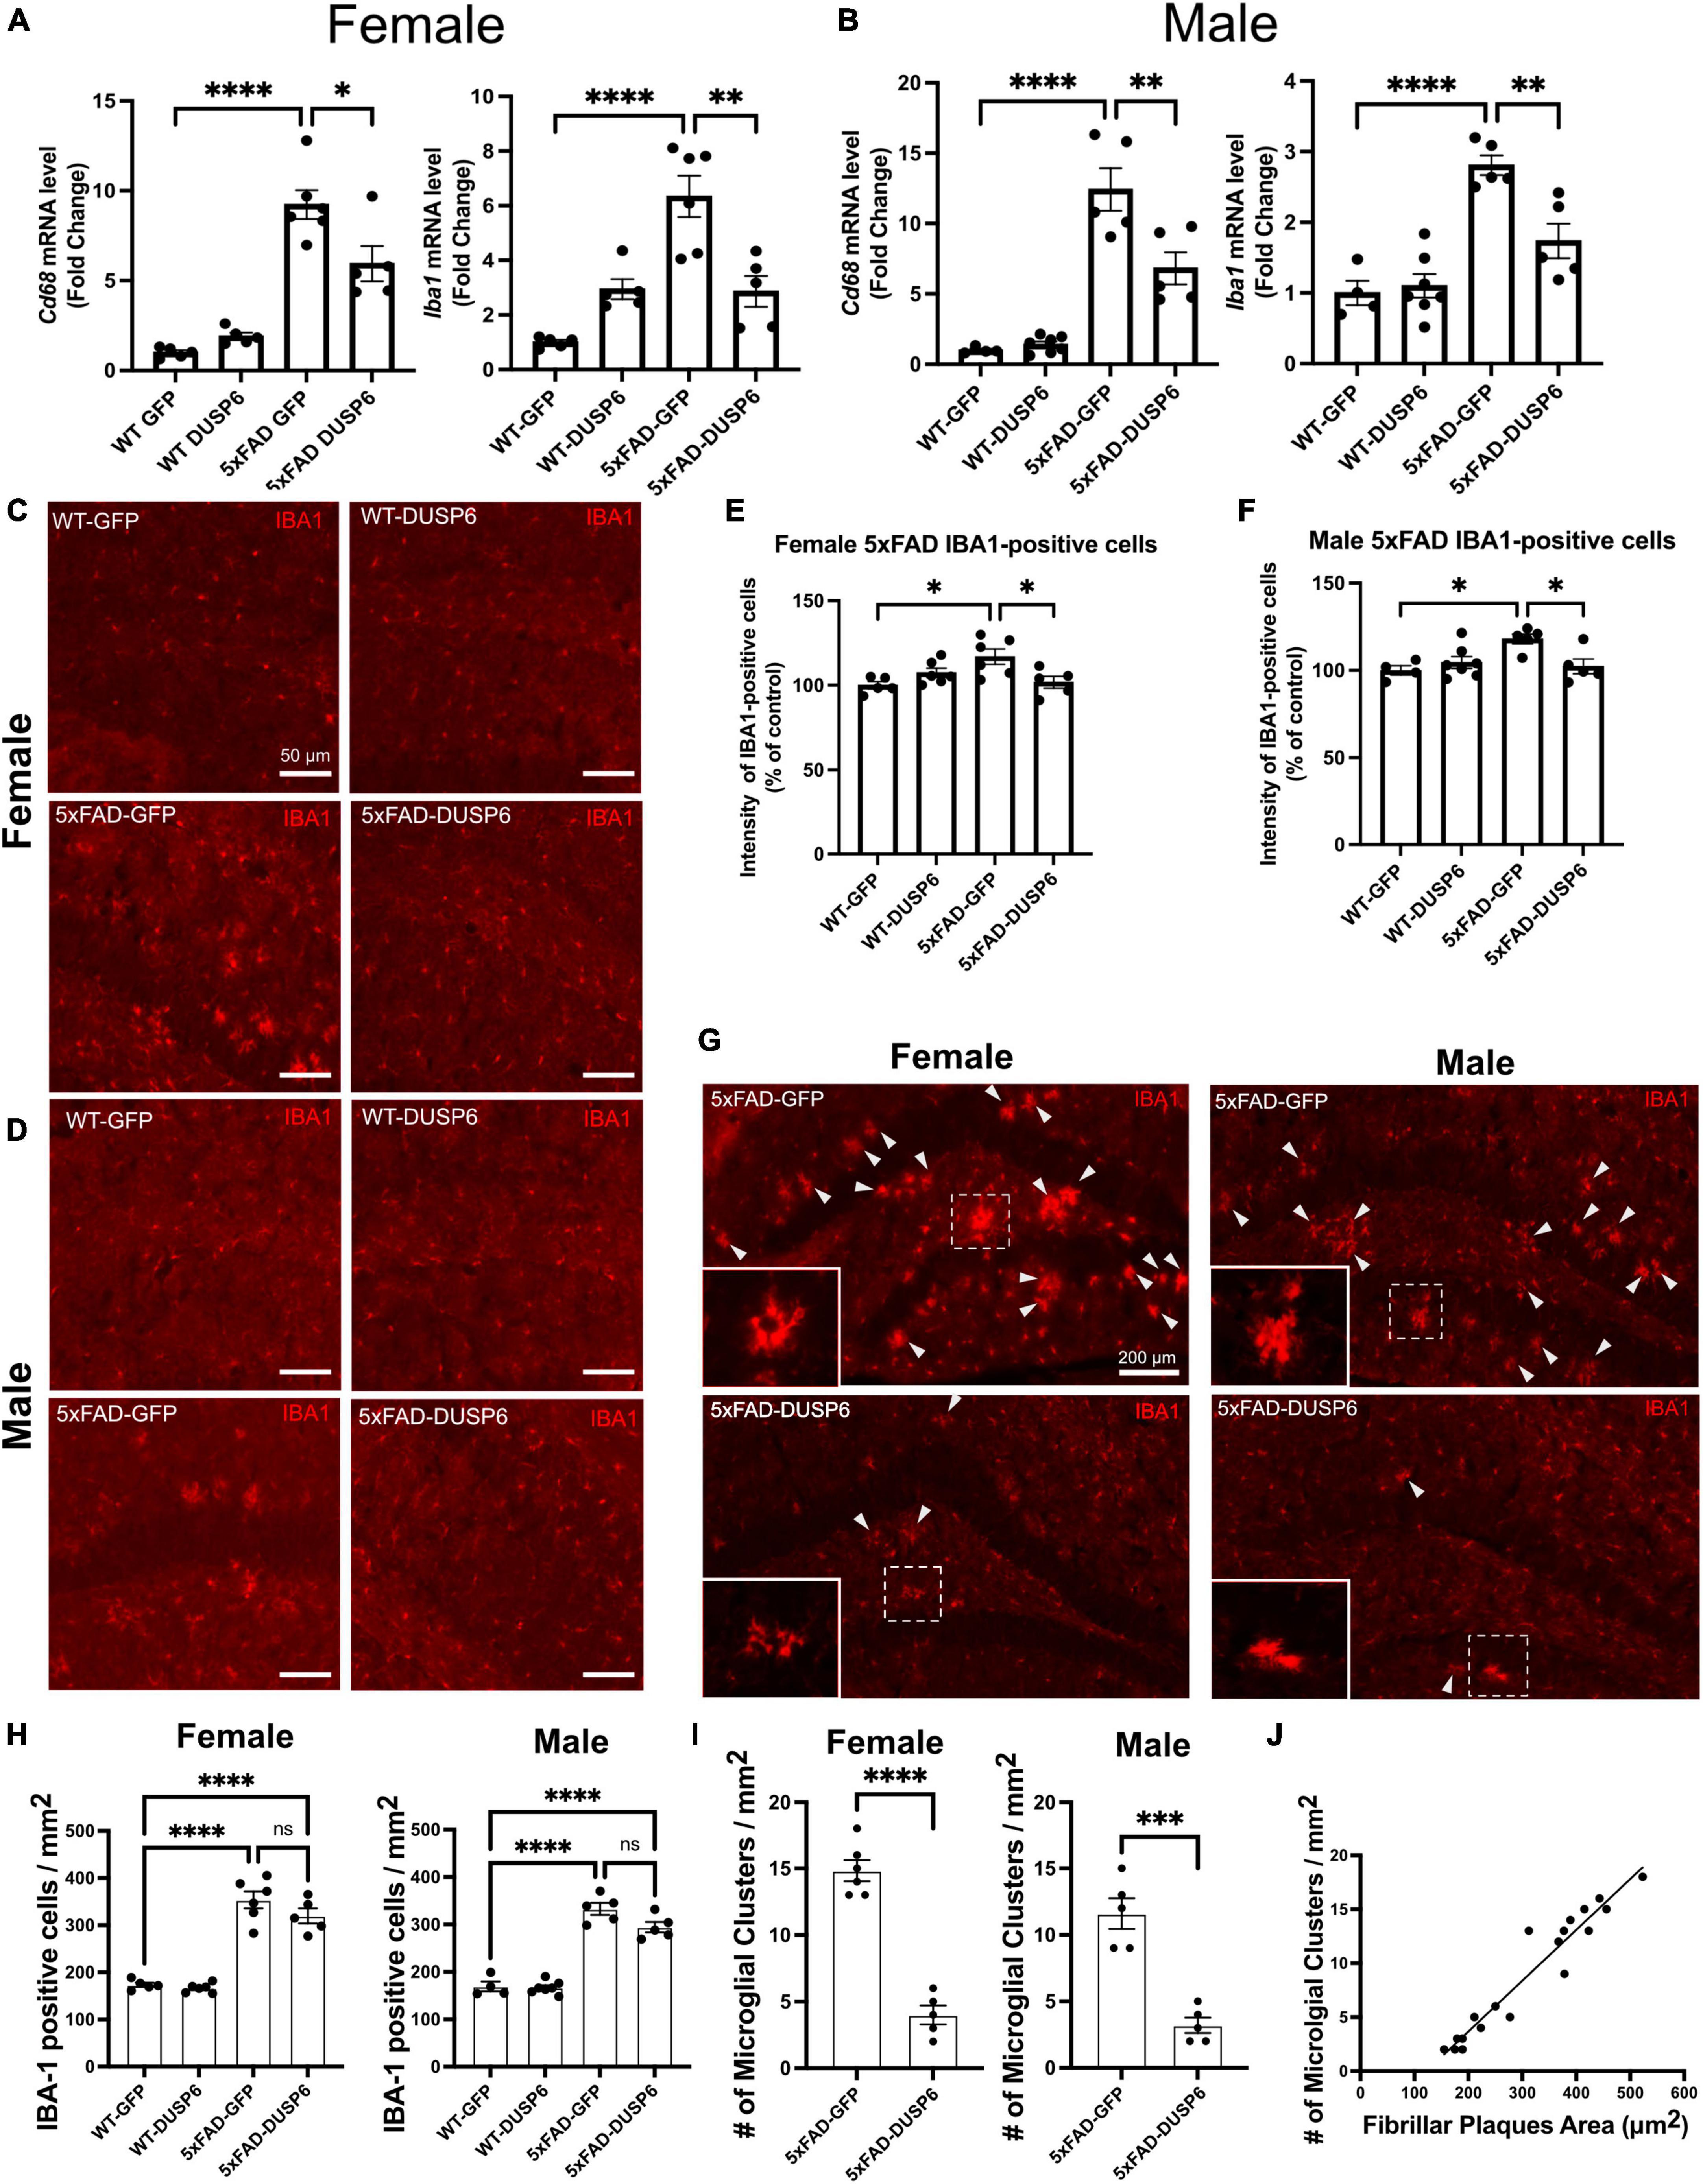
Figure 4. DUSP6 overexpression ameliorates microglial activation in female and male 5xFAD mice. (A,B) RT-qPCR results showed a significant decrease of Aif1 and Cd68 mRNAs in DUSP6-overexpressing female (A) and male (B) 5xFAD mice compared to GFP-overexpressing 5xFAD mice, n = 4–7 mice/group. (C,D) Representative images of microglial cells from female (C) and male (D) dorsal hippocampi labeled with anti-IBA1 (red). Scale bar = 50 μm. (E) Quantification of IBA1 fluorescence intensity from images in C showed that DUSP6 overexpression decreased IBA1 levels in female 5xFAD, n = 5–6 mice/group. (F) Quantification of IBA1 fluorescence intensity from images in D showed that DUSP6 overexpression reduced IBA1 levels in male 5xFAD mice, n = 4–7 mice/group. (G) Representative images of “microglial clusters” (a cluster of microglia is counted when three or more microglial soma occurred within 20 μm of graticule subregion) in the hippocampus. (H) Quantification of IBA1 positive cells in the hippocampus, n = 4–7 mice/group. (I) Quantification of the number of microglial clusters in the hippocampus, n = 5–6 mice/group. (J) The increased number of microglial clusters is correlated with the increased number of fibrillar plaques in a combined group analysis, R2 = 0.92, p < 0.001. Statistical analyses were performed using a Student’s t-test for microglial clusters and a One-way ANOVA followed by a Tukey’s post-hoc test for all other graphs, *p < 0.05, **p < 0.01, ***p < 0.001, ****p < 0.0001; ns nonsignificant.
Clustering of activated microglia and the interaction between microglia and amyloid plaques have been noted in post-mortem human brain tissue (Serrano-Pozo et al., 2011; Walker et al., 2020). We therefore assessed whether DUSP6 overexpression affected “microglial clustering” in 5xFAD mice by distinguishing clusters of IBA1-positive cells [defined as three or more microglial somas occurring within, or touching the margins of, a 20 μm2 virtual graticule subregion of hippocampus (Paasila et al., 2020)], from individual IBA1-positive cells. There were no significant changes in the total number of IBA1-positive microglia in either female or male 5xFAD overexpressing DUSP6 compared to sex-matched 5xFAD overexpressing GFP (Figure 4H), while the number of “microglial clusters” was reduced in both female and male 5xFAD overexpressing DUSP6 compared to the sex-matched 5xFAD overexpressing GFP (Figures 4G–I). This reduction in “microglia clusters” correlated with a decrease in amyloid plaque size in a combined group analysis, comparing 5xFAD overexpressing DUSP6 and 5xFAD overexpressing GFP (Figure 4J). These results suggest that DUSP6 overexpression may regulate microglia-associated neuroinflammation in 5xFAD mice, but it is not clear whether this is a direct effect of DUSP6 on microglial activation or an indirect outcome of reduced amyloid burden.
3.6 Upregulated differentially expressed genes (DEGs) in the hippocampus of female 5xFAD relative to wild type are downregulated by DUSP6 overexpressionTo determine the molecular pathways in the dHc of 5-month-old 5xFAD mice that are affected by DUSP6 overexpression, we compared the dHc transcriptomic profiles of female and male WT or 5xFAD overexpressing DUSP6 to WT or 5xFAD overexpressing GFP (transcriptomic data for WT and 5xFAD overexpressing GFP were previously published with our DUSP4 overexpression dataset (Pan et al., 2022), all of which were sequenced in the same batch with the DUSP6 transcriptomics reported here). There were 1469 differentially expressed genes (DEGs) in female WT-DUSP6 relative to female WT-GFP (FDR < 0.05) (Supplementary Figure 3A). Several DEGs including alpha-2-macroglobulin (A2m) (Blacker et al., 1998), syndecan 1 (Sdc1) (Letoha et al., 2019), and interferon-induced transmembrane protein 2 (Ifitm2) (Yao and Yan, 2020), were upregulated by DUSP6 overexpression in female WT mice, and these genes have either been directly or indirectly associated with metabolism of Aß. Another highly upregulated gene in female WT overexpressing DUSP6 is Msx3. Overexpression of MSX3 in microglia protects neurons from injury, and promotes the maturation of oligodendrocyte precursors and remyelination, whereas the deletion of Msx3 in microglia induces apoptosis of oligodendrocytes and prevents neuroprotection (Yu et al., 2015). Inflammatory response pathways were highlighted when pathway enrichment analysis of the DEGs identified in female WT overexpressing DUSP6 was performed (Supplementary Figure 3B). By comparison, there were only 7 DEGs in male WT mice overexpressing DUSP6 compared to those expressing GFP (FDR < 0.05) (Supplementary Figure 3C), but Msx3 is again one of the most upregulated genes.
We then assessed transcriptomics in 5xFAD mice overexpressing DUSP6 or GFP in dHc, compared to WT-GFP. We identified 1828 DEGs in female 5xFAD-GFP compared to WT-GFP, most of which were upregulated (FDR < 0.05) (Figure 5A). Overexpression of DUSP6 in female 5xFAD dHc downregulated 119 DEGs compared to 5xFAD-GFP (FDR < 0.05) (Figure 5B), and 116 of these DEGs overlapped with the upregulated DEGs from female 5xFAD-GFP vs WT-GFP (Supplementary Figure 3D). Enrichr pathway analysis showed, as previously described (Landel et al., 2014; Boza-Serrano et al., 2018; Manji et al., 2019), that many inflammatory pathways in the hippocampi of female 5xFAD were upregulated compared to WT (Figure 5E). Overexpression of DUSP6 (Figure 5F) in female 5xFAD downregulated some of these inflammatory pathways. Ingenuity Pathway Analysis (IPA) predicted regulation of similar pathways, including downregulation of ERK/MAPK (p-value = 0.02, z-score = −1.34), interferon (p-value = 1.26x10⁻¹³, z-score = −2.53) and neuroinflammatory (p-value = 5.01x10⁻¹⁴, z-score = −4.69) pathways, and PD-1/PD-L1 (p-value = 3.16x10⁻¹⁵, z-score = 3.64) pathway by DUSP6 overexpression in female 5xFAD (Figure 5G). By comparison, there were only three DEGs observed in male 5xFAD-GFP compared to WT-GFP (Figure 5C), consistent with previous reports that female 5xFAD develop more severe neuropathology than age-matched males (Sadleir et al., 2015, 2018), while 5 DEGs were found in male 5xFAD-DUSP6 when compared to male 5xFAD-GFP (Figure 5D). The murine homeobox gene, Msx3, was notably upregulated in male 5xFAD-DUSP6, male WT-DUSP6, female 5xFAD-DUSP6, and female WT-DUSP6 hippocampus (Figures 5B, D and Supplementary Figures 3A, C), while the Baiap3 gene encoding a Munc13-related protein involved in large dense core vesicle exocytosis was also upregulated by DUSP6 overexpression in male 5xFAD (Figure 5D).
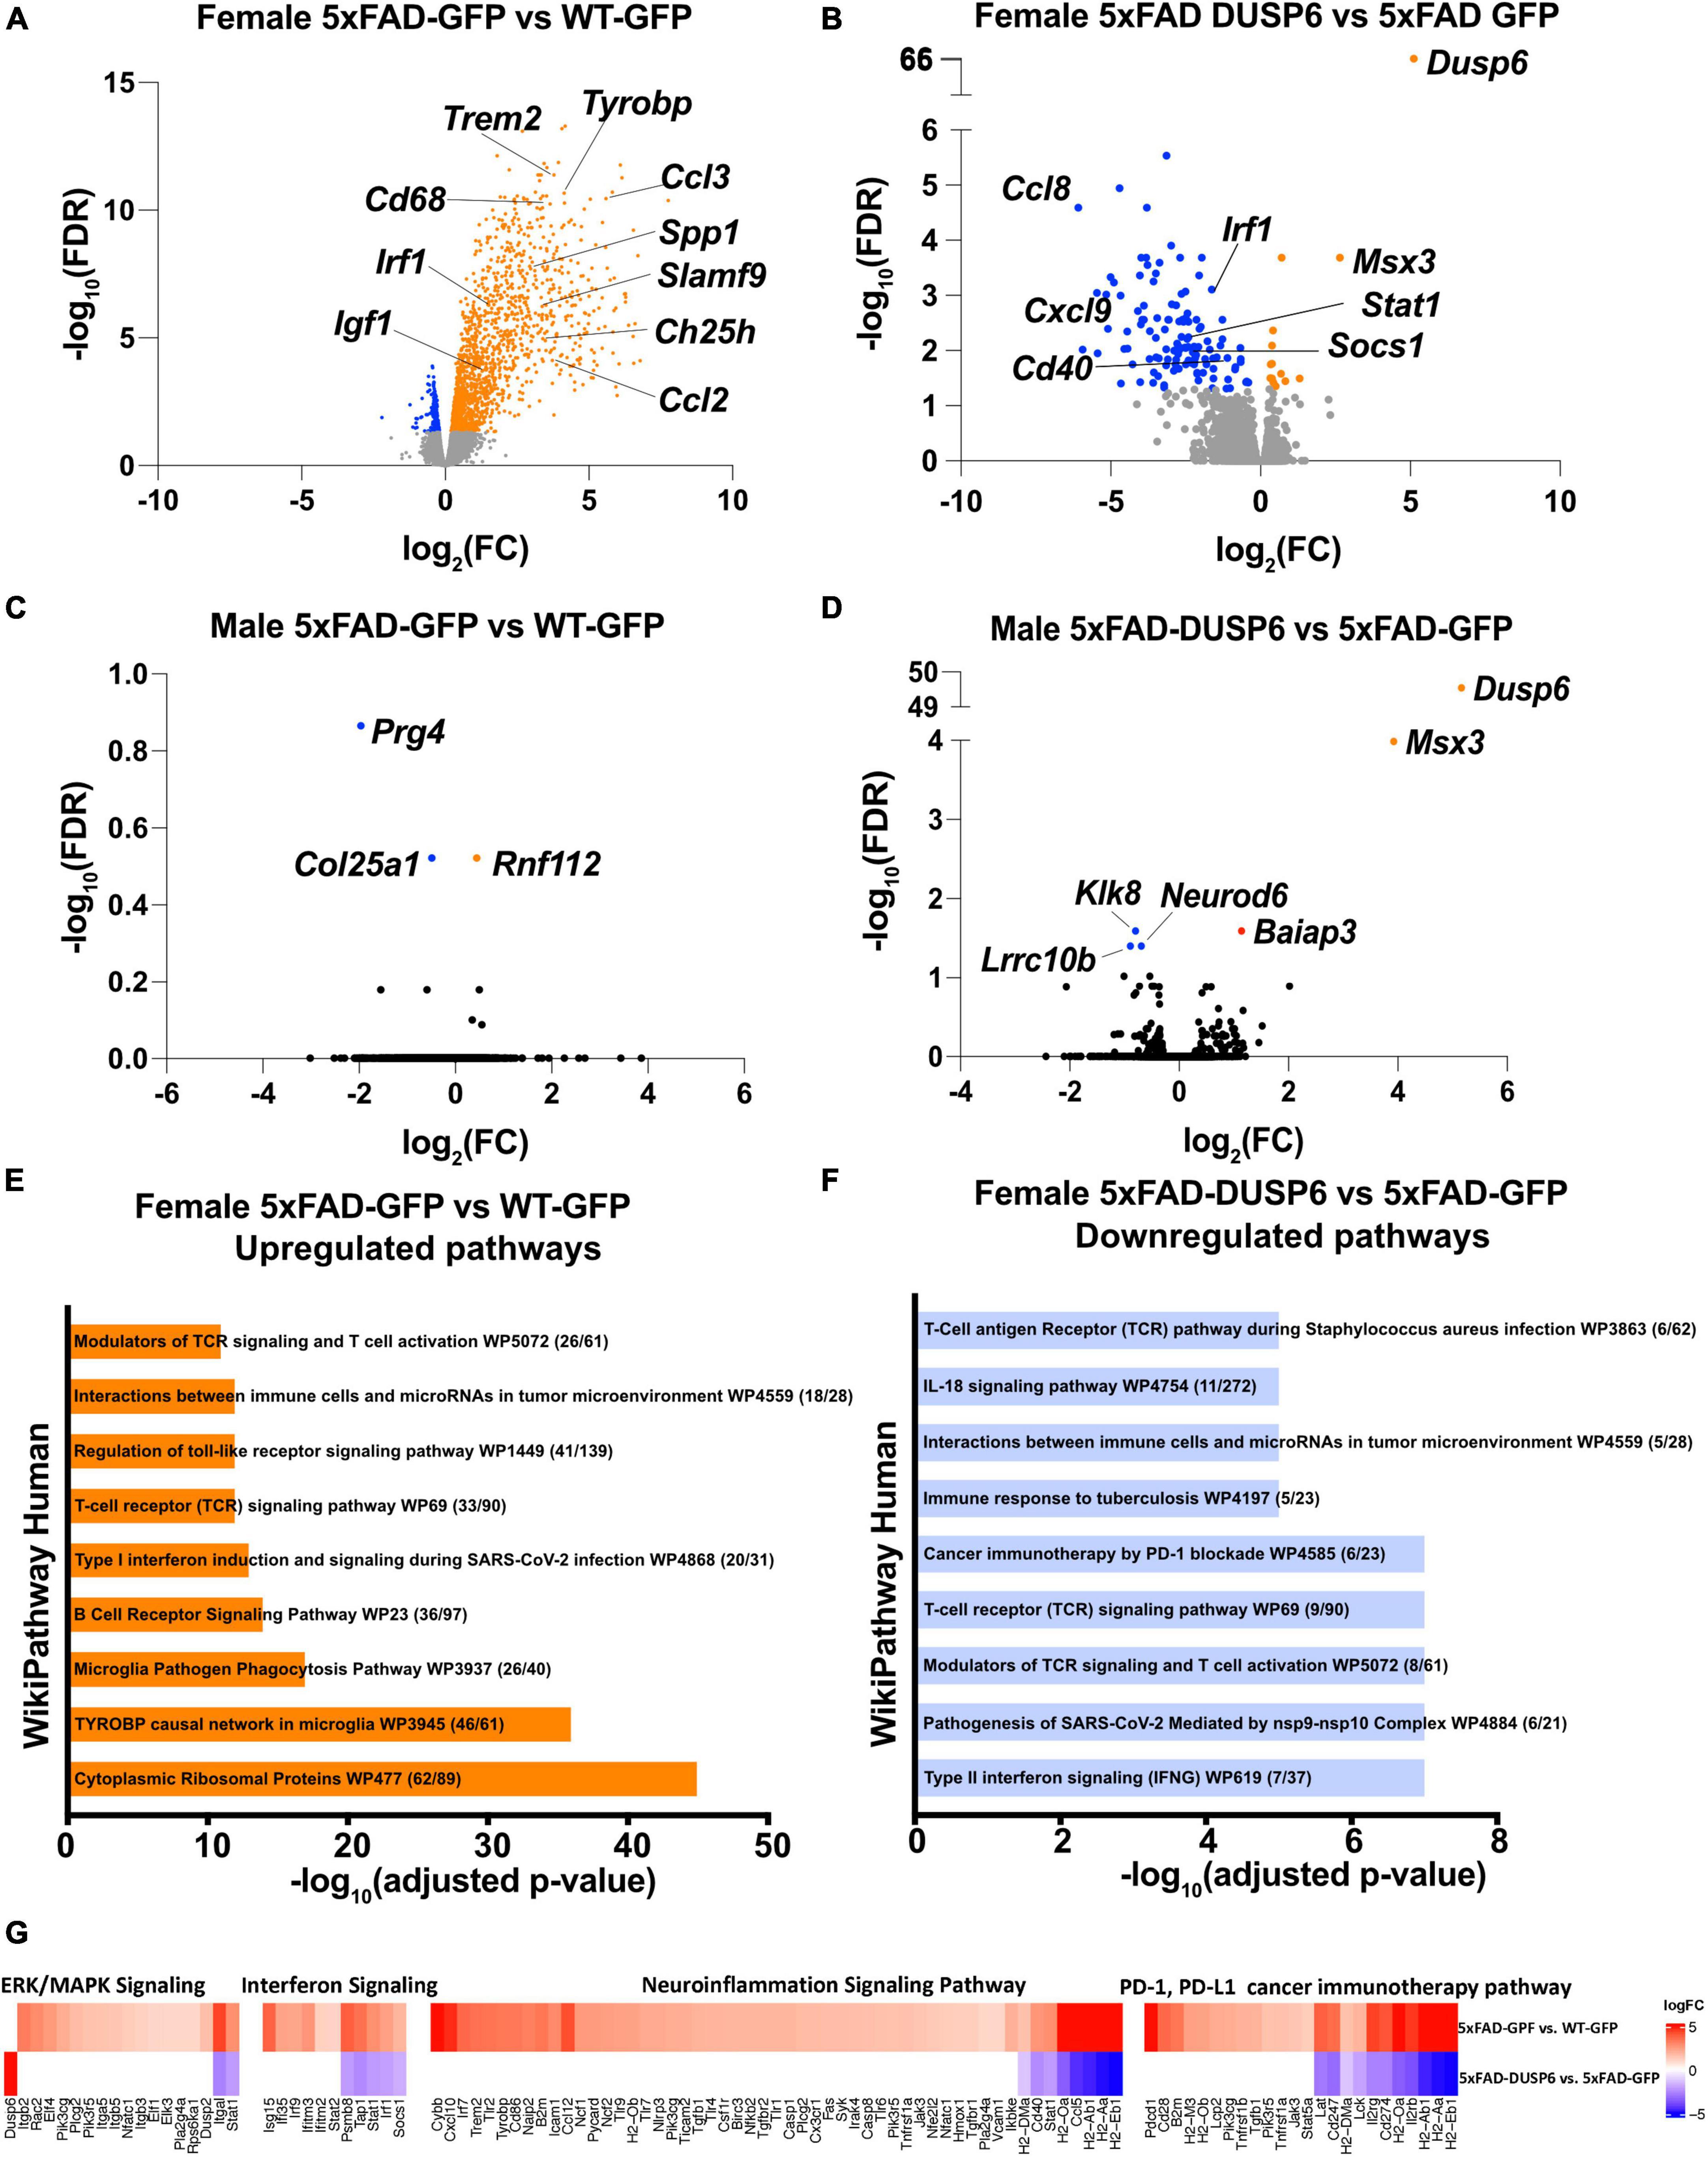
Figure 5. DUSP6 overexpression downregulates differentially expressed genes (DEGs) in female 5xFAD. (A,B) Volcano plot representation of female 5xFAD-GFP vs WT-GFP (A) and female 5xFAD-DUSP6 vs 5xFAD-GFP (B), n = 5 mice per group, threshold for DEGs represented is FDR < 0.05 (orange and blue dots). (C) Volcano plot representation of DEGs from male 5xFAD-GFP vs WT-GFP showed three DEGs. (D) Volcano plot representation of DEGs from male 5xFAD-DUSP6 vs 5xFAD-GFP showed five DEGs. (E,F) Enrichment analysis of DEGs from female 5xFAD GFP vs WT-GFP (E) and female 5xFAD-DUSP6 vs 5xFAD-GFP (F). (G) DEGs from panels (A,B) indicate a downregulation of the PD-1, PD-L1 cancer immunotherapy pathway (p-value = 7.94x10⁻¹⁵, z-score = −3.27), and an upregulation of the neuroinflammation signaling pathway (p-value = 2.51x10⁻²⁸, z-score = 6.80), interferon signaling (p-value = 6.31x10⁻¹¹, z-score = 2.89), and ERK/MAPK signaling (p-value = 3.55x10⁻⁵, z-score = 3.05) in female 5xFAD-GFP vs WT-GFP. Conversely, in 5xFAD-DUSP6 vs 5xFAD-GFP, the PD-1, PD-L1 cancer immunotherapy pathway (p-value = 3.16x10⁻¹⁵, z-score = 3.64) was upregulated, while the neuroinflammation signaling pathway (p-value = 5.01x10⁻¹⁴, z-score = −4.69), interferon signaling (p-value = 1.26x10⁻¹³, z-score = −2.53), and ERK/MAPK signaling (p-value = 0.02, z-score = −1.34) were downregulated.
3.7 Overexpression of DUSP6 in male 5xFAD and DUSP4 in female mice, which results in cognitive rescue, selectively regulates a number of synaptic genes and pathwaysBecause our bulk RNAseq yielded fewer DEGs (FDR < 0.05) in male compared to female 5xFAD vs WT, potentially a result of variability in gene expression resulting from the mixed B6/SJL genetic background compared to previous studies where higher numbers of DEGs were detected in 4 month old male 5xFAD on a C57BL/6J background (537 DEGs) (Bundy et al., 2019), we used less stringent parameters to filter DEGs (p < 0.05). DUSP6 overexpression rescues cognitive deficits in male 5xFAD mice but not in females (Figure 2), in contrast to DUSP4 overexpression, which rescues cognitive deficits in female 5xFAD but not in males (Pan et al., 2022). We therefore compared the transcriptomic analyses of these groups to determine whether alterations in gene expression induced by DUSP overexpression could explain these sex differences in cognitive behavior. Enrichr was used to perform Synapse Gene Ontologies (SynGO) on the sex differences in DEGs (p < 0.05) between female and male 5xFAD overexpressing either DUSP4 or DUSP6. DUSP6 overexpression regulated more synaptic pathways in male than in female 5xFAD, while DUSP4 overexpression regulated more synaptic pathways in female than in male 5xFAD, which is consistent with cognitive rescue in male 5xFAD-DUSP6 (Figure 2) and that previously reported in female 5xFAD-DUSP4 (Pan et al., 2022). The top nine significant pathways (p < 0.05) in male 5xFAD-DUSP6 were involved in synaptic activity including regulation of postsynaptic neurotransmitter receptors, while female 5xFAD-DUSP6 showed seven significant synaptic pathways (p < 0.05) including regulation of synaptic assembly (Figure 6A). Several DEGs, which include Baiap3, Oprk1, Hap1, Fxyd6, Adra2a, Efnb2, Actn2, Nos1, Grin3a, Mapk3, Slc6a7, and Cadm1, were upregulated in male 5xFAD-DUSP6 but not in female 5xFAD-DUSP6, and these DEGs are either directly or indirectly associated with synaptic regulation. The top ten significant pathways in female 5xFAD-DUSP4 were involved in both postsynaptic and presynaptic activity, while male 5xFAD-DUSP4 showed two significant pathways (p < 0.05), one of which was involved in postsynaptic neurotransmitter receptor activity (Figure 6A). Comparison of the synapse-associated DEGs identified by SynGO indicated that there were no overlapping DEGs (p < 0.05) between male and female 5xFAD overexpressing DUSP4, and no overlapping DEGs (p < 0.05) between male and female 5xFAD overexpressing DUSP6, while three DEGs were shared between male 5xFAD-DUSP6 and male 5xFAD-DUSP4, and four DEGs between female 5xFAD-DUSP6 and female 5xFAD-DUSP4 (Figure 6B). DUSP6 regulated more synapse-associated DEGs in male (33 DEGs) than in female (16 DEGs) 5xFAD (p < 0.05), while DUSP4 overexpression regulated more synapse-associated DEGs in female (48 DEGs) than in male (4 DEGs) 5xFAD (Figure 6B). Moreover, analysis using the Mouse Genome Informatics (MGI) database revealed that DUSP6 overexpression regulated DEGs associated with spatial learning, long term potentiation, and cued conditioning behaviors in male 5xFAD mice, while DUSP6 overexpression regulated mainly pro-inflammatory pathways in female 5xFAD (Figure 6C).
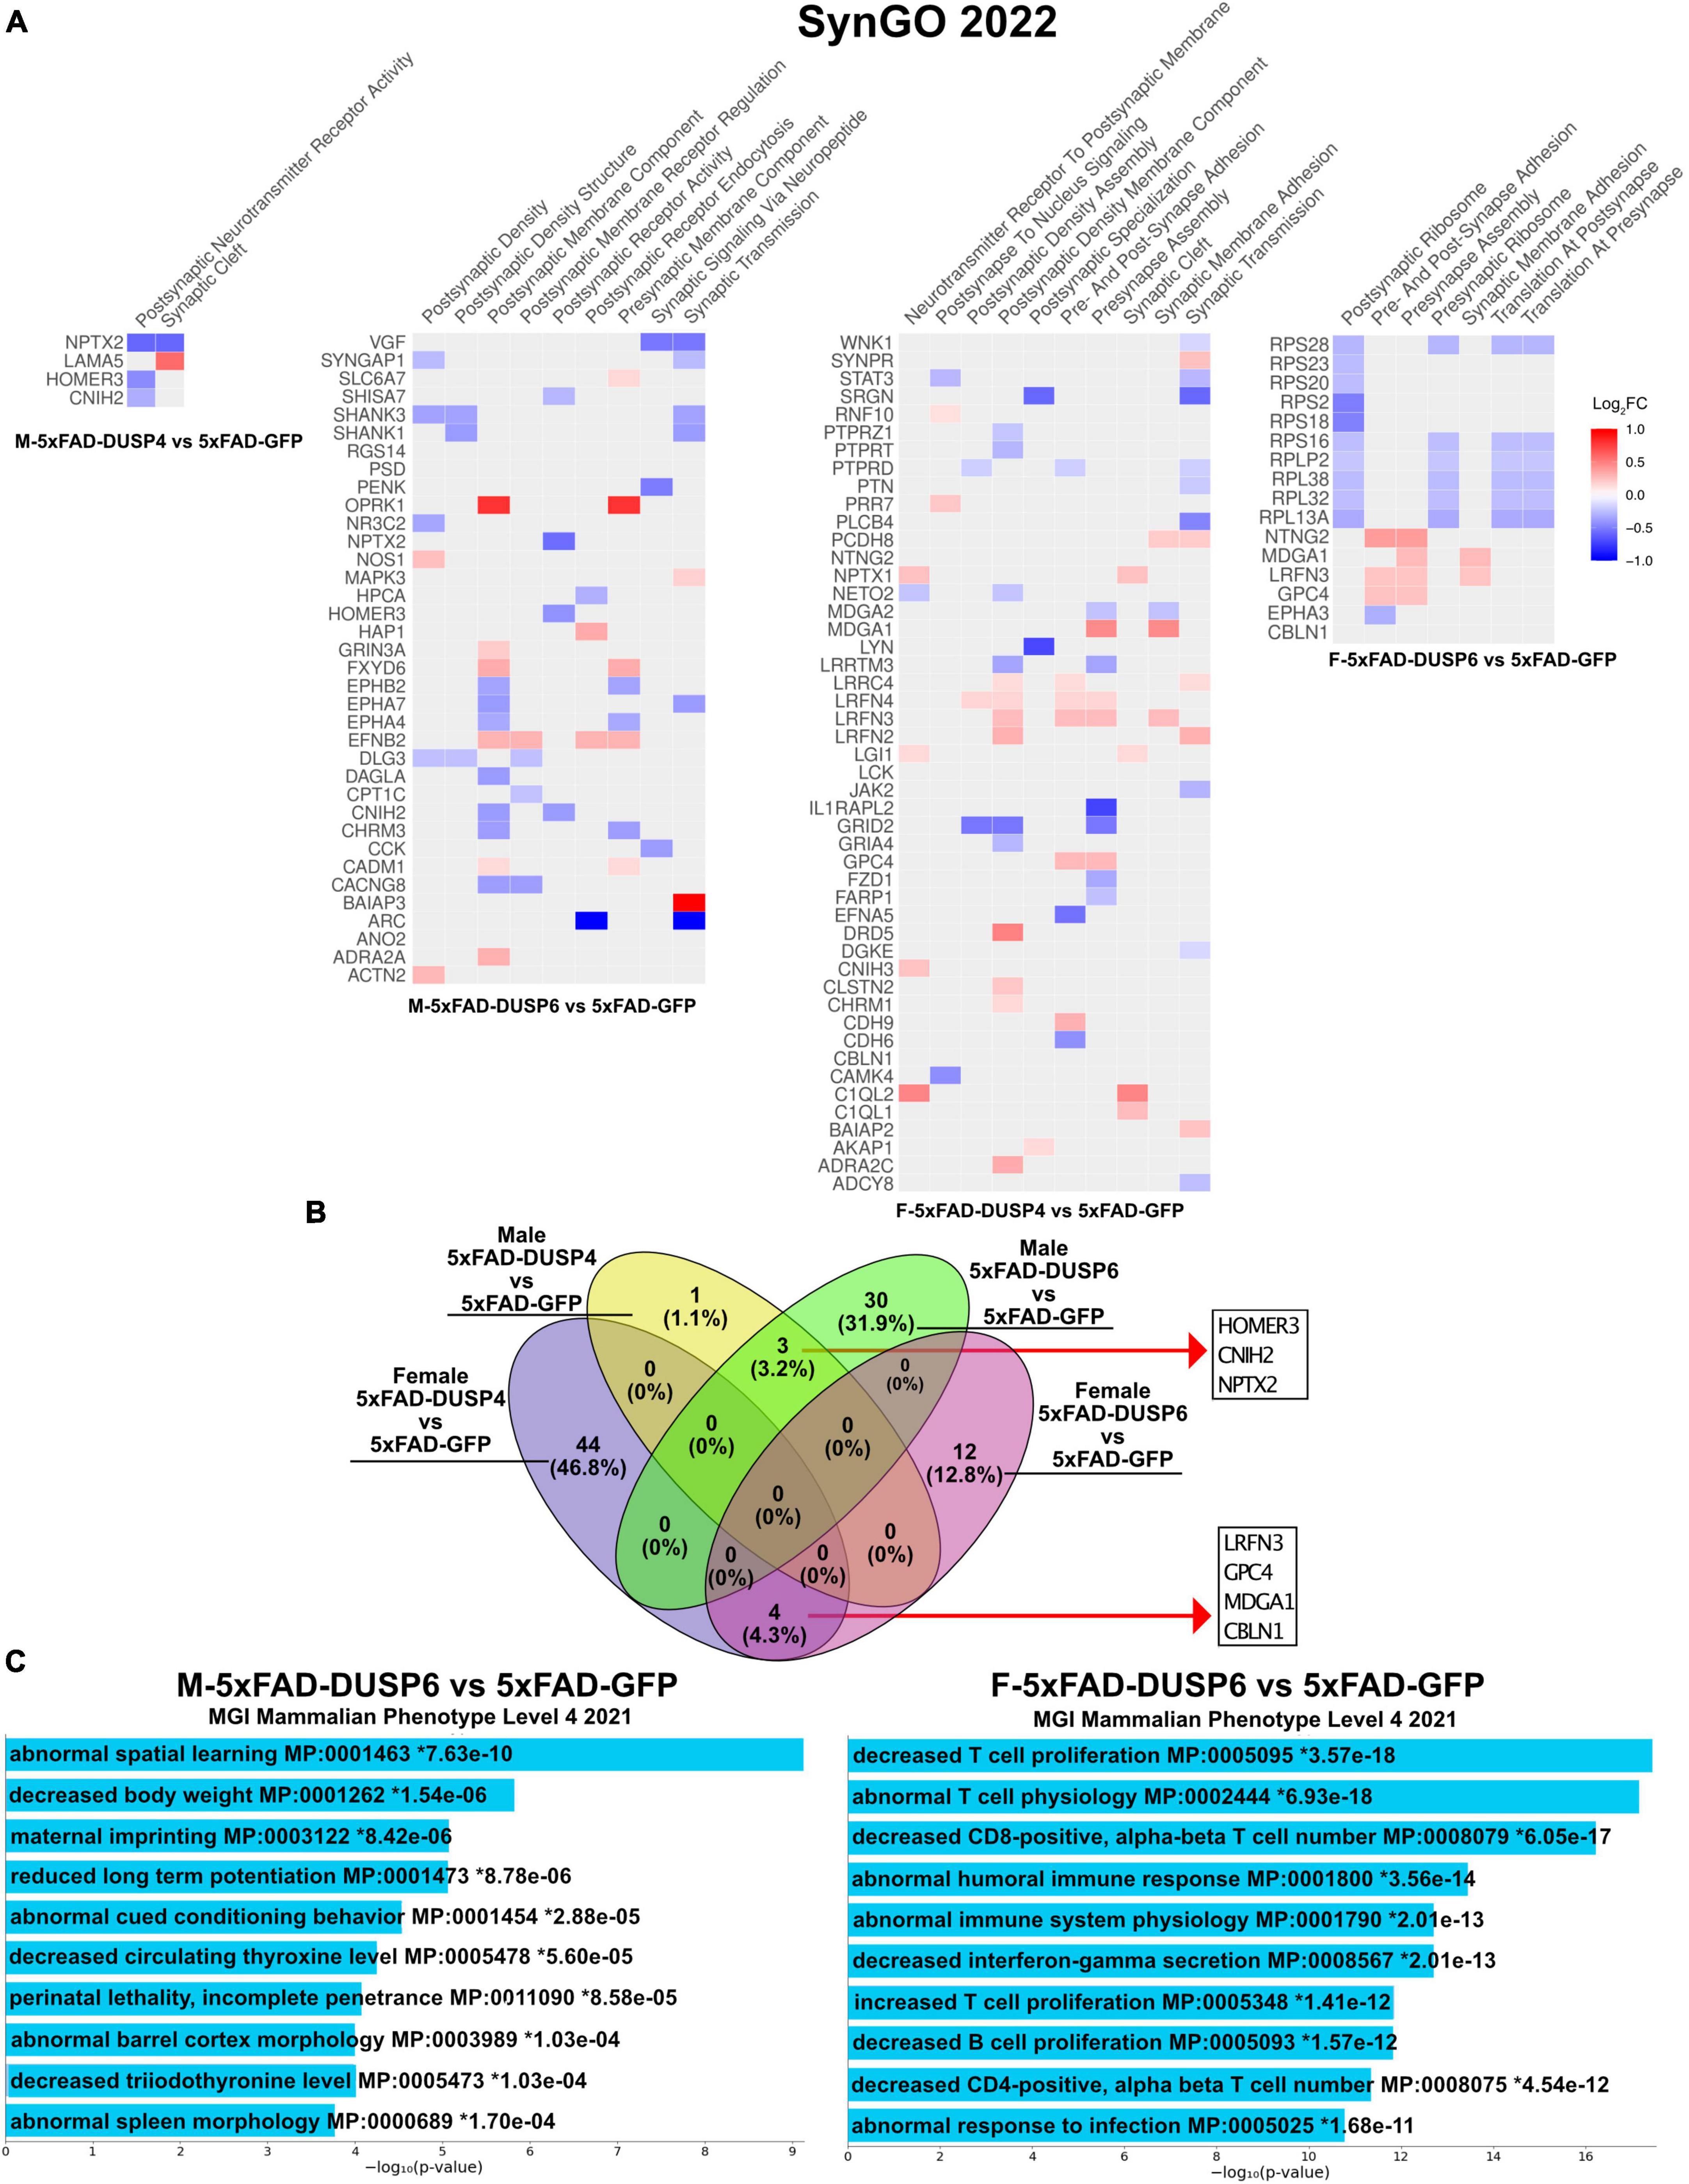
Figure 6. Gene ontology (GO) enrichment analysis of DEGs (p < 0.05) of female and male 5xFAD mice overexpressing DUSP4 or DUSP6. (A) Enrichr was used to perform Synaptic Gene Ontologies (SynGO) analysis of DEGs (p < 0.05) from female and male 5xFAD mice overexpressing DUSP4 or DUSP6. (B) Ven
留言 (0)