Sample and Data Sources
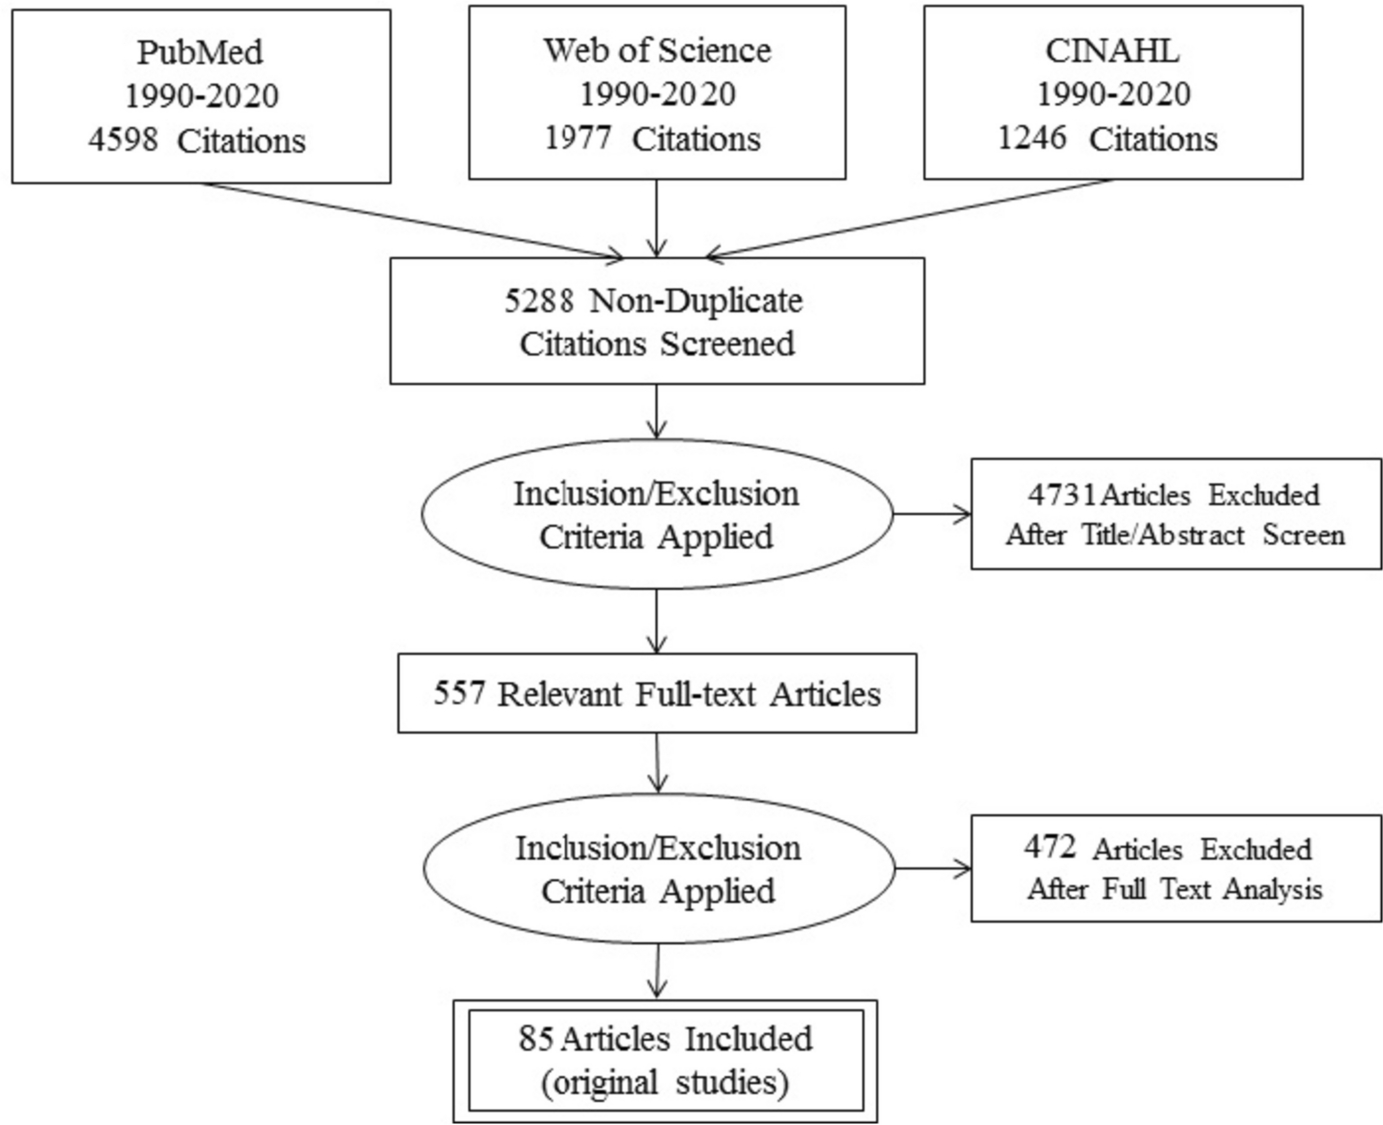
A sample of 356 subjects aged between 65 and 100 was drawn from the population register of the firm’s retirees eligible for participating in the Foundation’s program.Footnote 2 The sample was stratified by gender, age, and former occupational category. To ensure its representativeness, we additionally used the distance in Km between the Foundation and the residence of each subject and calculated individual weights as the inverse of the predicted probability of inclusion in the sample. A large amount of information on participation into the program, socio-demographic characteristics, lifestyle, social engagement, health conditions, mental well-being, was collected through a survey, administered by medical staff employed in the Foundation between February 2018 and August 2019 via computer-assisted, face-to-face interviews. The different data sources have been matched to the individual records via an anonymous personal identification number. Out of the 356 subjects, 269 were actively participating in the healthy aging program during the survey administration period. We define this group as the “participants”. 87 subjects did not participate in any activity. We define this group as the “non-participants”. To better understand the reasons for non-participating, in Table 6 in the Appendix we explore whether burdens in family care responsibilities can account for non-participation. Approximately 72% of participants and 68% of non-participants are married. Although information regarding the health status of spouses is unavailable, a substantially majority of subjects, more than 80% in both groups, report having family members capable of aiding and supporting when needed. 86% of participants and 80% of non-participants have children, while 65% of participants and 59% of non-participants have grandchildren. The average number of children in both groups is 1.7. Participants’ children, on average, are approximately 44 years old, while non-participants’ children are slightly older, averaging around 46 years old. The age of grandchildren is similar for both groups, averaging around 11 years old. By performing, for each observed characteristic, a t-test for difference in mean, we do not detect significant differences among the two groups. This exercise, although descriptive, reassure us in claiming that we do not detect significant differences in the profiles and main attributes of participants and non-participants’ families.
The purpose of the study is to compare lifestyles, health outcomes, and healthy life expectancy between the two groups and describe the association between participation into the multi-dimensional program and health and social outcomes. Since the allocation of subjects among the group of participants and non-participants is clearly non-random, in the empirical exercise we explicitly model individuals’ self-selection into participation, controlling for observable characteristics as well as the distribution of unobservable traits correlated with the decision of taking part into the program.
Variables
Healthy lifestyle was assessed based on self-reports on nutrition, exercise, smoking and alcohol consumption. Four healthy lifestyle indicators have been constructed: i) Active, which indicates whether the individual is regularly active - walking, cycling; ii) Physical exercise, which indicates whether the individual regularly exercises; iii) Healthy nutrition, which identifies adherence to the Mediterranean diet - daily consumption of fruit and vegetables, weekly consumption of fish and dried fruit, limited consumption of sugars; iv) Smoking and drinking. Following the literature on the relationship between lifestyles and health conditions (Haveman-Nies et al., 2002) these four indicators have been combined to define a synthetic indicator of healthy lifestyle. This indicator takes value 1 if the subject regularly performs some movement or physical exercise, follows a healthy diet, does not smoke, and does not habitually consume alcohol.
Social engagement was assessed based on self-reports on social relationships. The outcomes of interest are the quantity of social interactions - the size of the social network - and the intensity of these interactions. To measure the size of the social network, subjects were asked “Do you have one or more people you can count on?”. 90% of the interviewees answered positively. Subsequently, the subjects were asked to name, in order of relevance, the first four people with whom they usually interact. The indicator on quantity of social interactions takes value 1 if the individual nominated at least three persons. To measure the frequency of interactions, subjects were asked, for each person indicated, "How often do you see him/her?". Possible answers were “Every day”, “More than once a week”, “Once a week”, “A few times a month”, “A few times a year”. The frequency indicator assumes value 1 if the individual declares to interact with each member of the social network at least once per week. The social engagement indicator takes value 1 if both the quantity and frequency indicators are equal to 1.
Health status was assessed based on self-related health. Self-related health is generally considered a good summary of the overall health of an individual, although it may suffer from substantial reporting heterogeneity, resulting from differences in health perception. Subjects were asked to rate their overall health on a five-point scale: very good, good, fair, bad, and very bad. Using the answers to this question we built an indicator of self-assessed health, SAH, equal to 1 if the subject perceives his/her health condition “Bad” or “Very bad”. In addition, the survey includes several other self-reported objective health measures (e.g., suffering from chronic diseases and disabilities). To summarize this large amount of health information we followed Bound et al. (1999) and Mazzonna and Peracchi (2017) and built a single health index by estimating the following model:
where SAHi is the dichotomous variable on self-assessed health equal to 1 if the individual i assess his/her health condition as “Bad” or “Very bad”. Hi is a vector of objective measures of health status (chronic diseases, obesity, diabetes, dyslipidaemias, hypertension, diseases of the respiratory system, disability), while εi is the erratic component of the equation relating to unobservable factors that can influence health conditions (the hypothesis is that the error terms are independent and identically distributed, IID). Our summary health status variable is conditioned on objective health conditions and computed as the predicted probability of suffering from bad health.
Mental well-being was assessed based on self-related psychological well-being. Subjects were asked “During the past four weeks, how many times did you feel sad, discouraged?”. Possible answers were “Often”, “Sometimes”, “Rarely”, or “Never”. We built an indicator of mental distress equal to 1 if the subject reported to feel sad and discouraged “Often” or “Sometimes”.
Empirical AnalysisEffects of the Program on Lifestyles and Social Engagement
In a first step of the analysis, we assessed how participating into the healthy aging program directly affects the probability of following a healthy lifestyle and being socially engaged. The relationship between the status of participant versus non-participant and the indicators of healthy lifestyle and social engagement was estimated with ordinary least squares (OLS), controlling for a series of observable - age and gender - and unobservable confounding factors. The distribution of unobservable confounding factors is retrieved from the latent decision to participate or not in the Foundation's activities. Using a propensity score methodology, we calculated the conditional probability of attending the program on the basis of a vector of individual characteristics - age and gender - and an exclusion restriction - distance in Km between the place of residence and the Foundation. Notice that, since the location of the Foundation is different from the main factory where the workers were employed before retirement, we regard the distribution of the distance from the Foundation as good as random.Footnote 3 From the estimated propensity scores, we computed deciles of the latent propensity to participate in the Foundation’s activities. Following a control function approach, the vector of these deciles was then included in the equations of interest (Lunt, 2014). As discussed above, this method allows to assimilate the distribution of the subjects to treatment-control as if it were in the presence of a (quasi) random allocation.
In practice, we estimated the following equation:
$$_\left(_, _\right)\;=\; _+ __\;+\;__\;+\;_\;+\; }_\varphi \;+\;_$$
(1)
where Yi represents, for each individual i, the indicator of healthy lifestyle (HLi), or social engagement (Si). Pi is an indicator equal to 1 if the subject participates in the Foundation’s program, 0 otherwise. gi is an indicator for being female. δc controls for age cohorts. Di is the vector of deciles of propensity scores that controls for the decision to participate into the program. εi is the error term.
Mediation Analysis: Direct and Indirect Effects of the Program on Health Status
In a second step, we assessed the effects of the program on participants’ health conditions and mental well-being through a mediation analysis. Rather than looking only at the direct effects of attending the Foundation’s activities on psycho-physical health, we propose a mediation model in which we assume that participating in the program induces relevant indirect changes in behaviours - such as healthier lifestyles and higher social engagements - and these, in turn, influence health outcomes and mental well-being. To verify this assumption, we estimate the following equation:
$$_(}_, _) = _ + __ + __ + __ + __ + _ + ^}_\varphi + _$$
(2)
where \(}_\), is the predicted probability of suffering from bad health, a number ranging from 0 (good health) to 1 (bad health). Mi is the indicator for mental distress. The other variables are defined as in Eq. (1). In practice, we are assuming that Pi affects \(}_\), and Mi both directly and indirectly by affecting HLi and Si. We thus want to capture the size and significance of these effects by estimating the impact of the program on the outcomes under analysis, conditional on lifestyle and social engagement.
As a robustness check, we replicated the two analyses with propensity score matching. This approach - widely used in observational studies to try to reduce the bias due to the selection of individuals into treatment - allows to evaluate the effects of a given intervention controlling for the confounding factors that predict participation in the intervention itself. The estimated effect is the average treatment effect on the treated (ATT), i.e., exactly the parameter of interest: the effect of the participation in the program on the outcomes of interest.
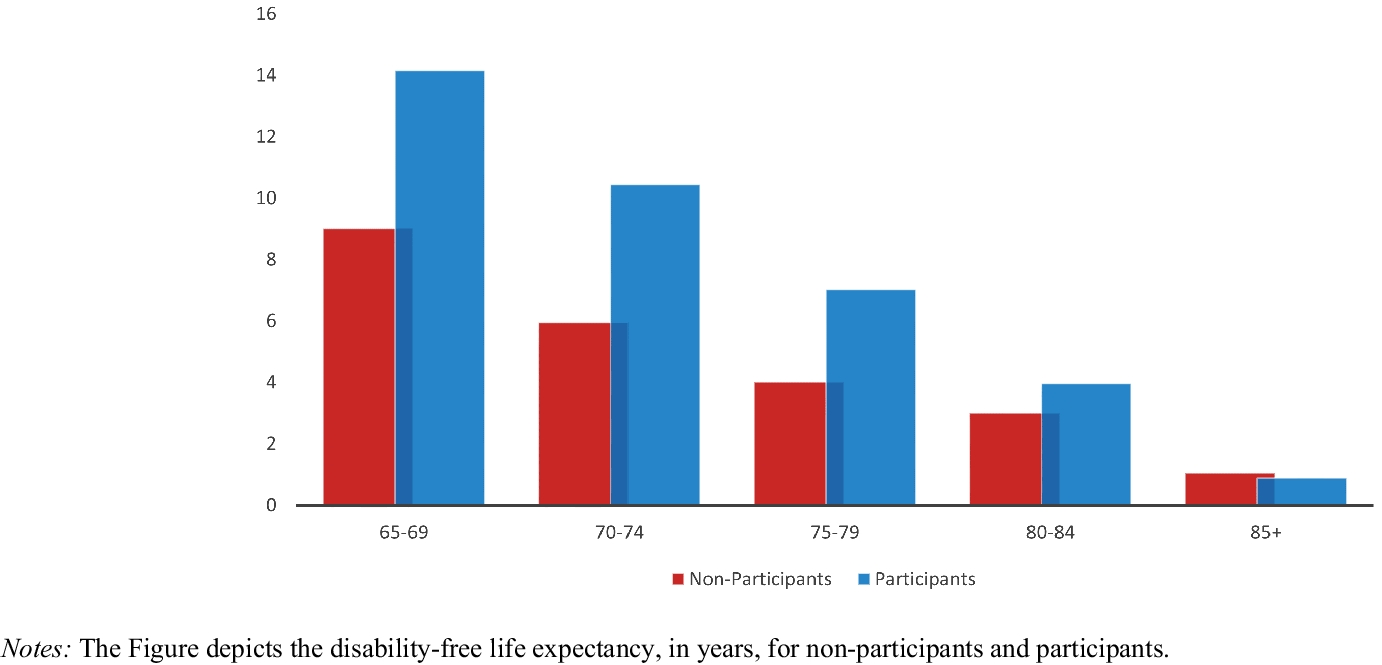
Disability-free Life Expectancy
We calculated the disability free life expectancy by Sullivan’s method. Health expectancy calculated by Sullivan’s method is the number of remaining years, at a given age, which an individual can expect to live in a healthy state. We define healthy state as the absence of chronic conditions. The mortality (survival) rate of participants and non-participants was built based on the number of deaths recorded in the two groups, information contained in the population register of the company’s employees eligible to participate in the program. The morbidity rate was constructed from the information on chronic diseases collected in the survey. Healthy life expectancy was separately calculated for participants and non-participants in the following way:
$$_\;=\;\frac_}\sum (1\;-\;_)_$$
(3)
where DFLEn is the disability-free life expectancy, the life expectancy in absence of chronic conditions for the age cohort n (65–69, 70–74, 75–79, 80–84, 85+). ln is the number of surviving in cohort n; \(_\) is the proportion of subjects in cohort n suffering from a chronic condition; Ln is the person-years lived in cohort n.Footnote 4. The index is calculated as a standard indicator of life expectancy for each age cohort, with the only difference that the cumulative number of years lived is multiplied by the proportion of subjects who do suffer from chronic conditions.

留言 (0)