
記住我


The term motor imagery has been used in literature to indicate the visual (i.e., imagine to “see”) and kinaesthetic (i.e., imagine to “feel”) imagination of a movement without execution (Jeannerod, 1994, 2001; Decety, 1996; Mulder, 2007). Since the first seminal studies in the 1930s (Sackett, 1934, 1935), a large body of evidence shows that motor imagery and actual action execution share similar cognitive and neural processes. For example, the time taken to mentally imagine versus execute a movement has been shown to be similar (Decety and Michel, 1989; Sirigu et al., 1995) suggesting that imagery is based on overlapping action execution cognitive processes. Similarly, execution and motor imagery both adhere to Fitts’s law, whereby the time to execute or imagine a movement is moderated by accuracy demands (Decety and Jeannerod, 1995; Macuga et al., 2012; Macuga and Frey, 2012). According to the “functional equivalence hypothesis” (following motor simulation theory, cf. Jeannerod, 1994, 2001), similarities between actual execution and motor imagery emerge from shared motor-cognitive (neural) processes, allowing for the imagined rehearsal of movement using cognitive motor planning processes (Jeannerod, 2001). The functional equivalence hypothesis has received strong support, primarily from brain imaging studies which have demonstrated that motor imagery and actual motor execution involve similar activation of brain areas (Porro et al., 1996; Grezes and Decety, 2001; Sharma and Baron, 2013). These brain activations include a distributed premotor-parietal network, involving several subcortical structures, such as the putamen and cerebellum (Grezes and Decety, 2001; Hardwick et al., 2018). Further indirect evidence for equivalence comes from sport (Guillot and Collet, 2008; Williams et al., 2012) and clinical literature, which have shown that the mental practice of movement through motor imagery (i.e., the repetitive exposure to motor imagery of movements) can be effective for learning motor skills (Dijkerman et al., 2010; Barclay et al., 2020). The potential efficacy of mental practice in sport training and in motor rehabilitation is supported by the finding that motor imagery practice can induce plastic changes in motor networks (for a review see Ruffino et al., 2017).
Despite this common notion of the evidence for functional equivalence, technical constraints make measures of motor imagery extremely challenging for researchers, even in experimentally controlled settings. Motor imagery is a covert process. This means that, without comparison to actual execution, it is not always clear what is being measured by recording brain activations during motor imagery. Furthermore, neural measurement during movement execution is also limited, in particular for whole-body movements such as walking (Ladouce et al., 2017). Understanding the motor imagery of walking requires capturing the neural processes during whole-body movements, which cannot be done while lying in a brain scanner (nor while seated in a typical neurophysiology lab). Instead, researchers investigating functional equivalence between motor imagery and execution have constrained actions to simplistic hand movements that are feasible in an fMRI scanner. A further constraint is that imagined movements in experimental fMRI studies are performed lying down, whereas the imagined movements are more normally performed upright, or sitting (Jahn et al., 2004, 2008; Bakker et al., 2007; La Fougere et al., 2010; Malouin et al., 2013; Hamacher et al., 2015). It is possible that incongruence between body posture and imagined action causes an issue for ecological validity, also because the compatibility of the body position has been shown to affect motor imagery performance. For example, the time taken to perform motor imagery is most similar to actual execution when participants are positioned in a congruent compared to incongruent posture for the imagined relative to executed movement (Parsons, 1994; de Lange et al., 2006; Conson et al., 2011; Saimpont et al., 2012). These latter findings are important, as investigating the neural substrate and cognitive processes underlying motor imagery and action execution must be investigated using congruent and equivalent complex motor actions (Barton and Pretty, 2010; Menicucci et al., 2020).
Motor imagery is an established method of upper and lower-limb neuro-rehabilitation used with patients after stroke (Barclay et al., 2020). Considering that deficits of lower limb function are a common disability after stroke, it is surprising that there is just one single study to date that compares the neural activation of the execution and motor imagery of walking (La Fougere et al., 2010). They captured global neural activation during walking using PET imaging, and compared neural activation to motor imagery of walking using fMRI while lying flat. La Fougere et al. (2010) showed PET neural activation during walking execution involved primary motor cortex and somatosensory activation, while the fMRI neural activation measured during motor imagery of walking involved the activation of the supplementary motor area and basal ganglia. There are, however, some fundamental limitations to that study, in particular with regards to the design. Firstly, the measures of PET and fMRI are quite different, and it is not clear why the neural correlates of execution and motor imagery in that study were not measured using the same imaging methods allowing direct comparison. Secondly, activation of execution was captured through isotopic decay measured in the PET scanner after people had been walking. While ingenious as a solution and to be admired in its ambition as an early attempt of neuroimaging of real-world whole-body movements, the neural correlates are difficult to compare to motor imagery assessed through fMRI while the participant is performing the imagery. Thirdly, as stated above, differences are expected in brain imaging investigations of motor imagery where participants lay supine imagining the upright movement of walking. In conclusion, while groundbreaking, in many ways, the study of La Fougere et al. (2010) provided limited insight into the neural correlates of whole-body motor imagery functional equivalence.
Recent development of mobile electroencephalogram (EEG) technology solves many of the constraints discussed above, including the ability to record brain activity during naturalistic movement. EEG recordings allow a characterization of highly accurate temporal brain rhythm dynamics that reflect cognitive processing, overcoming many of the limitations of functional MRI scanning. Furthermore, the high temporal accuracy of EEG offers the possibility to disentangle cognitive processes occurring during motor imagery and action execution at different time points. It is crucial to investigate the neural correlates of these processes considering the growing applications of motor imagery in clinical settings. Indeed, motor imagery of movements represents one of the main cognitive tools being used within the brain-computer interface (BCI) approach, as it can be applied in absence of physical involvement and can be employed as a self-regulatory control signal of motor brain areas. The principle of the BCI approach is to detect neural signals to control external devices, such as exoskeletons or wheelchairs (Leeb et al., 2007; Choi and Cichocki, 2008; Lafleur et al., 2013) or prostheses (Pfurtscheller et al., 2003). It is therefore important to understand which are the neural correlates of walking imagery as they can be used as self-regulatory signals for motor learning and recovery in patients with gait impairments (Malouin and Richards, 2010; Kranczioch et al., 2014; Daeglau et al., 2020).
EEG investigations of motor imagery in isolated movements such as those of the foot or the hand have found decreased and increased spectral power, often termed event related desynchronization and synchronization, respectively. These changes in power are most often found in the alpha (8–12 Hz) and beta (13–35 Hz) frequency bands, occurring over sensorimotor (Pfurtscheller et al., 1997; Pfurtscheller and Neuper, 1997; Neuper and Pfurtscheller, 2001) and parietal-occipital (Salenius et al., 1995; Xie et al., 2020; Putzolu et al., 2022) brain areas. Generally, it is accepted that power decreases in the alpha and beta frequency bands are related to the activation of relevant brain areas during a given task, whereas power increases are associated with inhibition (Pfurtscheller, 1999; Pfurtscheller and Da Silva, 1999; Klimesch, 2012). Indeed, both alpha and beta decrease of power over sensorimotor areas are typically visible during movement preparation (Tzagarakis et al., 2010; Rhodes et al., 2018), the execution of movements (Pfurtscheller and Berghold, 1989; Stančák et al., 1997; Cassim et al., 2000; Kaiser et al., 2003; Kilavik et al., 2013) and have been consistently reported in previous EEG investigations of walking (Gwin et al., 2011; Bulea et al., 2015; Bradford et al., 2016). On the other hand, power increases in the alpha band have been associated with the inhibition of task-irrelevant information (Neuper et al., 2006; Klimesch, 2012), whereas beta power increases are associated with the recalibration of the motor system (Engel and Fries, 2010). Although previous EEG investigations have provided evidence of the engagement of sensorimotor brain areas during action execution and motor imagery, research has typically focused on upper limb movements, while participants were sitting, performing small hand or finger movements (e.g., finger-tapping). Studies of lower limb imagery were mostly limited to imagery of minimal movement, such as the dorsiflexion of the foot (Neuper et al., 2010; Pfurtscheller et al., 2006; Solis-Escalante et al., 2008, 2012; Müller-Putz et al., 2010; Hashimoto and Ushiba, 2013), stepping in place (Kline et al., 2021), or they did not contrast cortical activation with the actual execution of movement (Putzolu et al., 2022). Furthermore, existing EEG investigations on motor imagery have tended to focus on identifying reliable signals for brain-computer interface (BCI) control as mentioned above, allowing for connection between the oscillatory activity of the brain to control a computer (Wolpaw et al., 2002). Consequently, EEG recordings in these studies have typically involved a limited number of channels (leaving cognitive questions less explored). No existing studies report a systematic assessment of similarities and differences in brain activity and cognitive mechanisms underlying the actual execution and motor imagery of walking.
Therefore, the aim of the present study was to investigate the similarities and differences of neural activations associated with action execution and motor imagery of walking movements using a mobile EEG approach. In a within-subject study design, we asked participants to walk, or to imagine walking (in a movement compatible standing position), at a natural pace, along a path. To enhance the sensorimotor experience, we asked participants to perform the imagery straight after walking, using a first-person perspective and focussing on the kinaesthetic experience (feeling the sensations as if actually walking), which has been shown to elicit greater motor activation compared to visual motor imagery from a third person perspective (Lorey et al., 2009; Mizuguchi et al., 2017). Furthermore, we used a mental counting task as a non-motor control condition to ensure that during imagery, participants were not just counting steps, but instead actually imagined themselves walking. We assessed similarities and differences between motor imagery and actual execution by comparing the temporal and spatial features of EEG patterns. Specifically, we examined the time course and the spatial distribution of power spectral changes in alpha and beta frequency bands, according to previous literature on motor imagery (Pfurtscheller et al., 1997; Pfurtscheller and Neuper, 1997; Neuper and Pfurtscheller, 2001).
2 Methods 2.1 ParticipantsA total of 24 healthy participants (23 female; age range = 18–44 years; mean = 22.16 years, SD = 6.8 years) took part in the experiment. Sample size was determined by research on relevant literature (see Hashimoto and Ushiba, 2013; Kline et al., 2021; Putzolu et al., 2022). The data from three participants were excluded due to the presence of prominent artifacts in EEG recordings. The remaining data of 21 participants (20 female; age range = 18–44 years; mean = 21.43 years, SD = 5.5 years) were included in the reported analyses. Height (169.05 ± 8.02 cm), weight (67.5 ± 15.39 Kg) and walking speed (5.29 ± 0.56 Km/h) were also recorded for each participant. The participants had no history of neurological disorders and were right-handed (self-reported). Before the experiment, all the participants gave written informed consent. Ethical approval was provided by the local research ethics committee.
2.2 Materials and procedureParticipants were asked to complete four experimental conditions: (i) Actual walking, (ii) Motor Imagery of walking, (iii) Mental Counting, and (iv) Observation of walking. In this study, we focus on the comparisons between Motor Imagery, Actual Execution and Mental Counting; the analyses related to action observation are reported in a separate article (Mustile et al., 2022). Participants completed a total of 120 trials (40 trials for each condition) divided into 6 experimental blocks of 20 trials each. During the mental counting (MC) condition, participants were standing and instructed to listen to 6 consecutive tones (107 dB, interval of 600 ms), and then to mentally count up to six using the same time frequency. They were asked to say out loud “six” when they finished the mental count. During the execution of walking (EXE) condition, participants were instructed to take 6 steps on a 6 m long carpet. They walked up and down the carpet without stopping. A laser beam at each end allowed trials to be separated so that just taking the six steps would amount to one trial in the EXE condition (turns were not included). During the motor imagery of walking (MI) condition, participants were instructed to take 6 steps, stop at the beginning of the 6 m carpet and then imagine feeling the sensation as if they were walking down the carpet by mentally performing 6 steps and “arrive” at the end of the path using motor imagery. They were asked to say out loud “stop” when they finished the sixth step of the mental walking task. One motor imagery trial would be the period between coming to a standstill to start the motor imagery and the time the participant said “stop.” To ensure the success of the task, participants were first trained for several minutes. During training, participants were first introduced to the kinaesthetic imagery perspective: an explanation of kinaesthetic imagery as the imagination of “feeling” the sensation of walking without moving and were given the opportunity to practice motor imagery through some examples in order to ensure that they understood the task. Secondly, they were told to concentrate their attention on the movement of their legs, and the “feeling” of pushing their foot on the ground, focusing on the sensation coming from their different muscles of the lower limbs. They were asked to try for several minutes before starting the block of MI, until they were certain that they would be able to perform the task. Depending on the condition, a trial was defined as the time period from when the participants started to mentally count until they said “six” (MC condition), from when they started to walk (6 steps) until the end of the path (EXE condition) and from when they started the imagery of walking until they said “stop” (MI condition). The order of conditions and experimental blocks were randomized across participants.
2.3 EEG recording and processingEEG data were recorded from 32 Ag/AgCl electrodes connected to a portable amplifier (ANT-neuro, Enschede, Netherlands). Electrodes were positioned according to the International 10–20 system: FP1, FPz, FP2, F7, F3, Fz, F4, F8, FC5, FC1, FC2, FC6, M1, T7, C3, Cz, C4, T8, M2, CP5, CP1, CP2, CP6, P7, P3, Pz, P4, P8, POz, O1, Oz, O2. AFz electrode was used as ground and CPz electrode was used as reference. The electrode impedances were reduced below 5 kΩ before the recording. During recording, EEG data were sampled at 500 Hz and bandpass filtered at 0.01–250 Hz. EEG data analyses were performed using custom scripts written in MATLAB 2019a (The MathWorks) incorporating EEGLAB toolbox (Delorme and Makeig, 2004). Data from the mastoid channels (M1 and M2) were removed from the analysis, and all remaining EEG data were filtered using a 0.1–40 Hz bandpass filter. EEG channels with prominent artifacts were automatically selected (kurtosis >5 SDs) and interpolated, and all channels were then re-referenced to the average. Data were downsampled to 250 Hz and an extended infomax Independent Component Analysis (ICA) (Makeig et al., 1995) was performed to identify and remove non-brain signals. Brain-related-ICs were identified using the IClabel plugin (Pion-Tonachini et al., 2019). Components exceeding a 90% probability of being eye, muscle, heart, line noise, and channel noise were rejected. Only brain ICs with dipoles located inside the head and a residual variance lower than 15% were kept. An average of (mean ± SD) 6.65 ± 0.81 ICs across conditions was retained for the analysis.
2.4 EEG analysisTo investigate the cortical dynamics during the overall length of trials across conditions, EEG data were segmented in epochs of 8,500 ms. An epoch lasted from −7,000 ms before the end of a trial to 1,500 ms after for each condition. Single channel spectrograms were time warped to the median latency of the start of the trial across participants for each condition (−3,826 ms for MC, −3,934 ms for MI, −3,522 for RW, respectively). Event related spectral perturbation (ERSPs) was computed as the mean difference between single trial log spectrograms for each channel and each participant across conditions and the mean baseline (−4,000 ms before to 1,500 ms after time 0). Single channel time frequency spectrograms were visually inspected to identify relevant changes in the spectral power in the a priori defined frequency bands of interest: alpha (8–12 Hz) and beta (13–35 Hz). Topographical scalp maps in the frequency bands of alpha and beta (Figures 1, 2A) were further visually inspected to identify relevant regions of interest (ROI). We identified central (FC1, FC2, C3, C4, CZ), parietal (CP1, CP2, P3, P4, PZ channels) and occipital (O1, O2, OZ, POZ) ROIs.
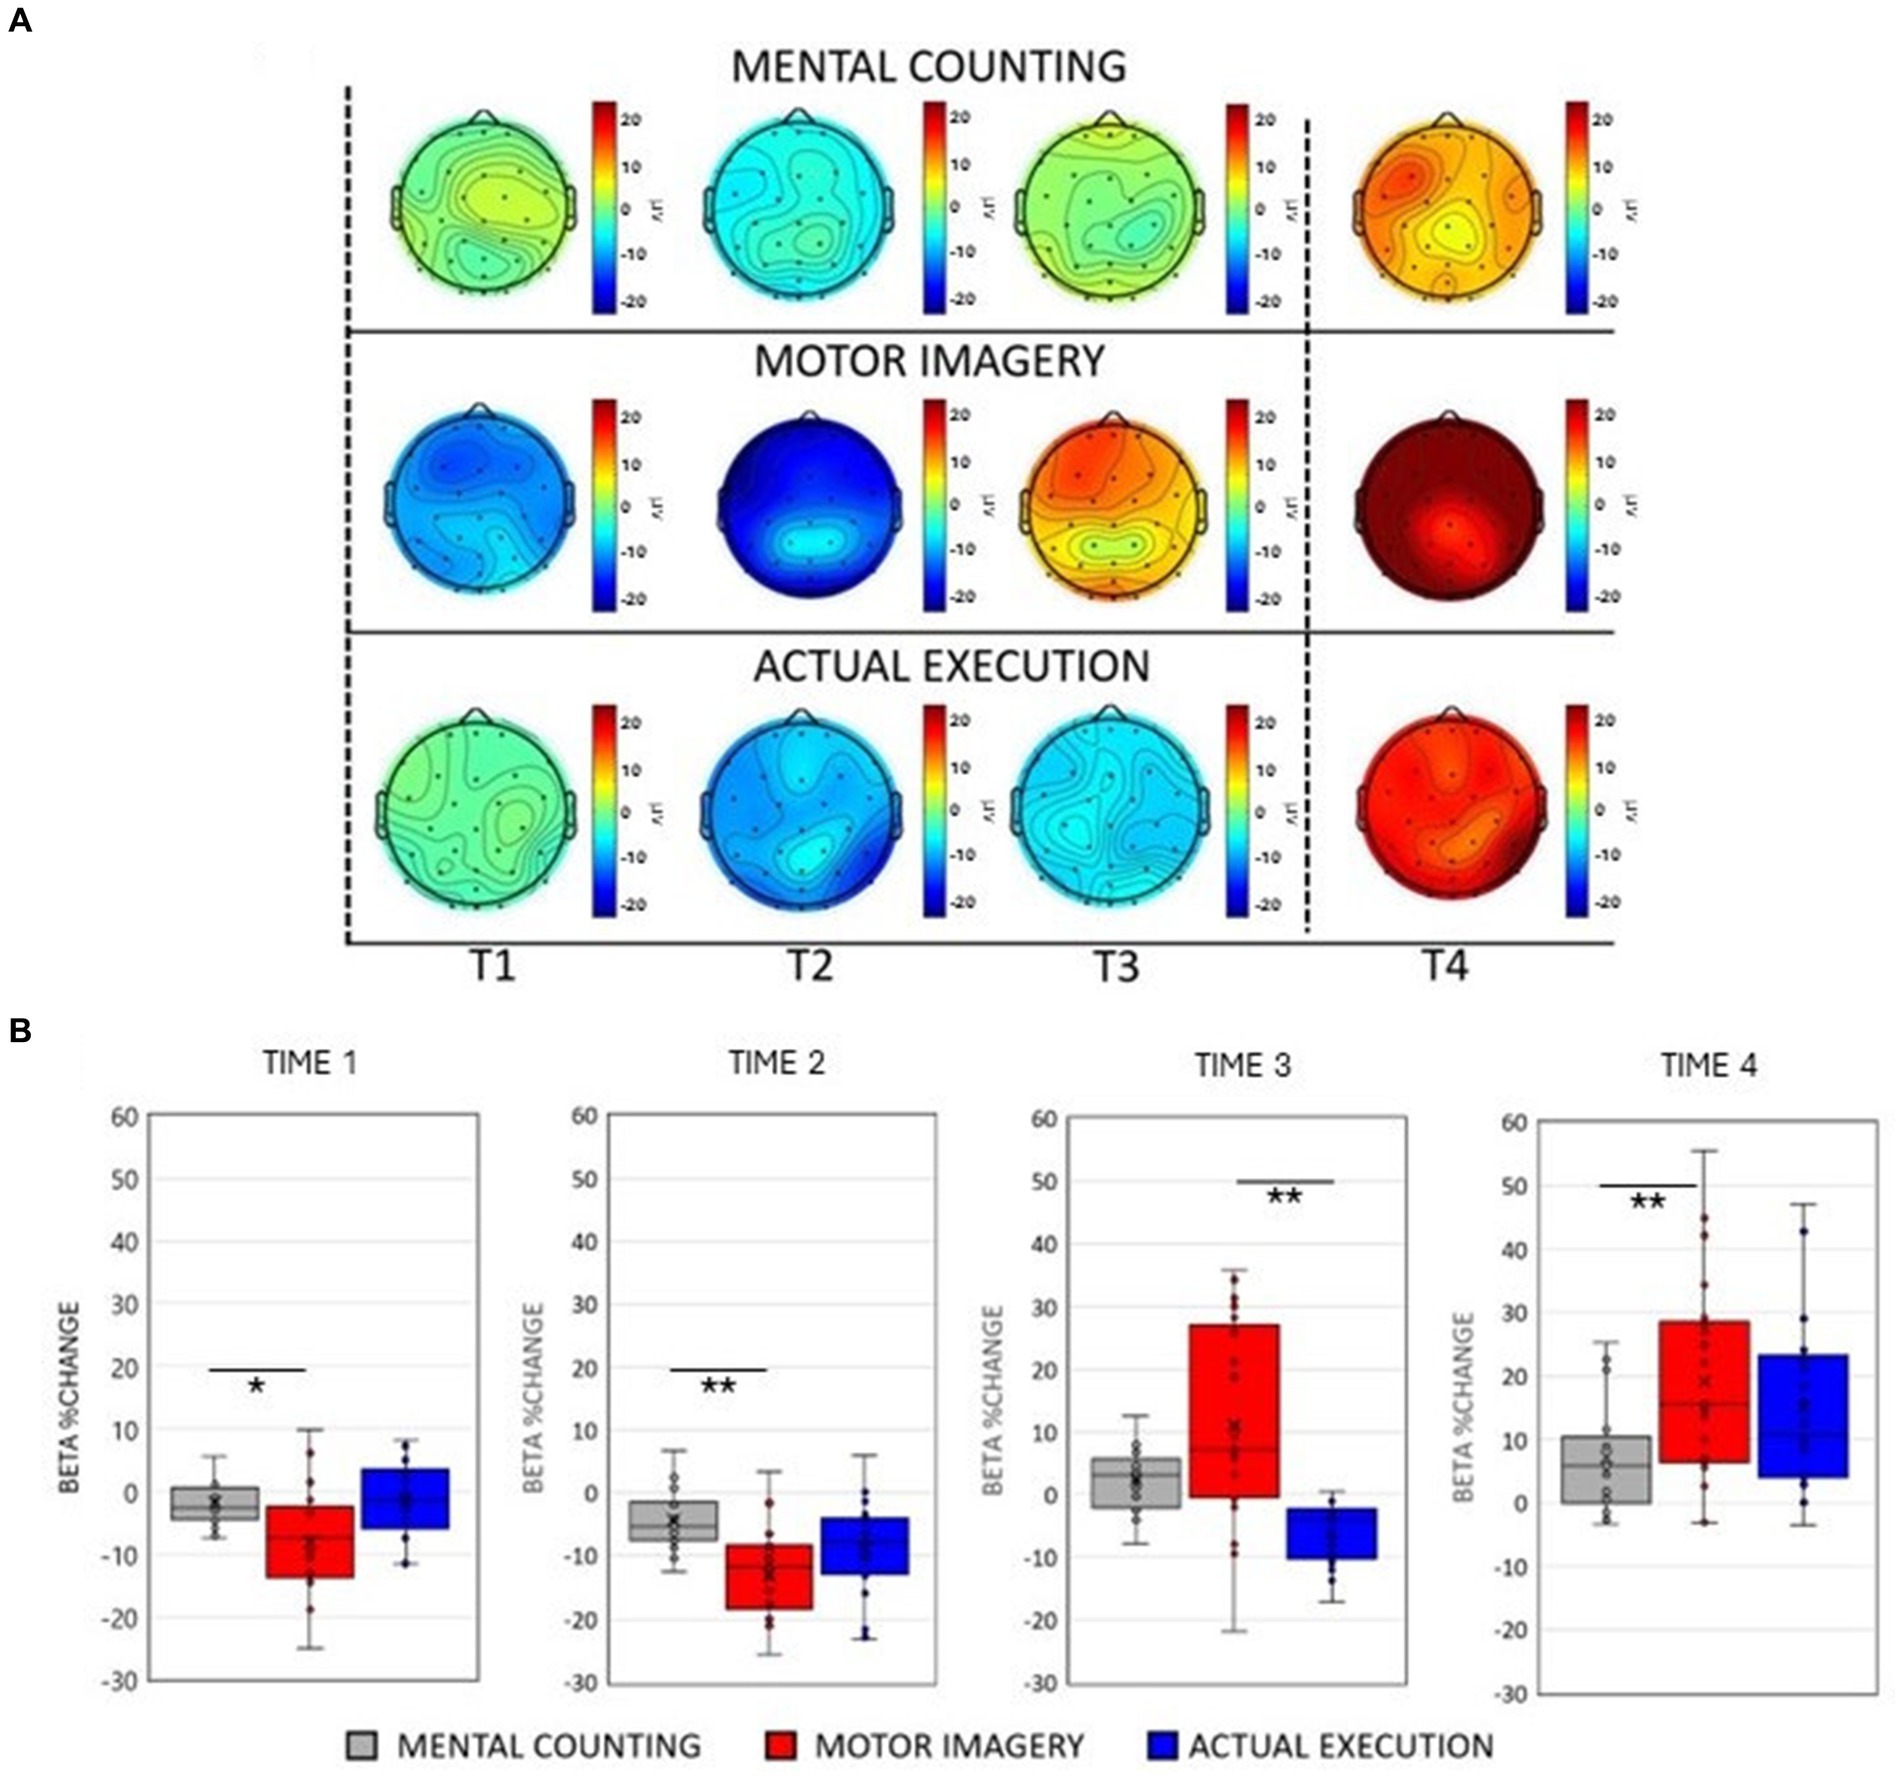
Figure 1. (A) Scalp maps topography of beta (13–25 Hz) spectral power across conditions and time. Dashed black lines represent the start and the end of the trial. (B) Averaged beta percentage change of power relative to baseline pooling the ROIs (central, parietal and occipital) for each condition in each time window. Significant comparisons are flagged with an asterisk.
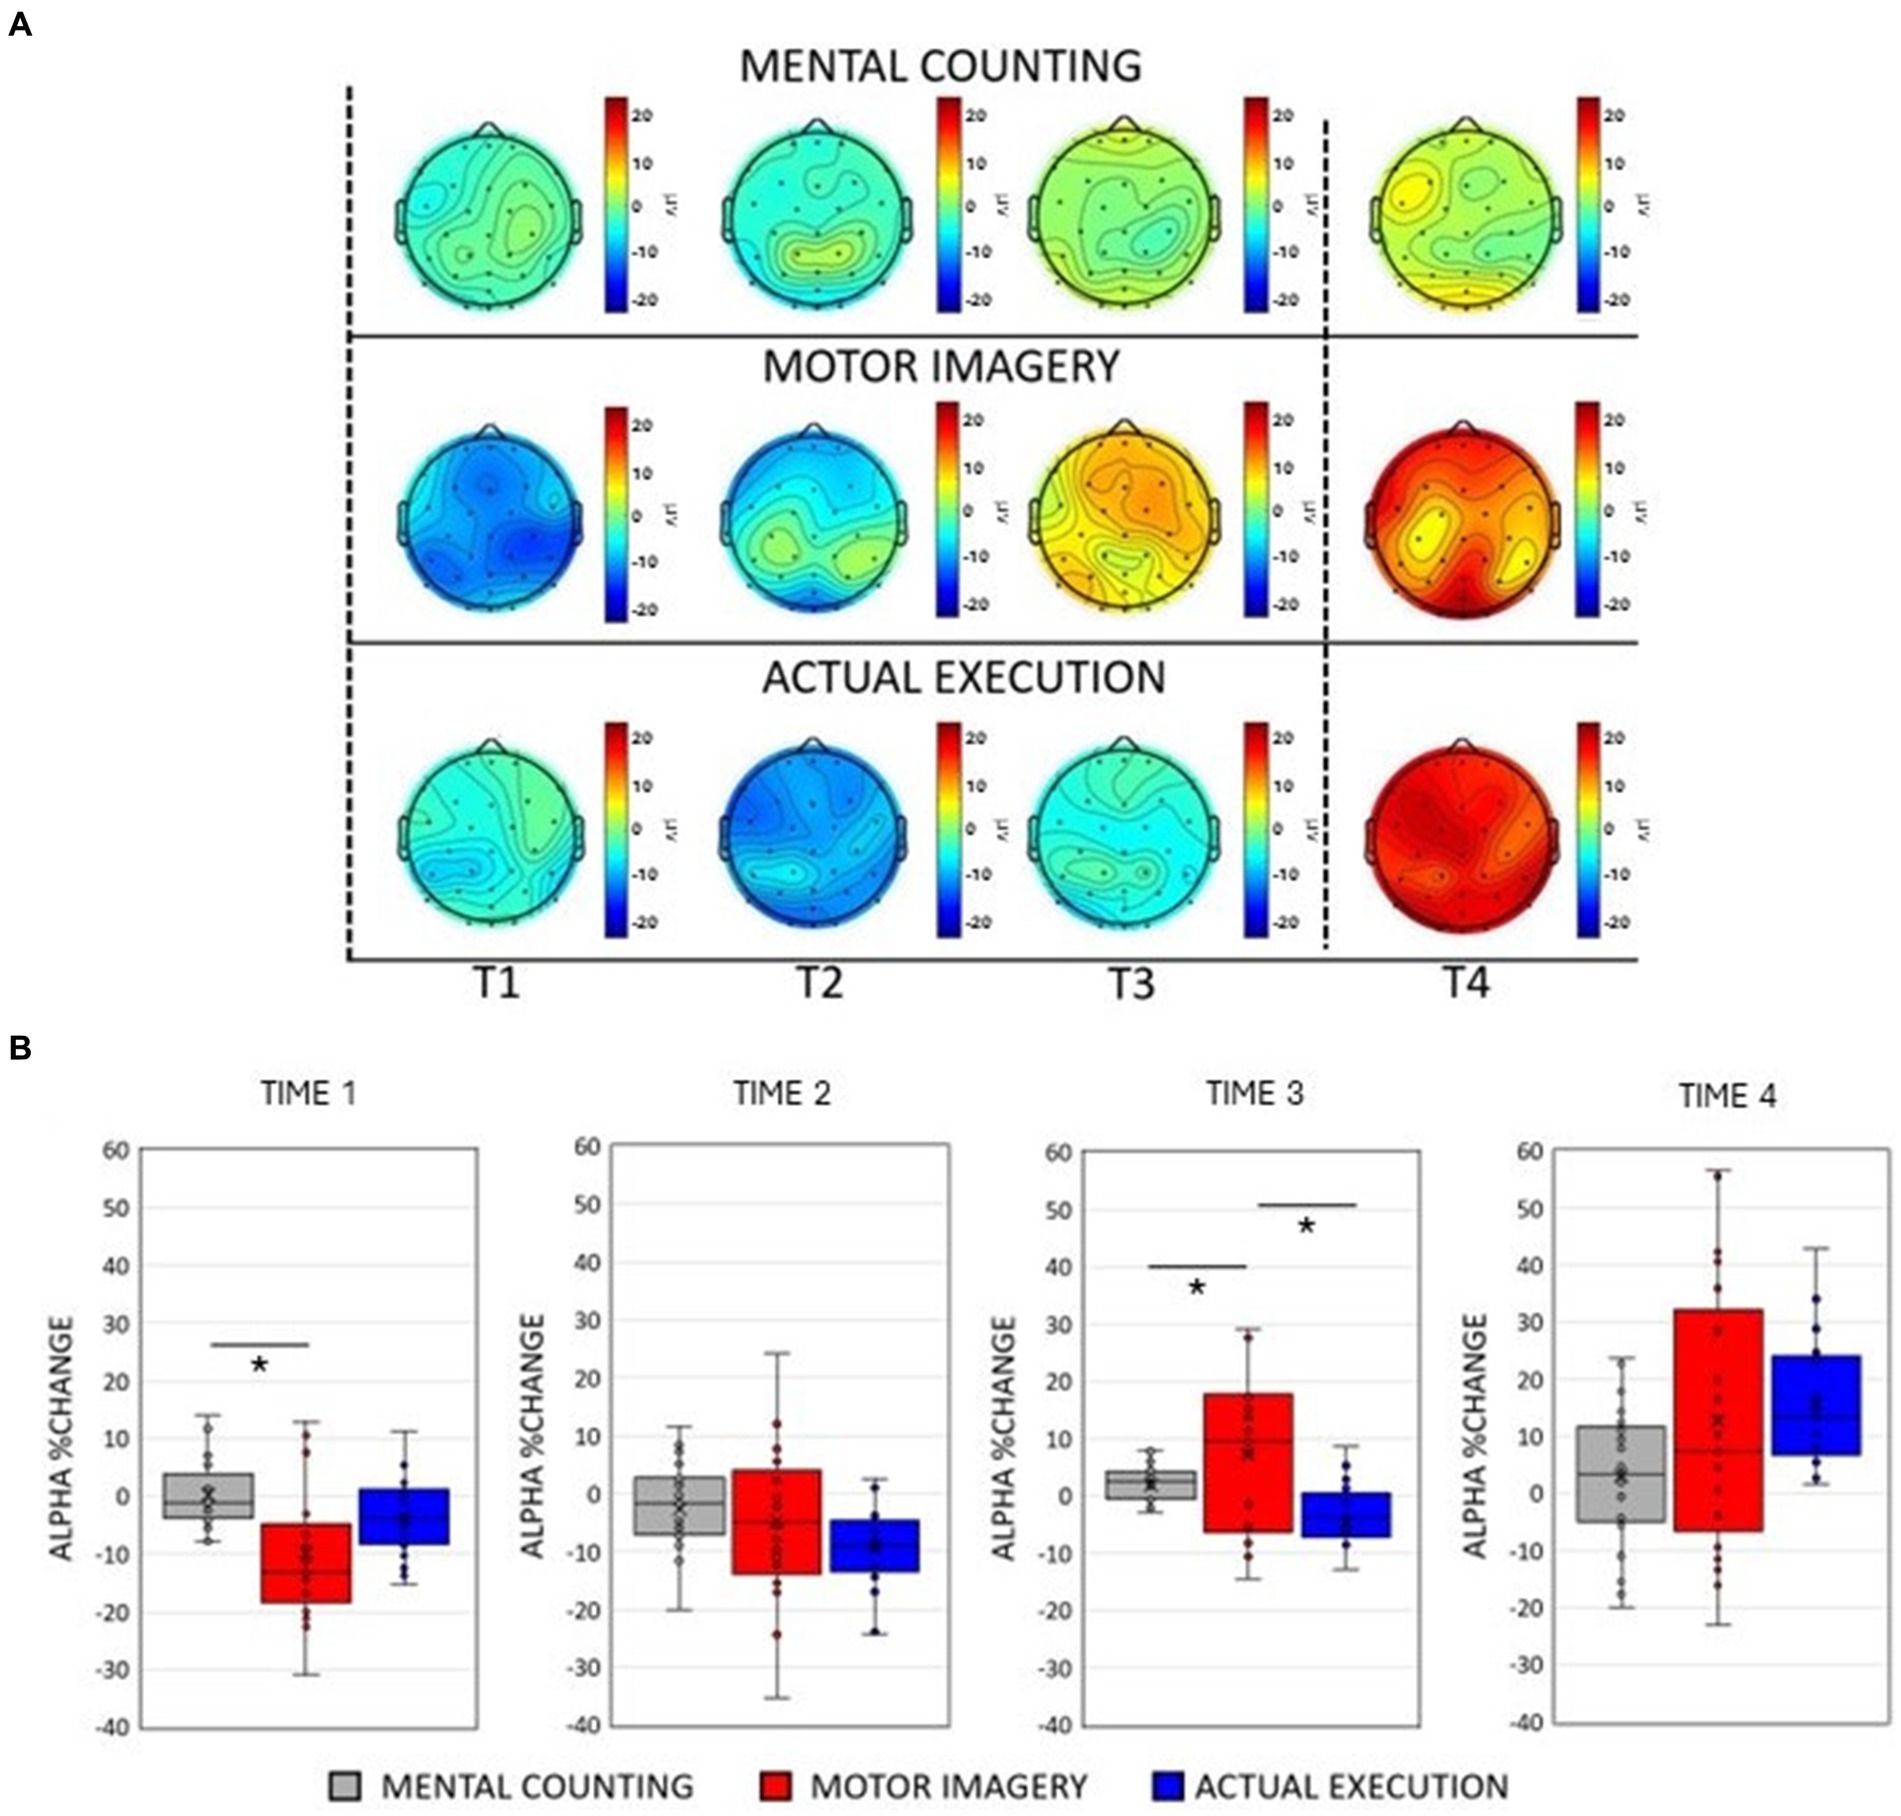
Figure 2. (A) Scalp maps topography of alpha (8–12 Hz) spectral power across conditions and time. Dashed black lines represent the start and the end of the trial. (B) Averaged alpha percentage change of power relative to baseline pooling the ROIs (central, parietal and occipital) for each condition in each time window. Significant comparisons are flagged with an asterisk.
2.5 Statistical analysisTopographic scalp maps (Figures 1, 2A) showed prominent changes in the spectral power in the alpha and beta frequency bands across conditions. To compare power spectral changes across conditions, we first divided the time warped epochs (from the start of the trial until the end) for each condition into three time windows (corresponding to the 33.3% of each epoch). To further examine power spectral changes occurring at the end of the trial, an additional time window of the same proportion was added for each condition after time 0, resulting in 4 time windows. Two separate repeated measures 3 × 4 × 3 ANOVAs with factors of Condition [Mental counting (MC); Execution (EXE); Motor Imagery (MI)], Time (Time 1, Time 2, Time 3, Time 4) and ROIs (central, parietal, occipital) were performed for alpha and beta frequency bands. The Greenhouse—Geisser correction was applied whenever the sphericity assumption was violated and post-hoc paired sample t-tests (adjusted using Bonferroni correction) were performed to further investigate significant main effects and interactions.
3 Results 3.1 Beta oscillationsThe ANOVA revealed a main effect of Condition [F(2, 20) = 33.559, p <0.001, η p2 = 0.591] showing an overall smaller amplitude in the beta frequency band during execution compared to mental counting [t(20) = 3.987, p < 0.001] and motor imagery [t(20) = 8.192, p < 0.001] and an overall larger amplitude of beta in motor imagery compared to mental counting [t(20) = 4.204, p < 0.001]. A main effect of Time [F(1, 20) = 39.841, p < 0.001, η p2 = 0.344] revealed that there was a decrease of beta power relative to the baseline in Time 1 and 2, whereas there was an increase of beta power in Time 3 and 4.
As shown in Figures 1A,B, there was an initial beta power decrease during motor imagery and execution, which was evidently different to the modulation of beta power during mental counting. A significant 2-way interaction between Condition and Time [F(2, 20) = 8.877, p < 0.001, η p2 = 0.287, see Figure 1B], further investigated with post-hoc paired t-tests, confirmed that the decrease in beta power was significantly stronger during the motor imagery compared to mental counting in Time 1 [t(20) = 2.634, p = 0.048] and Time 2 [t(20) = 4.679, p < 0.001] but no difference between motor imagery and execution in Time 1 and 2 (p > 0.05). In addition, the increase in beta power in Time 4 was significantly stronger during motor imagery compared to mental counting [t(20) = 3.236, p = 0.002]. With regard to the comparison between motor imagery and execution, there was only a significant difference in Time 3 [t(20) = 4.262, p < 0.001], due to the earlier appearance of the increase in power in motor imagery.
Although not related to condition, a significant 2-way interaction between ROI and Time [F(2, 20) = 11.019, p < 0.001, η p2 = 0.015] indicated a different modulation across brain areas during the tasks. Post-hoc paired sample t-tests showed that the beta power decrease was stronger in the central ROI compared to the occipital ROI in Time 2 [t(20) = 3.828, p = 0.012] and Time 3 [t(20) = 3.846, p = 0.010]. In addition, there was a stronger decrease of beta power in the parietal ROI compared to the occipital ROI in Time 2 [t(20) = 5.481, p < 0.001] and a stronger decrease in Time 3 [t(20) = 5.749, p < 0.001].
There was a significant interaction between Condition and ROI [F(2, 20) = 3.749, p = 0.031, η p2 = 0.153]. Post-hoc paired t-tests revealed larger amplitudes of beta power in motor imagery compared to execution in the central [t(20) = 6.631, p < 0.001], parietal [t(20) = 5.857, p = 0.028] and occipital [t(20) = 8.452, p < 0.001] ROIs. Similarly, beta power amplitude was larger in motor imagery compared to mental counting over central [t(20) = 3.977, p = 0.003], parietal [t(20) = 3.250, p = 0.028] and occipital areas [t(20) = 3.520, p = 0.013].
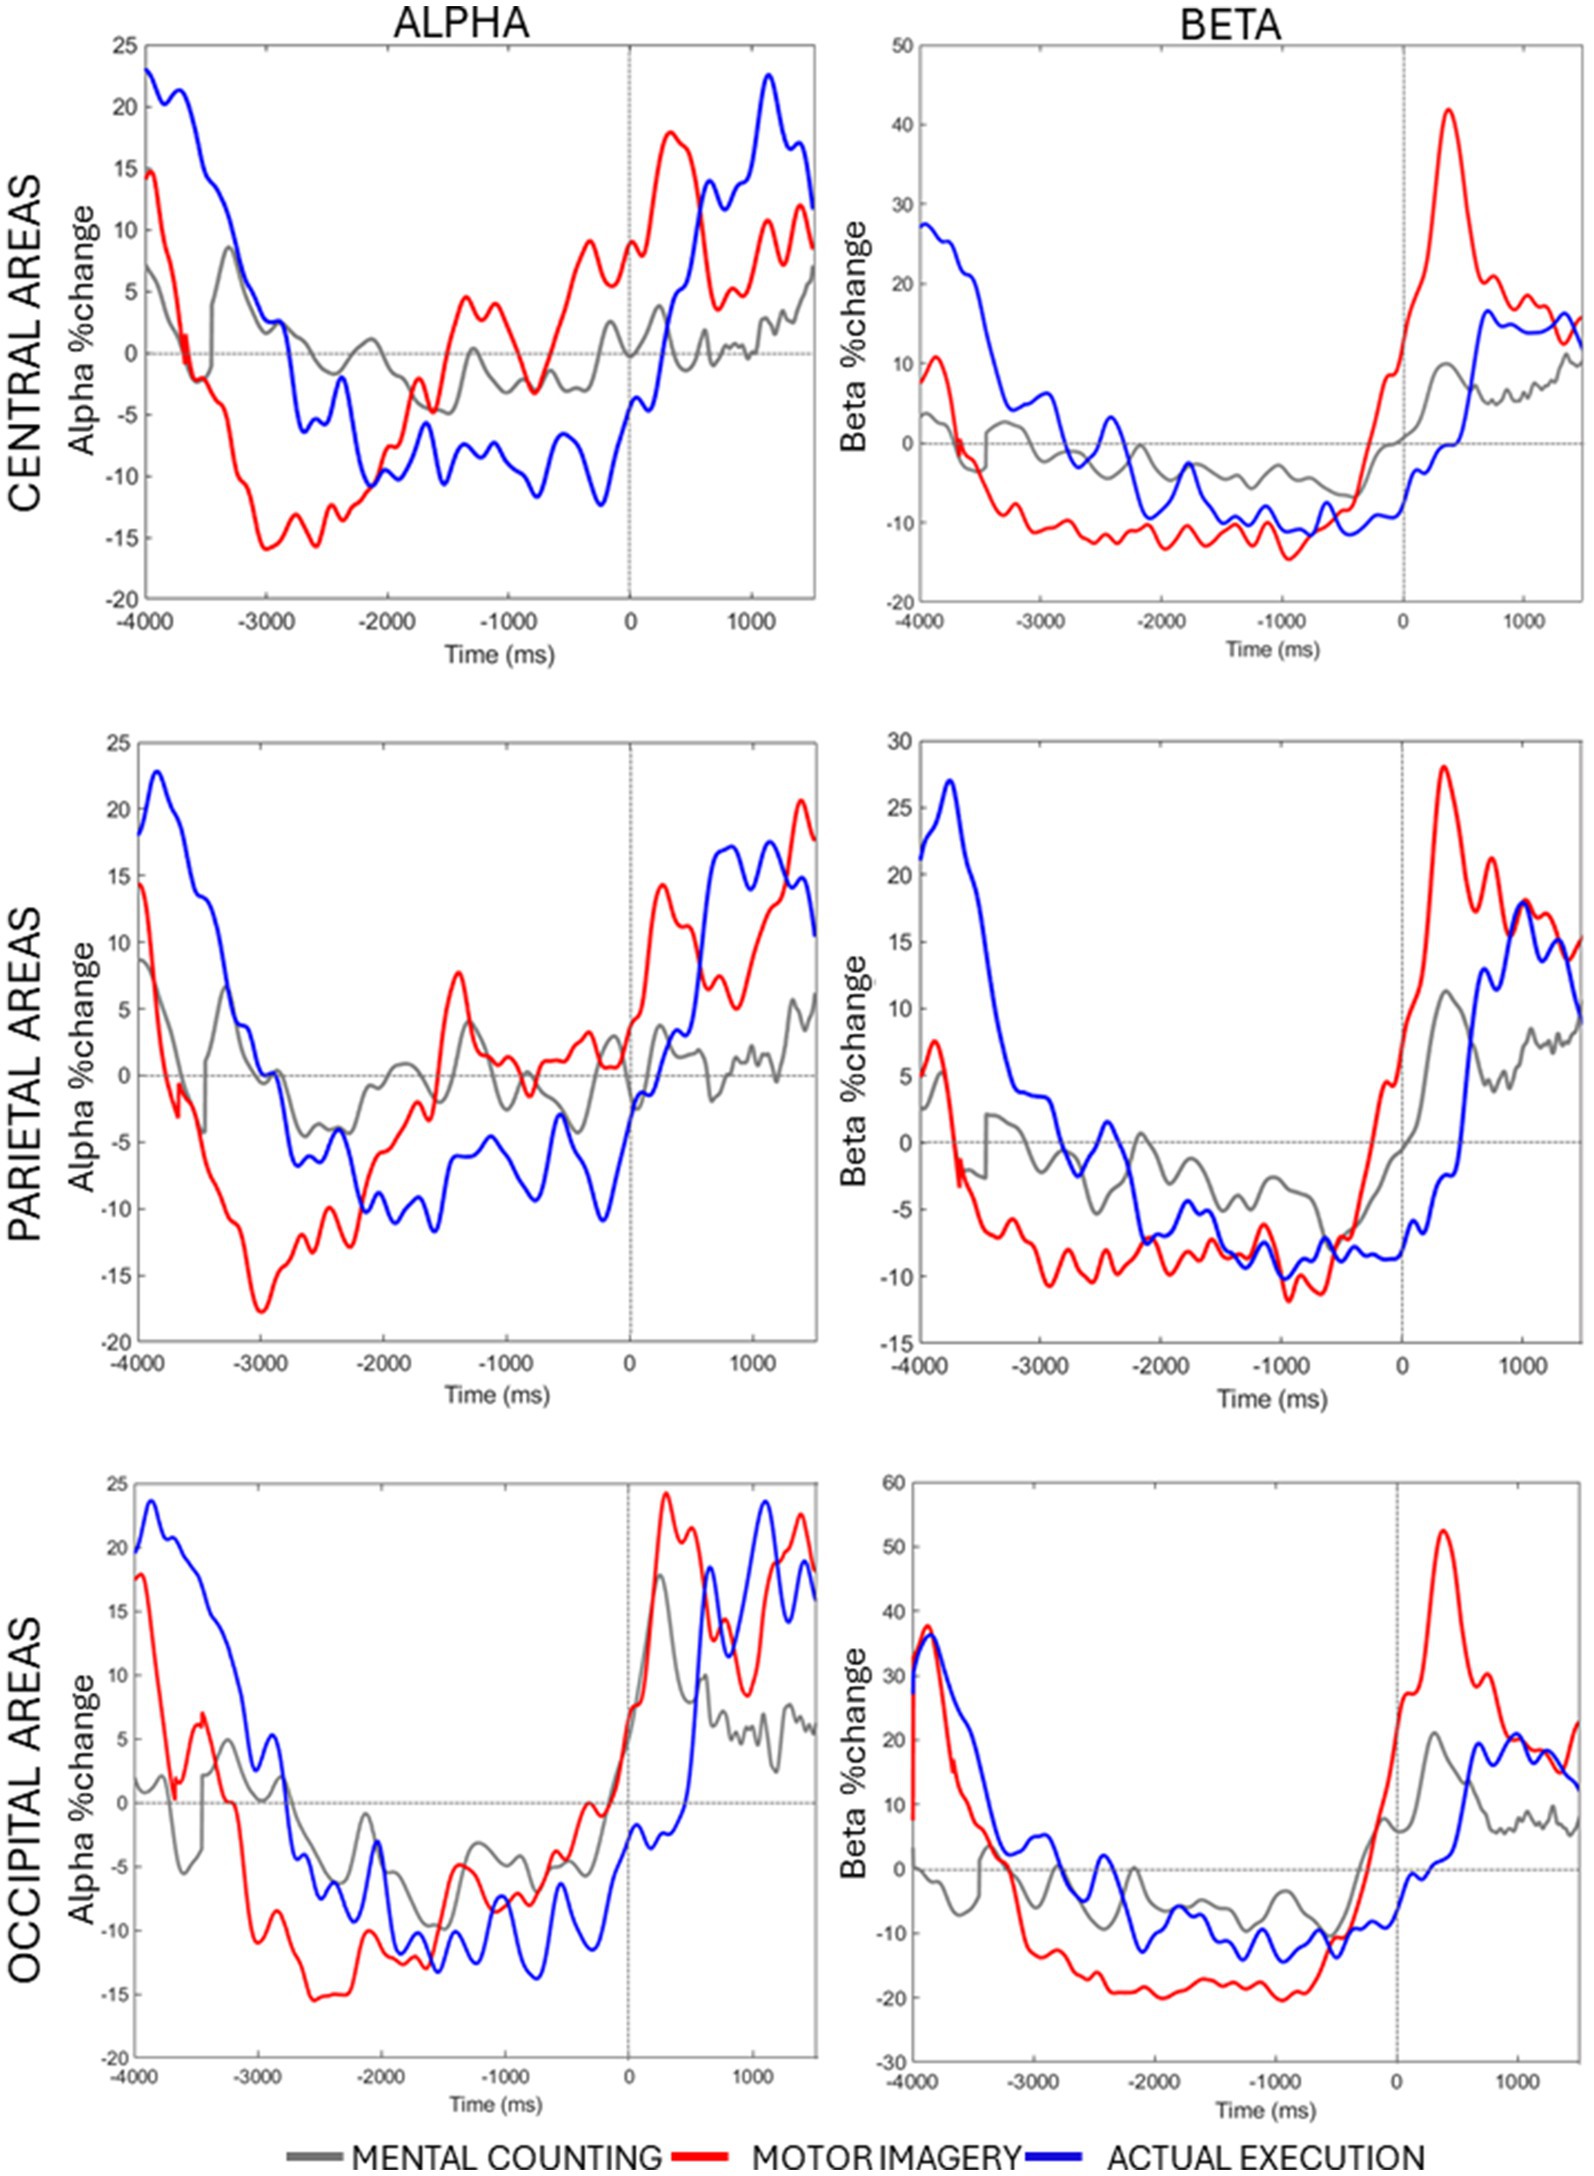
Lastly, a significant 3-way interaction [F(2, 20) = 2.990, p = 0.033, η p2 = 0.130] was investigated for each ROI separately. Figure 3 (right panels) shows beta power modulation across conditions and time in each ROI. In the central ROI, there was a stronger decrease of beta power in motor imagery compared to mental counting in Time 1 [t(20) = 5.965, p < 0.001] and Time 2 [t(20) = 4.858, p < 0.001]. In Time 3 and 4, the beta power increased in relation to the baseline in motor imagery compared both to mental counting [t(20) = 3.774, p = 0.016] and execution [t(20) = 5.897, p < 0.001]. In the parietal ROI, the beta power increased in relation to the baseline in Time 3 in motor imagery, whereas there was still a beta decrease in execution; this difference was significant [t(20) = 5.209, p < 0.001]. In the occipital ROI, there was a stronger decrease of beta power in Time 2 in motor imagery compared to mental counting [t(20) = 3.473, p = 0.026], whereas there was a stronger increase of beta power in Time 4 in motor imagery compared to mental counting [t(20) = 3.938, p = 0.009]. In addition, in Time 3, the beta power increased relative to the baseline for motor imagery, but decreased for execution, showing a statistically significant difference [t(20) = 5.493, p < 0.001].
Figure 3. Averaged alpha and beta percentage change of power from baseline across conditions and time in each ROI.
3.2 Alpha oscillationsThe ANOVA revealed a main effect of Condition [F(2, 20) = 9.917, p < 0.001, η p2 = 0.002]. Post-hoc paired sample t-tests showed an overall smaller amplitude during execution compared to mental counting [t(20) = 2.595, p = 0.026] and motor imagery [t(20) = 4.432, p < 0.001], but no differences between MI and MC (p > 0.05). A main effect of Time [F(2, 20) = 15.896, p < 0.001, η p2 = 0.188] revealed that there was a decrease of alpha power in Time 1 and 2, whereas there was an increase of alpha power in Time 3 and 4.
As illustrated in Figures 2A,B, the modulation of alpha power was similar to the modulation of beta power only in the execution condition. There was practically no modulation in mental counting, whereas there was a sharp and relatively short-lived power decrease at the early stages of motor imagery. This was confirmed by a significant 2-way interaction between Condition and Time [F(2, 20) = 9.917, p < 0.001, η p2 = 0.002, see Figure 2B]. Post-hoc paired t-tests showed that there was a greater alpha power decrease in motor imagery compared to mental counting in Time 1 [t(20) = 3.53, p = 0.024], and a greater alpha power increase in motor imagery compared to mental counting in Time 3 [t(20) = 2.910, p = 0.036]. In addition, in Time 3, the alpha power increased in relation to the baseline in motor imagery, whereas there was still an alpha decrease in execution; this difference was statistically significant [t(20) = 3.414, p = 0.039].
A significant interaction between ROI and Time [F(2, 20) = 11.019, p < 0.001, η p2 = 0.016] revealed a stronger decrease of alpha power in the occipital ROI compared to the central [t(20) = 4.633, p < 0.001] and parietal [t(20) = 6.227, p < 0.001] ROIs in Time 2. In Time 4, a stronger increase of alpha power occurred over the occipital compared to the central [t(20) = 5.751, p < 0.001] and the parietal [t(20) = 4.893, p = 0.023] ROIs.
There was a significant interaction between Condition and ROI [F(2, 20) = 7.160, p < 0.001, η p2 = 0.583]. The amplitude of alpha power was larger in motor imagery compared to execution in the parietal [t(20) = 4.991, p < 0.001] and occipital [t(20) = 5.857, p < 0.001] ROIs.
A significant 3-way interaction [F(2, 20) = 2.881, p = 0.020, η p2 = 0.010] was further investigated in each ROI (see Figure 3, left panels). In the central ROI, there was a stronger decrease of alpha power in motor imagery compared to mental counting in Time 1 [t(20) = 3.693, p = 0.017]. In Time 3, the alpha power increased relative to baseline in motor imagery, but decreased in execution, showing a statistically significant difference [t(20) = 4.016, p = 0.005]. Similarly, in the parietal ROI, there was a stronger decrease of alpha power in motor imagery compared to mental counting in Time 1 [t(20) = 4.000, p = 0.012] and a stronger increase of alpha power in Time 4 [t(20) =2.818, p = 0.036]. In addition, in Time 3, the alpha power increased relative to baseline in motor imagery, and decreased for execution, although the difference was not statistically significant (p > 0.05). In the occipital ROI, there was a stronger increase of alpha power in Time 4 in motor imagery compared to mental counting [t(20) = 3.966, p = 0.007]. In addition, in Time 3, while the alpha power increased relative to baseline in motor imagery, and decreased in execution, there was no statistically significant difference (p > 0.05).
4 DiscussionThe present study aimed to examine overlap and differences between the oscillatory brain activity related to motor imagery and actual execution of walking. The results showed a general match between the modulation of beta power regardless of whether participants were performing the actual execution of walking or the motor imagery of walking, whereas an equivalent correspondence did not emerge when participants were performing the control task of mental counting. Interestingly, the analysis also revealed clear evidence of differences between action execution and motor imagery. Specifically, a distinct pattern of beta activity was present during motor imagery, which was associated with a larger amplitude of beta power over central, parietal and occipital brain regions during motor imagery compared to actual walking. We also found that oscillatory activity in the alpha frequency band was characterized by a stronger power decrease at the beginning of the motor imagery task compared to during the actual execution and mental counting conditions. Therefore, the data suggests motor imagery and execution of naturalistic walking involve shared motor-cognitive activations, as shown by similar modulations in the alpha and beta frequency bands during motor imagery and action execution of walking, but that motor imagery requires additional cortical resources, indicated by the distinct pattern of more distributed brain activity involved during motor imagery compared to the other experimental conditions.
Consistent with the functional equivalence hypothesis (following motor simulation theory, cf. Jeannerod, 1994, 2001), our results demonstrated that motor imagery and actual execution of walking induced similar beta power decrease–increase dynamics, contrasting with the results observed during mental counting, suggesting that participants did not just count the steps mentally in the motor imagery condition. The decrease of beta oscillations during motor imagery signals the recruitment of neural circuits supporting the activation of motor-related information underlying the action representation of walking, which resembles typical cognitive mechanisms occurring during the preparation of overt motor responses (see Jeannerod, 2001; Glover and Baran, 2017). The role of decreased beta over the sensorimotor network has been defined as a mechanism that recruits neural processes to generate a motor output (Rhodes et al., 2018).
As such, we see neural overlap between the motor imagery of walking and actual walking in this motor-related beta decrease over the sensorimotor network. Beta power decrease has been previously reported during the kinaesthetic imagery of movement of body parts (i.e., hand, foot and tongue motor imagery) (Pfurtscheller and Neuper, 1997; Neuper et al., 2006; Pfurtscheller et al., 2006) and for motor imagery of skilled movements over sensorimotor areas (Pfurtscheller et al., 2002; Nakagawa et al., 2011; Di Nota et al., 2017). Furthermore, similar beta power decreases have been reported during motor imagery of simple and complex walking tasks (Putzolu et al., 2022), albeit with no comparison to execution of walking, and no inclusion of a control task, which lead to uncertainty about what was being measured. The neural overlap we see in the present study between the motor imagery of walking and actual walking evident in a motor-related beta decrease provides direct evidence for functional equivalence.
Further overlap in the beta oscillations in this study signaling functional equivalence is evident in a motor-related increase of power in the beta frequency band toward the end of the movement, both when imagining and executing walking. These power increases in the beta frequency band, also known as beta “rebound,” are typically observed over premotor and sensorimotor areas in the post movement phase (Pfurtscheller et al., 2005; Jurkiewicz et al., 2006; Pfurtscheller and Solis-Escalante, 2009). The beta rebound has been related to a resetting mechanism, reflecting processing that occurs at the end of a movement (Kilavik et al., 2013), and indicates the recruitment of neural circuits related to the reset (Engel and Fries, 2010), or similarly to inhibition (Salmelin et al., 1995), which is thought to be automatically recruited in motor imagery (Angelini et al., 2015). As a finding, it is remarkable that imagery of whole-body movement, that does not involve actual movement, generates this motor-related beta-rebound. That said, we also discuss differences related to the beta-rebound below.
The methodology and design of the current study, which allows for direct comparison between imagery and execution of whole-body movements, as well as having strong temporal resolution not only revealed overlap as presented above, but also motor-cognitive differences. As shown by our analysis, the beta power decrease seen in motor imagery task was shorter compared to actual execution of walking. However, as shown by the analysis, motor imagery required a larger recruitment of neural activation compared to the execution of walking, reflecting a greater effort when beginning to imagine the action without an actual overt motor output. Furthermore, the greater power decrease in the beta band observed in the initial phases of motor imagery compared to actual walking was evident over a broad area, including central, parietal and occipital cortical recording sites, suggesting the recruitment of brain regions included in the sensorimotor network (Solodkin et al., 2004).
Recent meta-analyses have revealed that motor imagery involves a greater range of brain areas which are not activated during actual execution (Hétu et al., 2013; Hardwick et al., 2018). This broader neural network, that includes motor brain areas, encompasses parietal and occipital regions, which are known to play a key role in motor planning and in the processing of visuo-spatial information during spatial navigation (Andersen, 1997; Ino et al., 2002; Cui and Andersen, 2007; Julian et al., 2016). According to recent accounts, a function of motor imagery is to promote action predictions supporting the processing of motor and sensory information in order to guide behavior (Bubic et al., 2010; Ridderinkhof and Brass, 2015; O’Shea and Moran, 2017). Consistent with these findings, our results showed a larger parietal and occipital activation when participants imagined themselves walking, compared to when they actually walked and when they simply mentally counted. These results indicate that the imagery condition required the active maintenance of action simulation as well as a dynamic integration of visual and kinaesthetic sensory information associated with the motor imagery of one’s body moving in the environment (Krüger et al., 2020, 2022). Taken together, therefore, current findings suggest that motor imagery involves cognitive mechanisms that go beyond the mere encoding of motor information and point toward the multisensory nature of motor imagery (Dahm, 2020; Kraeutner et al., 2020; Krüger et al., 2022; Frank et al., 2023).
Differences in the temporal dynamics were also evident at the end of the movement. The results showed an increase of power in the beta frequency band toward the end of the walking movement in all three tasks, but with an overall stronger effect in the motor imagery condition. The beta power increase was apparent at different times across the three experimental conditions, with two peaks occurring during the last two time intervals in the motor imagery condition. From a temporal perspective, it was notable that the first of these peaks coincided with the beta peak in the mental counting condition, whereas the second peak coincided with the beta peak in the actual execution condition. Therefore, the beta-rebound appears to occur twice in the motor imagery condition, but for different reasons. The first “early” increase of beta power might indicate the end of the mental counting of the steps as part of imagery, whereas the second “delayed” increase of beta power appears to be related to the reset of the motor representation, occurring at the same time as the end of walking execution. Notably, it is the neural overlap in the motor-related beta-rebound between motor imagery and actual execution of whole-body walking movements here that is most remarkable.
These data also indicated a different alpha power modulation between the three experimental conditions. It is well known that during movement preparation and execution, a power decrease in the alpha and beta frequency bands occurs over sensorimotor areas (Pfurtscheller and Berghold, 1989; Leocani et al., 2001; Kaiser et al., 2003). In the present study, we found a sustained alpha decrease during actual execution, consistent with previous findings of walking (Gwin et al., 2011; Bulea et al., 2015; Bradford et al., 2016). Similar to our findings in the beta band, the results showed a prominent alpha power decrease in the motor imagery condition, but only at the beginning of the imagined walking, whereas there was no evidence of a modulation during the mental counting condition. Previous literature has suggested that such decreases in alpha power reflect the allocation of attention toward relevant task-related information, such as visual information (Foxe and Snyder, 2011; Brinkman et al., 2014) and furthermore, providing an index of cortical activation, in contrast to alpha increase of power which reflects cortical inhibition (the “idling” state, Pfurtscheller et al., 1996). From this perspective, the strong alpha decrease seen at the beginning of motor imagery could indicate either the initial allocation of attention toward relevant features of the action being simulated or to the active processing of motor and sensory information (Foxe and Snyder, 2011; Brinkman et al., 2014). Alpha suppression has been observed during motor imagery and movement observation (Pfurtscheller and Da Silva, 1999; Jurkiewicz et al., 2006; de Lange et al., 2008), and also specifically during motor imagery of simple and complex gait (Putzolu et al., 2022). The temporal specificity of the neural activity during motor imagery, and the contrast with actual execution of whole-body movements in this study, signals that motor imagery requires the allocation of attention, enabling active processing of motor and sensory information in order to simulate action.
Overall, the present results indicate that motor imagery and actual execution of whole-body walking movement share common neural features, as predicted by the functional equivalence hypothesis. Shared features occur during the early stages of walking action execution and motor imagery, likely reflecting the initiation of an action plan (Jeannerod, 1994, 2001; Decety, 1996). Overlap was also evident in the beta-rebound at the end of the action, suggesting motor imagery and execution of whole-body movements involve similar resetting or inhibition of motor processes (Engel and Fries, 2010). These similar mechanisms are reflected in beta and alpha power modulation during motor imagery, which resemble action execution patterns. The motor-cognitive processes of whole-body motor imagery was furthermore revealed through the differences between motor imagery and the actual execution of walking in this study. The data indicate that motor imagery elicits a wider range of brain activity, especially at the beginning of the task, compared to execution. The broader pattern of neural activation indicates that the cognitive mechanisms of motor imagery go beyond the mere encoding of motor-related information, and that motor imagery places greater cognitive demands than execution presumably due to the requirement to initiate and sustain a deliberate mental simulation of action. This is relevant information, for example when considering that stroke patients do not necessarily benefit from motor imagery as part of their neuro-rehabilitation (Ietswaart et al., 2011).
This is the first report of brain activity recorded during naturalistic full-body movement contrasted with the imagery of walking. Using the same imaging methods in both conditions, direct comparison between the neural correlates of execution and motor imagery of walking could be made. Furthermore, an upright body position was maintained during imagery to match the posture of actual walking. These design features were not present in the one other neuroimaging study (La Fougere et al., 2010) comparing imagery and execution of walking. EEG recordings furthermore allowed for the characterization of the temporal aspects of brain dynamics, to disentangle the cognitive processes occurring during motor imagery and action execution at different time points. As such, this is the first study that showed directly that motor imagery and execution of naturalistic walking involves shared motor-cognitive activations, and that motor imagery requires additional cortical resources.
Data availability statementThe data supporting the findings of this study are available at https://osf.io/rth4c/?view_only=bea46044373d43dd95fde4bb6fa78b08.
Ethics statementThe studies involving humans were approved by the Ethics Committee of University of Stirling. The studies were conducted in accordance with the local legislation and institutional requirements. The participants provided their written informed consent to participate in this study.
Author contributionsMM: Conceptualization, Data curation, Formal analysis, Investigation, Methodology, Project administration, Validation, Writing – original draft, Writing – review & editing. DK: Conceptualization, Data curation, Formal analysis, Methodology, Supervision, Validation, Writing – original draft, Writing – review & editing. ME: Conceptualization, Data curation, Methodology, Supervision, Validation, Writing – original draft, Writing – review & editing. DD: Conceptualization, Data curation, Methodology, Supervision, Validation, Writing – original draft, Writing – review & editing. MI: Conceptualization, Data curation, Funding acquisition, Investigation, Methodology, Resources, Supervision, Validation, Writing – original draft, Writing – review & editing.
FundingThe author(s) declare that financial support was received for the research, authorship, and/or publication of this article. This work was supported by a scholarship from the University of Stirling and a research grant from SINAPSE (Scottish Imaging Network: A Platform for Scientific excellence).
AcknowledgmentsWe would like to thank technicians Chris Grigson, Stephen Stewart and Catriona Bruce for their help with the experimental setup and recordings.
Conflict of interestThe authors declare that the research was conducted in the absence of any commercial or financial relationships that could be construed as a potential conflict of interest.
The reviewer KW is currently organizing a Research Topic with the author MI.
The author(s) declared that they were an editorial board member of Frontiers, at the time of submission. This had no impact on the peer review process and the final decision.
Publisher’s noteAll claims expressed in this article are solely those of the authors and do not necessarily represent those of their affiliated organizations, or those of the publisher, the editors and the reviewers. Any product that may be evaluated in this article, or claim that may be made by its manufacturer, is not guaranteed or endorsed by the publisher.
ReferencesAndersen, R. A. (1997). Multimodal integration for the representation of space in the posterior parietal cortex. Philos. Trans. R. Soc. Lond. B Biol. Sci. 352, 1421–1428. doi: 10.1098/rstb.1997.0128
PubMed Abstract | Crossref Full Text | Google Scholar
Angelini, M., Calbi, M., Ferrari, A., Sbriscia-Fioretti, B., Franca, M., Gallese, V., et al. (2015). Motor inhibition during overt and covert actions: an electrical neuroimaging study. PloS one, 10, e0126800.
Bakker, M., De Lange, F. P., Stevens, J. A., Toni, I., and Bloem, B. R. (2007). Motor imagery of gait: a quantitative approach. Exp. Brain Res. 179, 497–504. doi: 10.1007/s00221-006-0807-x
Crossref Full Text | Google Scholar
Barton, J., and Pretty, J. (2010). What is the best dose of nature and green exercise for improving mental health? A multi-study analysis. Environ. Sci. Technol. 44, 3947–3955. doi: 10.1021/es903183r
Crossref Full Text | Google Scholar
Bradford, J. C., Lukos, J. R., and Ferris, D. P. (2016). Electrocortical activity distinguishes between uphill and level walking in humans. J. Neurophysiol. 115, 958–966. doi: 10.1152/jn.00089.2015
PubMed Abstract | Crossref Full Text | Google Scholar
Brinkman, L., Stolk, A., Dijkerman, H. C., de Lange, F. P., and Toni, I. (2014). Distinct roles for alpha-and beta-band oscillations during mental simulation of goal-directed actions. J. Neurosci. 34, 14783–14792. doi: 10.1523/JNEUROSCI.2039-14.2014
PubMed Abstract | Crossref Full Text | Google Scholar
Bubic, A., Von Cramon, D. Y., and Schubotz, R. I. (2010). Prediction, cognition and the brain. Front. Hum. Neurosci. 4:1094. doi: 10.3389/fnhum.2010.00025
Crossref Full Text | Google Scholar
Bulea, T. C., Kim, J., Damiano, D. L., Stanley, C. J., and Park, H. S. (2015). Prefrontal, posterior parietal and sensorimotor network activity underlying speed control during walking. Front. Hum. Neurosci. 9:247. doi: 10.3389/fnhum.2015.00247
Crossref Full Text | Google Scholar
Cassim, F., Szurhaj, W., Sediri, H., Devos, D., Bourriez, J. L., Poirot, I., et al. (2000). Brief and sustained movements: differences in event-related (de) synchronization (ERD/ERS) patterns. Clin. Neurophysiol. 111, 2032–2039. doi: 10.1016/S1388-2457(00)00455-7
Crossref Full Text | Google Scholar
Choi, K., and Cichocki, A. (2008). “Control of a wheelchair by motor imagery in real time” in Intelligent data engineering and automated learning–IDEAL 2008: 9th international conference Daejeon, South Korea, November 2–5, 2008 proceedings 9 (Berlin Heidelberg: Springer), 330–337.
Cochrane Stroke GroupBarclay, R. E., Stevenson, T. J., Poluha, W., Semenko, B., and Schubert, J. (2020). Mental practice for treating upper extremity deficits in individuals with hemiparesis after stroke. Cochrane Database Syst. Rev. 2020:CD005950. doi: 10.1002/14651858.CD005950.pub5
PubMed Abstract | Crossref Full Text | Google Scholar
Conson, M., Mazzarella, E., and Trojano, L. (2011). Self-touch affects motor imagery: a study on posture interference effect. Exp. Brain Res. 215, 115–122. doi: 10.1007/s00221-011-2877-7
Crossref Full Text | Google Scholar
Cui, H., and Andersen, R. A. (2007). Posterior parietal cortex encodes autonomously selected motor plans. Neuron 56, 552–559. doi: 10.1016/j.neuron.2007.09.031
Crossref Full Text | Google Scholar
Daeglau, M., Wallhoff, F., Debener, S., Condro, I. S., Kranczioch, C., and Zich, C. (2020). Challenge accepted? Individual performance gains for motor imagery practice with humanoid robotic EEG neurofeedback. Sensors 20:1620. doi: 10.3390/s20061620
PubMed Abstract | Crossref Full Text | Google Scholar
Dahm, S. F. (2020). On the assessment of motor imagery ability: a research commentary. Imagin. Cogn. Pers. 39, 397–408. doi: 10.1177/0276236619836091
Crossref Full Text | Google Scholar
de Lange, F. P., Helmich, R. C., and Toni, I. (2006). Posture influences motor imagery: an fMRI study. Neuroimage 33:609. doi: 10.1016/j.neuroimage.2006.07.017
Crossref Full Text | Google Scholar
de Lange, F. P., Jensen, O., Bauer, M., and Toni, I. (2008). Interactions between posterior gamma and frontal alpha/beta oscillations during imagined actions. Front. Hum. Neurosci. 2:269. doi: 10.3389/neuro.09.007.2008
留言 (0)