
記住我


The World Health Organization defines occupational burnout as a syndrome involving feelings of lack of energy or exhaustion, mental detachment from one’s work, and decreased professional efficiency resulting from chronic workplace stress that has been inadequately managed (1). A recent Delphi consensus statement also highlights burnout as an occupational phenomenon: “In a worker, occupational burnout or occupational physical and Emotional Exhaustion state is an exhaustion due to prolonged exposure to work-related problems” (2). As a professional group, physicians have about twice the risk of burnout as the general workforce (3,4). In a systematic review of 182 studies comprising 109,628 practicing physicians across 45 countries, the prevalence of symptoms of clinical burnout was about 50% (4). Although 86% of the included studies used some form of the Maslach Burnout Inventory, burnout prevalence estimates and definitions showed substantial variation between studies (4).
Regardless of a need to harmonize its definition (2), burnout has prospectively been associated with adverse mental and physical health outcomes, including traditional cardiovascular risk factors and coronary heart disease (5). As an example, a study in 8838 seemingly healthy employees found burnout levels at baseline to be positively associated with a higher risk of developing coronary heart disease during a 3.4-year follow-up. This relationship remained significant after accounting for demographic characteristics, cardiovascular risk factors, job stress, and depression (6). Likewise, in a sample of health professionals, including physicians, higher Emotional Exhaustion and lower Personal Accomplishment, both subscales of the Maslach Burnout Inventory, were associated with a higher composite score of modifiable cardiovascular risk factors (7).
One mechanism that might link burnout with coronary heart disease risk is poor subjective sleep quality, which has been associated with both an increased risk of incident coronary heart disease (8,9) and Maslach Burnout Inventory subscales (i.e., higher Emotional Exhaustion, higher Depersonalization, and lower Personal Accomplishment) (10). Sleep disturbance may be a causative mechanism leading to burnout in physicians (11). Reasons for poor sleep quality among physicians include disrupted sleep patterns, fragmented sleep, sleep deprivation, and inadequate recovery sleep due to night shifts, on-call duties, and long work hours (12). In a study with 240 primary care physicians, 19% met the criteria for insomnia diagnoses, with those in the high-burnout group having significantly poorer global sleep quality than those in the low-burnout group (13). In a survey of 1047 physicians from various specialties, 29% had at least one sleep disorder, with burnout risk nearly four times higher than among physicians without sleep disorders (14). Despite this literature, there is a lack of information about potential effects of sleep disturbance on coronary heart disease risk in physician burnout. Male physicians with burnout may be particularly vulnerable to the negative cardiovascular effects of poor sleep, as they seem to be at higher risk of coronary heart disease and major adverse cardiovascular events compared with their female counterparts (15,16).
The aim of this study was to test the hypothesis that poor global sleep quality is associated with impaired coronary microvascular function, including reduced coronary flow reserve (CFR), myocardial blood flow (MBF) response, and hyperemic MBF, in male physicians with clinical burnout compared with controls. The primary outcome was CFR that is a noninvasively assessed index of coronary disease severity, which describes the ratio by which coronary blood flow can be augmented by sympathetic stimuli or microcirculatory vasodilation (17). In a meta-analysis, reduced CFR has prospectively been associated with an increased risk of major adverse cardiovascular events and mortality from all causes (17).
METHODS Study ParticipantsThe study received approval from the local ethics committee of the State of Zurich, Switzerland (BASEC-Nr. 2018-01974), and all participants provided written informed consent. The data underlying this article are not openly available because of reasons of sensitivity and ethical restrictions. Data are located in controlled access data storage at University Hospital Zurich and will be shared on reasonable request to the corresponding author. We conducted a research project in Switzerland between September 2019 and December 2021, involving the recruitment of male physicians. The purpose was to examine how burnout affects cardiovascular health. To reach potential participants, we used various channels such as hospitals, clinics, physician associations, and direct email communication. Interested physicians received information about the study objectives and details through text or flyers and had the option to contact the study management. Our objective was to enroll 60 physicians, divided equally between a clinical burnout group and a healthy control group, with 30 participants in each group. When we planned this study, there were no available data in the literature to conduct a formal power analysis for the necessary sample size to detect a significant group difference in CFR, which was the primary outcome of our study. However, in a prior study conducted at our institution (18), which compared two groups of patients with obstructive sleep apnea, we estimated the necessary sample size to be n = 23 patients in each group to detect a statistically significant difference (p < .050). This estimation was based on the assumption that a minimally clinically important change in adenosine-induced hyperemic MBF between groups is 0.75 (0.85) ml/min/g. We chose this threshold because it represents the standard deviation of hyperemic MBF as assessed by quantitative positron emission tomography in our institution.
Participants underwent a screening process during a telephone interview and were assigned to either the burnout group or the healthy control group based on their responses to the Maslach Burnout Inventory–Human Services Survey (19) and the Patient Health Questionnaire-9 (20). Participants in the burnout group had to experience their first episode of burnout. Additional inclusion and exclusion criteria were considered. To determine the cutoff points for group assignment, we referred to a previous systematic review on physician burnout (4). For the burnout group, we used a cutoff of Emotional Exhaustion ≥27 and/or Depersonalization ≥10 (with a minimum Emotional Exhaustion score ≥20). The control group cutoff points were Emotional Exhaustion <16 and Depersonalization <7. We did not consider the Personal Accomplishment subscale for group assignment, as it develops independently of Emotional Exhaustion and Depersonalization (21). Furthermore, participants in the burnout group were required to have a Patient Health Questionniare-9 score of ≤14, indicating at most moderate depressive symptoms, along with experiencing job-related stress and undue exhaustion for at least 6 months before enrollment (22). Participants in the control group were required to have a Patient Health Questionnaire-9 score of ≤10, indicating at most mild depressive symptoms (20). We aimed to match participants in terms of age within a 5-year range, body mass index within a 5-kg/m2 range, and a family history of early cardiovascular diseases in first-degree relatives (men: <55 years, women: <65 years). Both groups had additional inclusion criteria, which were being a nonsmoker for at least 5 years and age between 28 and 65 years, because physicians in Switzerland generally do not practice medicine before the age of 27 years and the current official retirement age in Switzerland is 65 years for men.
The exclusion criteria for both groups included a history of clinical depression or burnout, known heart disease, familial hypercholesterolemia, diabetes, stage II hypertension, renal insufficiency, and any known active serious disease. In addition, participants were excluded if they had a body mass index ≥35 kg/m2; engaged in chronic risky alcohol consumption of ≥4 standard drinks per day; had an allergy to iodine-containing contrast media; had contraindications for adenosine, β-blockers, or nitrates; were using medication affecting blood biomarkers; or chose to waive information about clinically relevant cardiac imaging findings.
MeasuresThe assessment of MBF and the collection of sleep information, job-related characteristics, and other data used in the analyses for this study were performed on the same day, except for one participant who did not report Maslach Burnout Inventory–Human Services Survey and Patient Health Questionnaire-9 scores on the study day. For this one participant, we used the Maslach Burnout Inventory–Human Services Survey and Patient Health Questionnaire-9 symptom scores collected during the screening interview.
Myocardial Blood FlowThe imaging of participants was performed using a state-of-the-art positron emission tomography scanner (Discovery MI; GE Healthcare, Waukesha, Wisconsin) and 13N-ammonia as a flow tracer at the Department of Nuclear Medicine, University Hospital of Zurich. Pharmacological and sympathetic stressors, namely, adenosine infusion and the cold pressor test, were used. The assessment of MBF occurred during rest, adenosine-induced hyperemia (which primarily reflects endothelium-independent vasodilation) (23), and standardized cold pressor test (which primarily reflects endothelium-dependent vasodilation) (24). The imaging process began with the intravenous administration of a bolus of 13N-ammonia, followed by the acquisition of serial dynamic and static positron emission tomography images for a duration of 20 minutes. Subsequently, adenosine was administered intravenously at a continuous rate of 140 μg/kg/min for 6 minutes, with a second dose of 13N-ammonia injected 3 minutes into the adenosine infusion. Positron emission tomography images were recorded using the same acquisition sequence. After a 10-minute interval, the cold pressor test was performed by immersing the participant’s right foot and lower half of the calf in ice water (4°C) for 2 minutes (25). A third dose of 13N-ammonia was administered after 60 seconds into the cold pressor test, followed by positron emission tomography image acquisition. Throughout the procedure, baseline and continuous measurements of heart rate, blood pressure, and a 12-lead electrocardiogram were recorded. To calculate MBF at rest (adjusted for rate-pressure product), during adenosine stress, and cold pressor test, commercially available software (QPET 2017.7; Cedars-Sinai Medical Center, Los Angeles, California) was used. The global CFR was determined for the entire left ventricle by calculating the ratio of stress to rest absolute MBF. We also assessed the MBF response, representing the difference between stress and rest MBF, which is independent of MBF at rest, and hyperemic MBF, indicating the maximum flow achieved during hyperemia (26).
Global Subjective Sleep QualityThe Pittsburgh Sleep Quality Index (PSQI) was used to evaluate participants’ sleep quality and general sleep disturbances in the previous 4 weeks (27). The PSQI is a widely used 19-item self-report questionnaire that offers a comprehensive and multidimensional approach to capturing various dimensions of sleep. The seven components of the PSQI encompass subjective sleep quality, sleep latency, sleep duration, habitual sleep efficiency, sleep disturbances, use of sleep medication, and daytime dysfunction. Depending on the specific component, the evaluation uses Likert scale ratings, numerical values, or categorical responses. The scores from each component range from 0 to 3 and are then combined to derive a global PSQI score (range, 0–21), which provides an overall assessment of sleep quality. Higher scores indicate worse sleep quality. The categorization of continuous variables is typically discouraged in primary analyses because of the potential loss of information and statistical power. However, it is important to note that this approach is commonly used and validated for assessing clinically significant sleep disturbances with the PSQI. That is, an empirically derived global PSQI score >5 yields a diagnostic sensitivity of 89.6% and specificity of 86.5% for a distinction between “poor” and “good” sleepers (27) and achieves a sensitivity of 98.7% and specificity of 84.4% as a marker for sleep disturbances in insomnia patients versus controls (28). Expert consensus has recommended the PSQI as the primary method to measure global sleep quality (29). Cronbach α of the seven PSQI component scores in our sample was .61.
Psychometric DataBurnout was measured with the 22-item Maslach Burnout Inventory–Human Services Survey, which consists of the three subscales Emotional Exhaustion (nine items), Depersonalization (five items), and Personal Accomplishment (eight items) (19). Each item is rated on a scale ranging from 0 (“never”) to 6 (“daily”). In our sample, the Cronbach α coefficients for the subscales were .95 for Emotional Exhaustion, .87 for Depersonalization, and .77 for Personal Accomplishment. Job stress was assessed using the German short form of the Effort-Reward Imbalance questionnaire, consisting of three items related to work effort and seven items addressing work-related rewards (30). Each item was rated on a four-point Likert scale, ranging from 1 (“strongly disagree”) to 4 (“strongly agree”). The effort-reward ratio was computed by applying a correction factor that adjusts for the unequal number of effort and reward items. A higher effort-reward ratio indicates elevated levels of job stress. In our sample, Cronbach α was .76 for the effort scale and .77 for the reward scale. The German version of the Patient Health Questionnaire-9 was used to assess the severity of depressive symptoms in the previous 2 weeks (31). Participants rate the nine items on a four-point Likert scale between 0 (“not at all”) and 3 (“nearly every day”). Higher total scores (range, 0–27) indicate greater severity of depressive symptoms. In our sample, Cronbach α for the Patient Health Questionnaire-9 total scale was .79.
Health BehaviorsThe body mass index was determined by dividing the measured weight in kilograms by the square of the measured height in meters. Participants’ level of physical activity was evaluated by inquiring about the frequency of engaging in sports activities that induce sweating during an average week, with response options ranging from 0 to 7 times. Alcohol consumption was assessed based on the average number of standard drinks consumed per week.
Data AnalysisData analysis was conducted using IBM SPSS Statistics for Windows, Version 29.0 (IBM Corp., Armonk, New York), with a significance level set at p < .05 for two-tailed tests. The expectation maximization algorithm was used to replace 3.1% and 3.0% of missing items in the PSQI and Effort-Reward-Imbalance questionnaires, respectively. To account for the nonnormal distribution, a two-step procedure described elsewhere (32) was applied to transform all measurements of coronary microvascular function into a statistically normal distribution while preserving the original series mean and standard deviation.
Pearson χ2 test or Fisher exact test (where appropriate) and independent-samples t tests were conducted to compare categorical and continuous health characteristics, respectively, between the burnout group and the control group. Pearson correlation analysis was used to assess zero-order correlations between two variables. Linear regression analyses were modeled with measures of coronary microvascular function as dependent variables. All independent variables were entered in one block and centered to the mean to simplify the interpretation of the unstandardized coefficients B (with 95% confidence interval [CI]). That is, with centered variables, the estimated coefficient represents the change in a given measure of coronary microvascular function associated with a 1-unit change in a given independent variable, holding all other variables at their mean values. Model 1 considered burnout (yes/no) and the PSQI global score as independent variables, taking into account age, body mass index, physical activity, and alcohol consumption as covariates. These covariates were selected a priori as they have been shown to be associated with MBF (33–35) and subjective sleep quality assessed with the PSQI (36–39). Model 2, the main model, additionally considered the interaction between burnout and the global PSQI score. In case of a significant interaction for a given measure of coronary microvascular function, follow-up analyses examined which PSQI components and/or burnout subscales would show separate associations with the same measure. Mahalanobis distance indicated no influential outlier in multivariable models (all p values > .001). In quantifying the strength of associations, effect sizes are presented as correlation coefficients. Correlations of 0.1, 0.3, and 0.5 were interpreted as representing small, medium, and large effects, respectively.
Because of high multicollinearity between burnout and the Patient Health Questionnaire-9 score (by study design), depressive symptoms were not considered as a covariate in the primary analysis; instead, they were considered solely in a supplementary analysis. In particular, there was a Pearson correlation coefficient of 0.711 between the variable “group” and the Patient Health Questionnaire-9 score. In addition, the variance inflation factor for the Patient Health Questionnaire-9 score in the multivariable model was 2.832.
RESULTS Participant CharacteristicsTable 1 presents the characteristics of the study participants. Physicians experiencing burnout were, on average, 6 years younger and had accordingly practiced for less time than physicians without burnout. Other job-related characteristics and health behaviors were similar in both groups. Based on the study’s design, the burnout group displayed higher scores on burnout subscales and more severe job stress and depressive symptoms compared with the control group. The burnout group exhibited a significantly higher proportion (40%) of poor sleepers, which was four times greater than the control group (10%). Consequently, the burnout group also had a higher mean global PSQI score, indicating relatively lower sleep quality among physicians experiencing burnout. Regarding individual components of the PSQI, the burnout group reported poorer subjective sleep quality, longer sleep latency, more sleep disturbances, and increased daytime dysfunction compared with the control group. There were no significant group differences in measures of coronary microvascular function.
TABLE 1 - Characteristics of 60 Male Physicians Variable Burnout Group (n = 30) Control Group (n = 30) p Medical specialty .175 Internal medicine 12 (40) 8 (27.7) Surgery 4 (13.3) 7 (23.3) Psychiatry 2 (6.7) 4 (13.3) Oncology 0 (0) 4 (13.3) Cardiology 1 (3.3) 2 (6.7) Neurology 2 (6.7) 1 (2.3) Other 9 (30) 4 (13.4) Employee relationship 1.000 Self-employed 10 (33.3) 10 (33.3) Hospital/clinic 19 (63.4) 19 (63.4) Both 1 (3.3) 1 (3.3) Working hours per week, no. 57.4 (9.0) 54.7 (11.7) .331 Works at night, yes 18 (60) 17 (56.7) .793 Provides emergency service, yes 22 (73.3) 20 (66.7) .573 Practicing as a doctor, y 19.1 (11.0) 24.3 (8.2) .041 Age, y 46.77 (10.56) 52.93 (7.48) .012 Body mass index, kg/m2 25.63 (3.09) 24.35 (2.72) .094 Alcohol consumption, drinks/wk 3.72 (3.22) 2.93 (2.30) .280 Physical activity, times/wk 1.99 (1.62) 2.67 (1.92) .147 Emotional Exhaustion, score 29.17 (7.13) 6.67 (3.99) <.001 Depersonalization, score 11.33 (7.00) 3.07 (3.60) <.001 Personal Accomplishment, score 12.03 (6.74) 5.67 (4.37) <.001 Effort-reward ratio 1.34 (0.41) 0.87 (0.27) <.001 Depressive symptoms, score 7.40 (3.13) 2.20 (1.97) <.001 PSQI score 5.40 (1.65) 3.23 (1.98) <.001 PSQI cutoff >5, n (%) 12 (40) 3 (10) .007 PSQI component scores Subjective sleep quality 1.23 (0.57) 0.67 (0.61) <.001 Sleep latency 0.83 (0.46) 0.30 (0.54) <.001 Sleep duration 0.53 (0.63) 0.60 (0.62) .681 Sleep efficiency 0.20 (0.48) 0.13 (0.35) .542 Sleep disturbance 1.17 (0.38) 0.83 (0.38) .001 Use of sleep medication 0.07 (0.25) 0.10 (0.40) .703 Daytime dysfunction 1.37 (0.62) 0.60 (0.68) <.001 MBF, rest, ml/g/min 0.64 (0.13) 0.66 (0.10) .530 Coronary flow reserve (cold pressor test) 1.50 (0.52) 1.48 (0.45) .838 MBF response (cold pressor test), ml/g/min 0.32 (0.37) 0.33 (0.31) .966 Hyperemic MBF (cold pressor test), ml/g/min 0.94 (0.44) 1.00 (0.32) .581 Coronary flow reserve (adenosine) 4.31 (1.43) 4.58 (1.09) .409 MBF response (adenosine), ml/g/min 2.05 (0.62) 2.27 (0.63) .176 Hyperemic MBF (adenosine), ml/g/min 2.66 (0.61) 2.96 (0.65) .075PSQI = Pittsburgh Sleep Quality Index; MBF = myocardial blood flow.
Values are given as numbers with percentages (in parentheses) or as mean and standard deviation (in parentheses). Normalized values are given for measures of coronary microvascular function. Group differences were calculated with Pearson χ2 test or Fisher exact test (where appropriate) or independent-samples t test.
In the entire sample, a higher global PSQI score was associated with a higher body mass index (r = 0.293, p = .023). In contrast, the global PSQI score showed no significant associations with job-related characteristics. Specifically, the global PSQI score did not differ between physicians who also worked nights (p = .40) or provided emergency service (p = .41), and those who did not work nights or provide emergency service. The PSQI global score was also not significantly related to the number of years practicing medicine, average number of hours worked per week, employment status, and medical specialty (p values > .41).
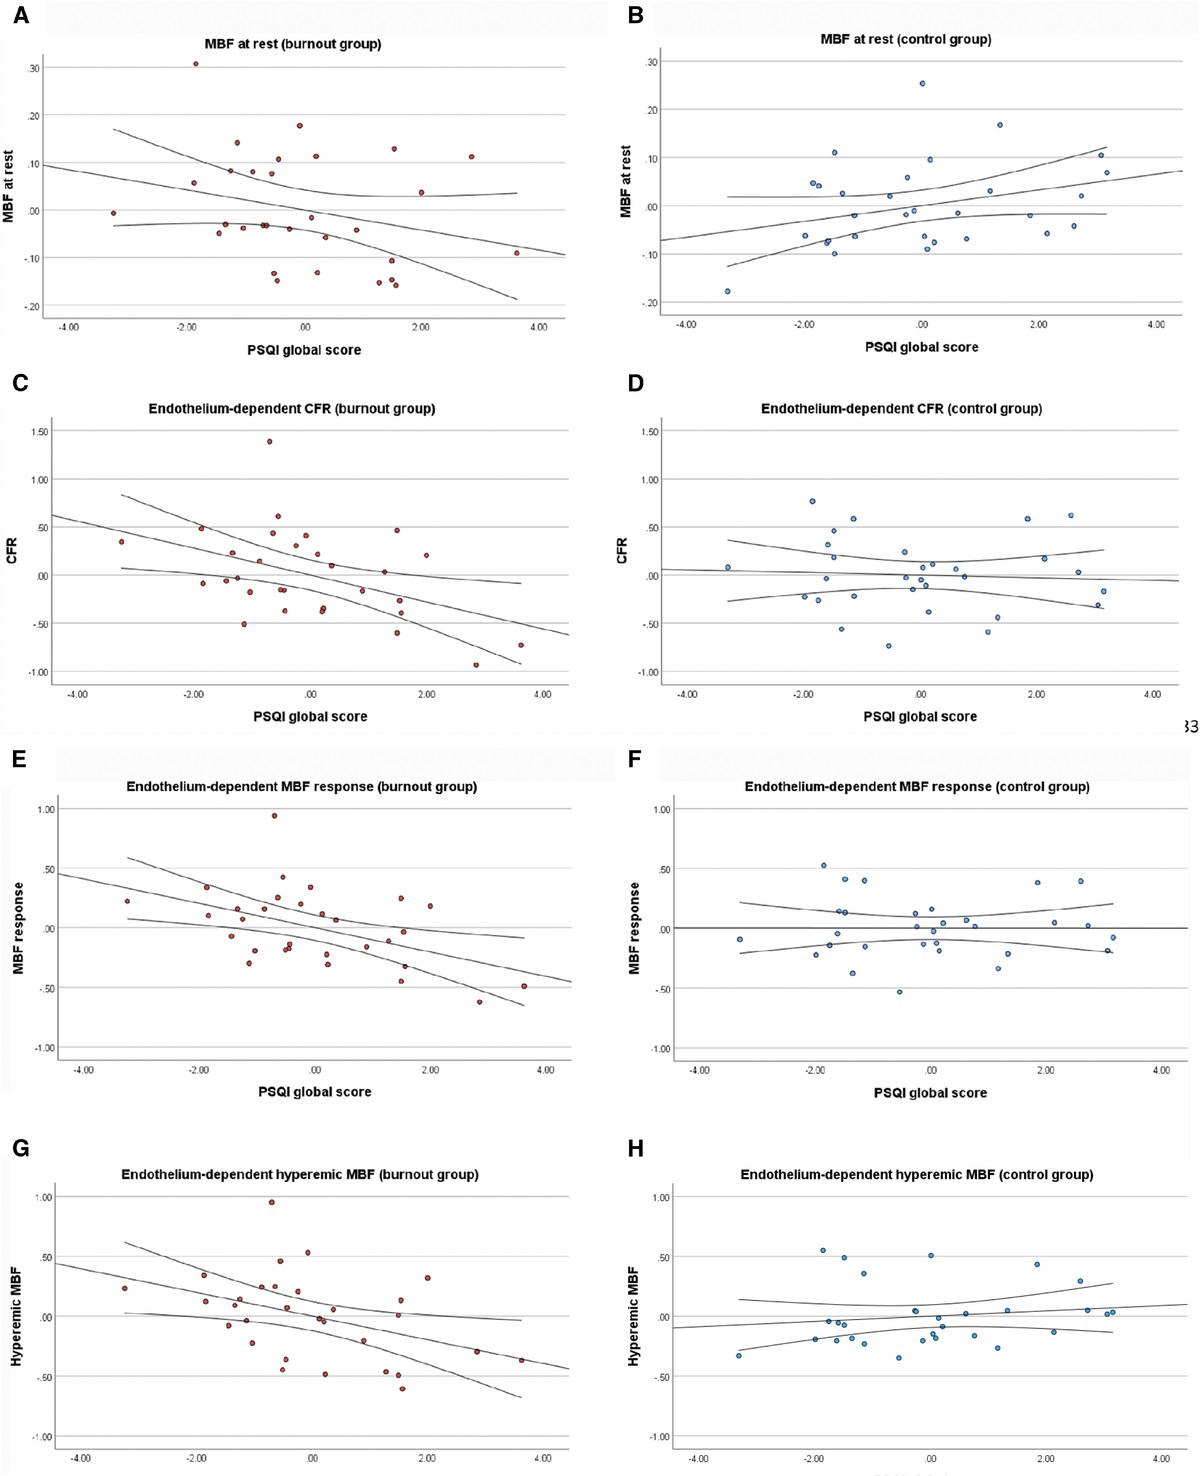
MBF at RestBurnout subscales and PSQI global and component scores showed no significant zero-order correlations with MBF at rest (Table S1, Supplemental Digital Content 1, https://links.lww.com/PSYMED/A985). However, as shown in Table 2 (model 2), a significant group-by-global PSQI score interaction (r partial = −0.304, p = .025) was observed in the multivariable linear regression analysis. The interaction revealed a negative relationship between the global PSQI score and MBF at rest in the burnout group (B = −0.021, 95% CI = −0.052 to 0.010; p = .17; Figure 1A), but a positive relationship in the control group (B = 0.016, 95% CI = −0.005 to 0.038; p = .13; Figure 1B). Subsequent post hoc analyses using PSQI component scores indicated no significant interactions between group and any of the seven sleep components (p values > .17). Also, post hoc analyses using the three burnout subscales separately (instead of group) revealed no significant interactions between the global PSQI score and Emotional Exhaustion, Depersonalization, or Personal Accomplishment for MBF at rest (p values > .10).
TABLE 2 - Multivariable Associations of Burnout and PSQI Global Score With Measures of Coronary Microvascular Function Cold Pressor Test: Endothelium-Dependent MBF Adenosine Challenge: Endothelium-Independent MBF MBF at Rest CFR MBF Response Hyperemic MBF CFR MBF Response Hyperemic MBF Model 1: Main effects Constant 0.652*** (0.623 to 0.681) 1.491*** (1.379 to 1.603) 0.324*** (0.247 to 0.400) 0.972*** (0.888 to 1.056) 4.444*** (4.112 to 4.776) 2.161*** (2.000 to 2.322) 2.807*** (2.647 to 2.968) Age (y) 0.004* (<0.000 to 0.007) 0.014* (<0.001 to 0.029) 0.012** (0.003 to 0.022) 0.019*** (0.009 to 0.029) −0.016 (−0.056 to 0.024) 0.006 (−0.013 to 0.026) 0.013 (−0.007 to 0.032) Body mass index (kg/m2) −0.007 (−0.019 to 0.004) −0.051* (−0.095 to −0.007) −0.041** (−0.071 to −0.011) −0.044** (−0.076 to −0.011) −0.070 (−0.199 to 0.160) −0.044 (−0.107 to 0.019) −0.046 (−0.108 to 0.017) Physical activity (times/wk) −0.010 (−0.029 to 0.008) −0.029 (−0.100 to 0.043) −0.030 (−0.079 to 0.018) −0.041 (−0.094 to 0.012) 0.101 (−0.110 to 0.312) 0.017 (−0.085 to 0.119) 0.005 (−0.097 to 0.107) Alcohol consumption (drinks/wk) −0.003 (−0.014 to 0.008) −0.017 (−0.061 to 0.027) −0.009 (−0.039 to 0.021) −0.022 (−0.055 to 0.011) 0.028 (−0.102 to 0.159) −0.003 (−0.067 to 0.060) −0.014 (−0.077 to 0.049) Burnout (yes/no) 0.013 (−0.060 to 0.085) 0.341* (0.061 to 0.621) 0.228* (0.037 to 0.419) 0.186 (−0.023 to 0.395) −0.086 (–0.914 to 0.743) −0.004 (−0.398 to 0.405) −0.023 (−0.425 to 0.378) PSQI (Global score) 0.001 (−0.018 to 0.016) −0.079* (−0.144 to −0.015) −0.053* (−0.097 to −0.009) −0.036 (−0.084 to 0.012) −0.069 (−0.260 to 0.122) −0.052 (−0.145 to 0.040) −0.056 (−0.149 to 0.036) Model 2: Interaction effect Burnout by PSQI score −0.039* (−0.073 to −0.005) −0.127 (−0.261 to 0.007) −0.101* (−0.191 to −0.011) −0.126* (−0.223 to −0.029) 0.091 (−0.317 to 0.499) −0.096 (−0.293 to 0.100) −0.126 (−0.321 to 0.069)PSQI = Pittsburgh Sleep Quality Index; MBF = myocardial blood flow; CFR = coronary flow reserve.
Values given are unstandardized β coefficients with 95% confidence interval. In model 1, all variables were entered in one block. In model 2, the interaction term between burnout (yes/no) and the PSQI global score was additionally included (statistics are only shown for the interaction term).
Significance level: * p < .050, ** p < .010, *** p < .001.
 FIGURE 1:
 Multivariable associations between sleep quality and endothelium-dependent coronary microvascular function in physicians with burnout and controls. Shown are partial regression plots with fit line (95% confidence interval) for the associations between the PSQI global score and measures of endothelium-dependent coronary microvascular function in 30 physicians with burnout (burnout group) and 30 physicians without burnout (control group). All analyses were adjusted for age, body mass index, physical activity, and alcohol consumption. Interaction terms between group and the PSQI global score were significant (p values < .050) for MBF at rest (A and B), MBF response (E and F), and hyperemic MBF (G and H); for CFR (C and D), the interaction showed a trend toward significance (p = .062). PSQI = Pittsburgh Sleep Quality Index; MBF = myocardial blood flow; CFR = coronary flow reserve.
Endothelium-Dependent Coronary Microvascular Function Zero-Order CorrelationsSupplemental Table S1, shows that a higher global PSQI score was significantly correlated with lower CFR and MBF response with the cold pressor test. Of the individual PSQI components, both sleep latency and use of sleep medication correlated significantly and inversely with CFR and MBF response. Burnout subscales showed no significant correlations with measure of endothelium-dependent coronary microvascular function.
Multivariable Linear Regression Analysis Global PSQI ScoreAs shown in Table 2, model 2, the group-by-global PSQI score interaction for CFR showed a trend toward statistical significance only (partial r2 = −0.255, p = .062). However, because this result was consistent with observations for MBF response and hyperemic MBF (see discussion hereinafter), we decided against model 1 and the interpretation of significant main effects for group and the global PSQI score. The relationship between the PSQI global score and CFR was negative in both groups but stronger in the burnout group (B = −0.140, 95% CI = −0.256 to −0.033; p = .021; Figure 1C) than in the control group (B = −0.014, 95% CI = −0.107 to 0.080; p = .76; Figure 1D). Significant interactions between group and the global PSQI score were observed for MBF response (r partial = −0.298, p = .028) and hyperemic MBF (r partial = −0.339, p = .012). There was a negative relationship between the global PSQI score and MBF response in the burnout group (B = −0.102, 95% CI = −0.181 to −0.023; p = .013; Figure 1E) with an almost absent relationship in the control group (B < 0.001, 95% CI = −0.063 to 0.062; p = .99; Figure 1F). The relationship between the global PSQI score and hyperemic MBF was negative in the burnout group (B = −0.099, 95% CI = −0.189 to −0.009; p = .033; Figure 1G) and positive in the control group (B = 0.022, 95% CI = −0.041 to 0.085; p = .47; Figure 1H).
Additional Independent PredictorsYounger age and higher body mass index were significantly associated with lower levels of CFR, MBF response, and hyperemic MBF.
PSQI Component ScoresWith one exception, post hoc analyses using PSQI component scores indicated no significant interactions between group and any of the seven sleep components for CFR (p values > .097), MBF response (p values > .20; except for daytime dysfunction), and hyperemic MBF (p values > .10). The only significant interaction observed was between group and daytime dysfunction for MBF response (r partial = −0.271, p = .047). The relationship between daytime dysfunction and MBF response was negative in the burnout group (B = −0.248, 95% CI = −0.444 to −0.051; p = .016) relative to the control group (B = 0.016, 95% CI = −0.146 to 0.178; p = .84), indicating that higher daytime dysfunction was associated with lower MBF response in the burnout group.
Burnout SubscalesPost hoc analyses using the three burnout subscales separately revealed no significant interactions between the global PSQI score and Emotional Exhaustion, Depersonalization or Personal Accomplishment for CFR (p values > .29), MBF response (p values > .21), and hyperemic MBF (p values > .14).
Endothelium-Independent Microvascular FunctionWith the adenosine challenge, a higher global PSQI score was significantly correlated with lower MBF response (Supplemental Table S1, https://links.lww.com/PSYMED/A985). Of the individual PSQI components, longer sleep duration and use of sleep medication were correlated with lower CFR. Moreover, use of sleep medication was also correlated with lower MBF response, and worse daytime dysfunction was correlated with lower hyperemic MBF. However, Table 2 shows that there were no significant main effects of burnout and the global PSQI score in multivariable regression analyses on CFR, MBF response, and hyperemic MBF (model 1). Therefore, we did not perform post-hoc analyses with individual sleep components as predictors. Also, no significant group-by-global PSQI score interactions were observed for measures of endothelium-independent coronary microvascular function (model 2). Finally, age and health behaviors showed no significant independent effects.
Supplementary Analyses Hemodynamic ResponsesTable S2, Supplemental Digital Content 2,
留言 (0)