
記住我

Perforating artery territory infarction (PAI), a subtype of single subcortical infarction (SSI) caused by the occlusion of a perforating artery, is frequently observed in acute ischemic stroke, accounting for approximately 15.3–25% of all stroke cases (1, 2). The etiology of PAI may involve several mechanisms, such as lipohyalinosis, large plaques in the parent artery, and microatheroma (3). Lipohyalinosis is a vasculopathy that affects cerebral small vessels, leading to a “lacunar infarct” (LI), a major contributor to PAI (4, 5). Similarly, large plaques in the parent artery with severe stenosis may result in perforating artery embolisms. Additionally, microatheromas may give rise to branch atheromatous disease (BAD), characterized by ischemic lesions of ≥15 mm in diameter, typically observed on radiological imaging and the absence of severe stenosis of the parent artery (6).
Early neurological deterioration (END), characterized as a rapid exacerbation of neurological symptoms during the acute phase of a stroke, has been observed in 20–43% of PAI patients (7–9) and is linked to unfavorable patient outcomes (10, 11). The efficacy of treatment strategies for END in PAI patients, particularly those without severe stenosis of the parent artery, such as in LI and BAD cases, remains uncertain. The prediction of END in these patients is complex and heterogeneous, posing challenges to clinical management. Thus, identifying risk factors, pinpointing high-risk patients, and implementing timely interventions are essential for managing END in PAI patients without severe stenosis of the parent artery.
Advancements in computing power, the proliferation of big data, and the evolution of algorithms have significantly propelled machine learning (ML) in disease prediction (12). ML algorithms, a crucial aspect of artificial intelligence, excel at discerning patterns within intricate datasets using computational methods (13, 14). Compared to traditional statistics, ML shows greater proficiency in forecasting complex clinical events influenced by numerous factors and variables (15). Consequently, this research aims to develop ML models adept at predicting END in PAI patients without severe stenosis of the parent artery, utilizing data from a real-world, single-center cohort database.
2 Methods 2.1 Study design and patientsThis retrospective, observational study was conducted on a cohort of PAI patients at Jincheng People's Hospital from September 2016 to July 2022. The inclusion criteria were as follows: patients aged 18 years or older, those diagnosed with PAI, and those admitted within 24 h of symptom onset. PAI was characterized as a single, small subcortical infarction in the territory of a perforating arteriole (16), identified by magnetic resonance imaging (MRI), and without significant large vessel stenosis (>50%), as confirmed by magnetic resonance angiography (MRA) or computed tomography angiography (CTA), with no maximum diameter limit (17). The exclusion criteria encompassed patients with multiple or cortical lesions, a premorbid modified Rankin Scale (mRS) score of ≥2, stroke mimics, or MRI-negative stroke. The study was approved by the ethics committee of Jincheng People's Hospital, and written informed consent was waived due to its retrospective nature; all patient information was anonymized before analysis.
2.2 Baseline dataWe collected baseline data, including demographic details such as age, sex, and body mass index (BMI). We also gathered information on current smoking and drinking habits (≥20 g/day), medical history (including stroke, hypertension, diabetes, coronary atherosclerotic heart disease, and atrial fibrillation), secondary prevention treatment, laboratory data, clinically significant features [such as time from onset to presentation, National Institutes of Health Stroke Scale (NIHSS) score, pre-stroke mRS score], acute phase treatment [including IV thrombolysis with alteplase, loading dose dual antiplatelet therapy (DAPT, 100 mg aspirin and 300 mg clopidogrel), single antiplatelet therapy (SAPT), lipid-lowering drugs, and argatroban], and radiological characteristics.
Radiological characteristics encompassed location (such as the internal capsule, basal ganglia, thalamus, pons, lateral ventricle, and centrum semiovale), the culprit vessel supplying the basal ganglia (including the lenticulostriate artery (LSA), posterior choroidal artery, and the recurrent artery of Heubner), stroke subtypes (such as LI and BAD), maximum axial infarct diameter, layers of cerebral infarct lesions, and white matter hyperintensities (WMH). The definition of BAD is based on infarct lesions observed in transversal diffusion-weighted imaging (DWI) scans that extend for at least three consecutive slices within LSA terminations or unilateral involvement of the pons connected to the cerebral surface of the ventral pons without crossing the midline in the paramedian pontine artery (PPA) terminations (1, 18). Maximal axial infarct diameter and layers of cerebral infarct lesions were measured in transversal DWI scans at baseline, with WMH severity at baseline categorized using the modified Fazekas scale (19).
Following data collection, a total of 65 variables were included in the baseline data analysis.
2.3 Outcome definitionThe primary outcome of this analysis was END, defined as an increase in the NIHSS score of ≥2 and a rise in the motor component of the NIHSS score of ≥1 compared to the initial NIHSS score within 7 days of hospital admission.
2.4 Machine learning algorithmsIn this study, we utilized seven ML models to predict END in PAI patients: logistic regression (LR) (20), random forest (RF) (21), adaptive boosting (AdaBoost) (22), gradient boosting decision tree (GBDT) (23), histogram-based gradient boosting (HGB) (24, 25), extreme gradient boosting (XGBoost) (26), and category boosting (CatBoost) (27, 28). The best-performing model was selected based on its evaluation metrics. LR, suited for binary classification problems, predicts outcomes by converting a linear function into a sigmoid function, ranging from 0 to 1. RF, an ensemble learning method, combines multiple decision trees, each built from randomly selected subsets of training data and features, to enhance performance and generalizability. AdaBoost, GBDT, HGB, XGBoost, and CatBoost are ensemble learning methods that strengthen models by sequentially training multiple weak learners, with each new model focusing on correcting the errors of its predecessors. The following provides a comprehensive examination of the five ensemble learning methodologies.
2.4.1 AdaBoostThe fundamental principle of the AdaBoost algorithm involves categorizing a collection of weak learners through a process of weighted majority voting, or summation. This method takes into account the errors committed by preceding weak learners and consistently refines the dataset (22, 29).
2.4.2 GBDTThe core concept of GBDT involves employing a gradient-boosting methodology to train a series of decision trees. In each iterative training phase, GBDT computes the residual or gradient of the existing model and utilizes it as the training objective for the subsequent decision tree. The incorporation of new decision trees aims to approximate this residual or gradient, thereby progressively enhancing the performance of the model (23).
2.4.3 HGBHGB refers to the implementation of gradient boosting algorithms, particularly the popular XGBoost and LightGBM libraries, which use histograms to approximate the distribution of the data. This approach enhances the efficiency and scalability of the model training process without sacrificing much accuracy (24, 25).
XGBoost, a sophisticated and scalable machine learning technique, is renowned for its exceptional proficiency in efficiently managing missing data and seamlessly integrating weak predictive models to form a more precise one. It employs a second-order Taylor expansion to compute the loss function, thereby exhibiting superior performance in both computational speed and prediction accuracy (30, 31).
2.4.4 CatBoostA machine learning library that has been designed to efficiently handle categorical features. Developed by Yandex, it is renowned for its superior performance in gradient-boosting algorithms, particularly when applied to datasets that contain both numerical and categorical variables (28).
2.5 Data processingIn this study, continuous variables were imputed using the median values for each variable to address missing values. Categorical variables were converted into numerical values through dummy encoding. All numerical values were then standardized to ensure uniformity in scale and precision in comparisons.
2.6 Feature selectionFeature selection (32), a process used to eliminate superfluous features from a large dataset, improves a machine learning model's efficiency. We employed recursive feature elimination with cross-validation (RFECV), a prominent algorithm in feature selection, which methodically removes the least important features to pinpoint the most effective subset. This study used RFECV based on logistic regression for optimal variable selection.
2.7 Model derivation and validationPatients were randomly divided into training and testing sets at a 7:3 ratio. For model derivation, a shuffle-split cross-validation method was employed to prevent overfitting to a specific dataset and to ensure model generalizability. Shuffle-split cross-validation (33) is a resampling technique employed in machine learning to assess model performance on a constrained data sample. This method entails the random division of the dataset into two subsets: one designated for training and the other for testing. The procedure is executed multiple times, or “folds”, to yield an average performance metric. Widely adopted in machine learning, shuffle-split cross-validation ensures that model efficacy remains robust, avoiding overreliance on specific data partitioning. This approach effectively reduces biases and offers a more dependable estimation of the model's generalization capabilities for novel, unseen datasets.
Additionally, GridSearch CV with shuffle-split cross-validation was utilized to fine-tune and optimize the model hyperparameters on the training set. Supplementary Table 1 details the selected parameter values for each algorithm in the grid-search process. After optimization on the training set, model performance in the testing set was assessed using various metrics, including receiver operating characteristic (ROC) curve, accuracy, F1-score, Matthew's correlation coefficient (MCC), specificity, sensitivity, positive predictive value (PPV), negative predictive value (NPV), and Youden's index.
2.8 Model interpretationTo evaluate the importance of each variable, the Shapley Additive exPlanations (SHAP) values were utilized to interpret the machine learning model. Originating from cooperative game theory (34), SHAP assigns an importance value to each feature for a given prediction. A positive SHAP value signifies a beneficial impact on the model's prediction, whereas a negative value indicates an adverse effect. The SHAP method thus serves as a vital tool for understanding and interpreting the behavior of machine learning models.
2.9 Statistical analysisPatients were divided into two groups based on the END outcome: the END group and the clinically stable group. Continuous variables were presented as mean ± standard deviation for normally distributed variables and as medians with interquartile ranges (IQRs) for non-normally distributed data. Categorical variables were expressed as percentages. Categorical variables were analyzed using Fisher's exact test or a χ2 test, while continuous variables were assessed using the Student's t-test or Mann–Whitney U-test. Statistical analyses were conducted using IBM SPSS Statistics for Windows, version 25.0 software (IBM Corp., Armonk, NY, USA), and a two-sided p-value of ≤ 0.05 was considered statistically significant. The ML algorithms were implemented using Python software (version 3.9).
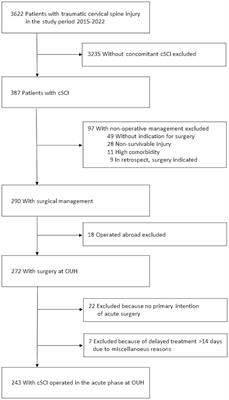
3 Results 3.1 Baseline characteristicsThe study initially included 1,273 patients, but 1,020 PAI patients were enrolled for evaluation after excluding 253 subjects due to missing data and fulfilling the exclusion criteria. Figure 1 presents the patient flow diagram. The baseline characteristics are detailed in Table 1. The average age of the 1,020 patients was 60.46 (range 49.11–71.81) years, with 30.39% of them being women. The END group comprised 129 (12.65%) patients with an average age of 59.08 (range 48.29–69.87) years, and 27.91% were women; the clinically stable group included 891 (87.35%) patients, averaging 60.66 (range 49.24–72.08) years, with 30.74% being women. The median time to END onset was 16 (range 5–25) h. The univariate analysis indicated that factors such as apolipoprotein B (Apo B), the ratio of apolipoprotein A1 (ApoA1) to ApoB, admission NIHSS score, motor arm NIHSS score, motor leg NIHSS score, facial palsy NIHSS score, alteplase, argatroban, lesion location (including the basal ganglia, internal capsule, lateral ventricle, and thalamus), lenticulostriate artery, stroke subtype, and maximal axial infarct diameter were significantly associated with an increased risk of END.
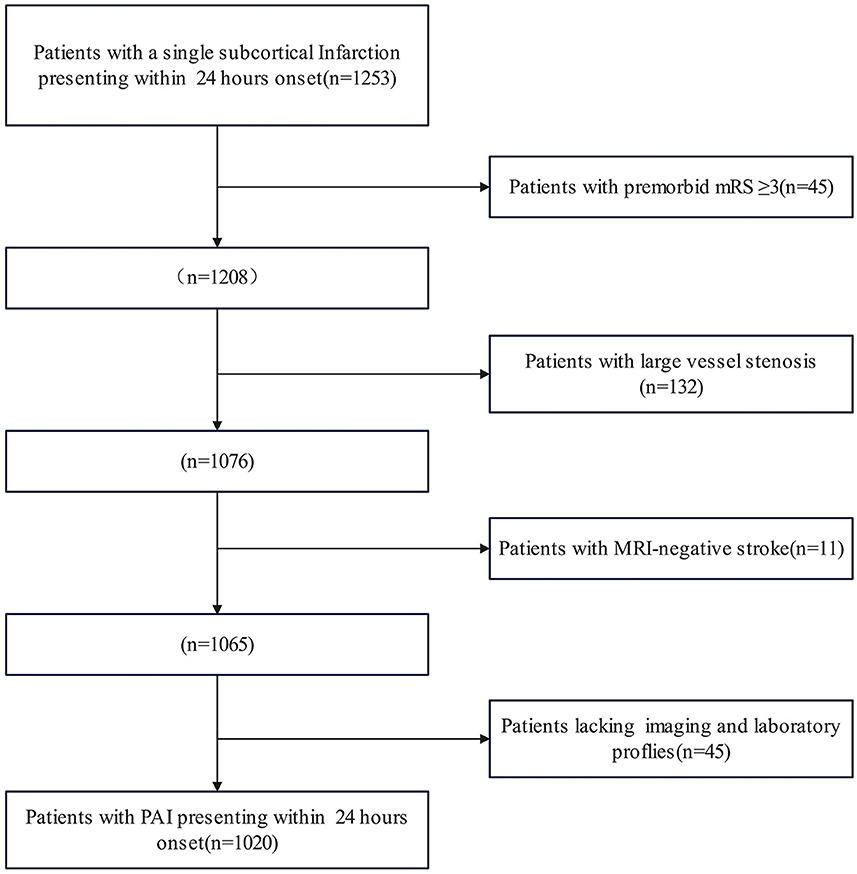
Figure 1. Flow diagram of the included patients.
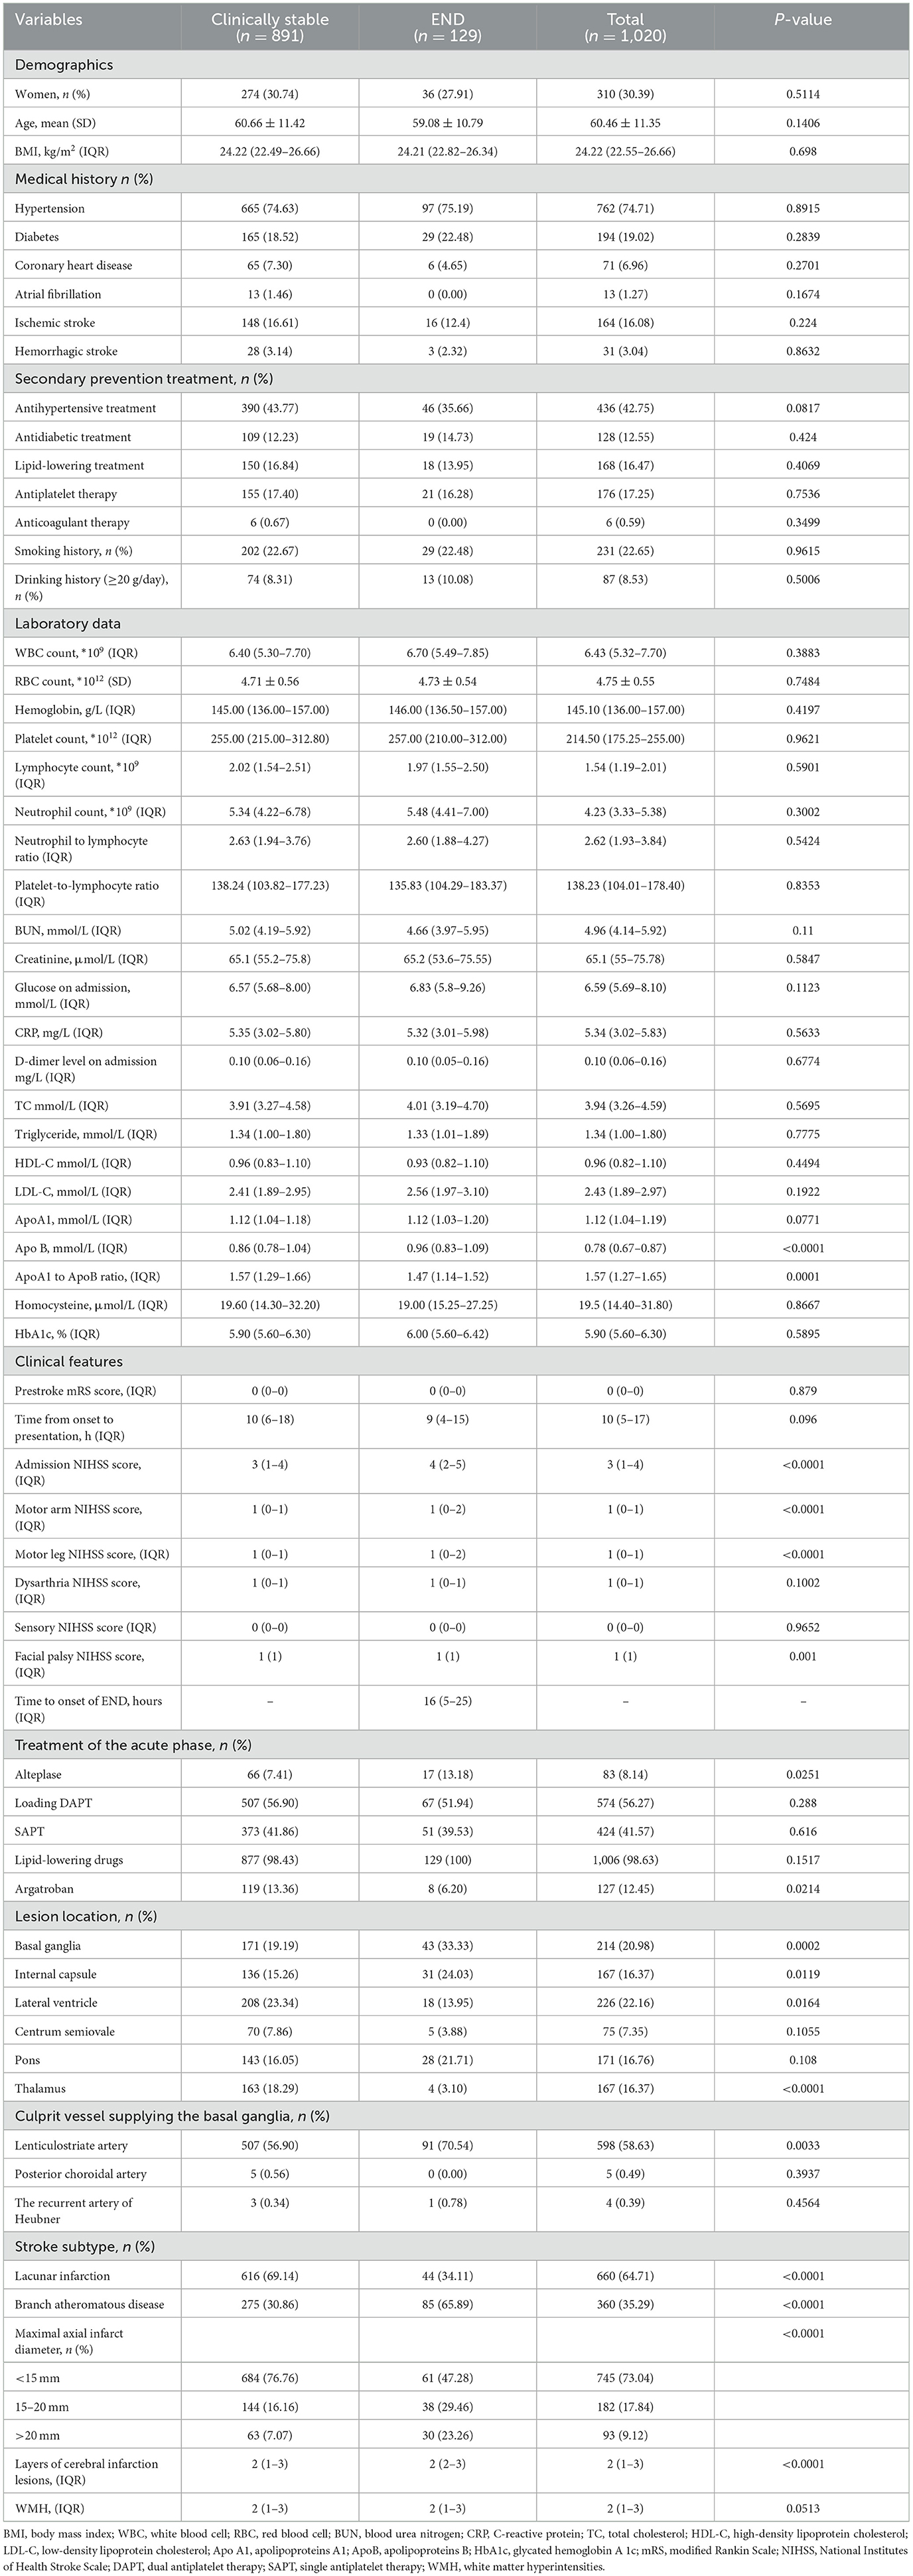
Table 1. Baseline variables for the total population and for both groups.
3.2 Features selectionBased on the RFECV results, 13 variables were identified for the predictive model, including blood urea nitrogen (BUN), total cholesterol (TC), low-density lipoprotein cholesterol (LDL-C), apolipoprotein B (apoB), atrial fibrillation, loading-dose dual antiplatelet therapy (DAPT), single antiplatelet therapy (SAPT), argatroban, the basal ganglia, the thalamus, the posterior choroidal arteries, maximum axial infarct diameter (measured at < 15 mm), and stroke subtype. Figure 2 shows how accuracy varies with changes in variables.
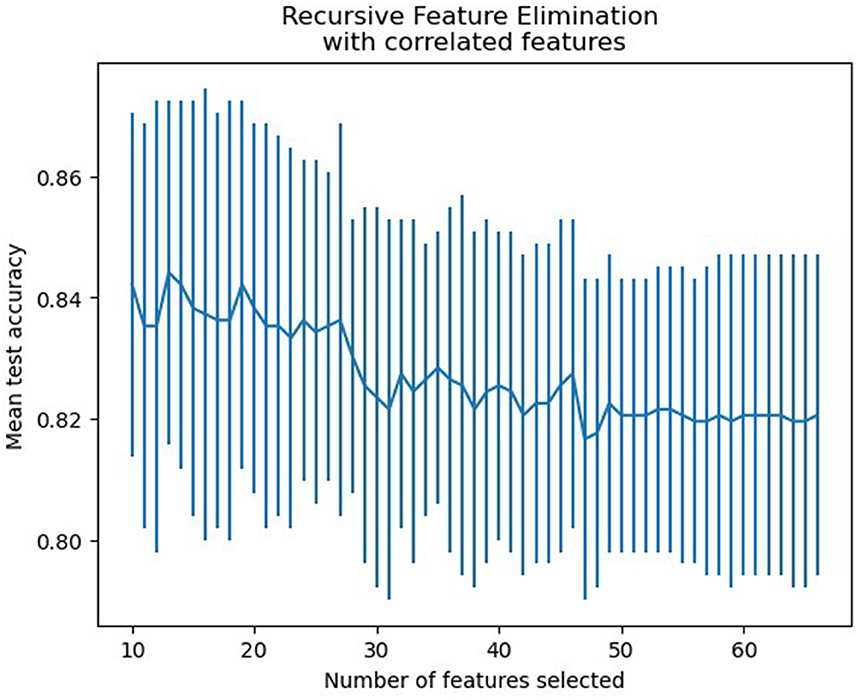
Figure 2. Features selection accuracy curve (the accuracy achieved its peak when the number of variables was 13).
3.3 Model performanceThe training set for model development comprised 714 patients, including 90 with an END outcome, while the testing set for evaluating model performance consisted of 306 patients, 39 of whom experienced an END outcome. Supplementary Table 2 provides a detailed overview of the features selected for both datasets. We employed seven ML algorithms, namely LR, RF, AdaBoost, GBDT, HGB, XGBoost, and CatBoost, to determine the most effective predictive model. Table 2 displays the area under the curve (AUC) for these seven ML algorithms on both the training and testing datasets. Additionally, it offers a comprehensive analysis of accuracy, F1-score, Matthew's correlation coefficient (MCC), specificity, sensitivity, positive predictive value (PPV), negative predictive value (NPV), and Youden's index for these algorithms on the testing dataset. The GBDT model achieved the highest AUC value at 0.914—an essential measure for evaluating predictive model performance, followed by the CatBoost, XGBoost, HGB, RF, AdaBoost, and LR models (0.8923, 0.8807, 0.876, 0.8639, 0.8184, 0.7838, respectively). Figure 3 illustrates the ROC curve and AUC for each ML classifier in the testing dataset. In conclusion, the GBDT model outperformed the other six ML algorithms, suggesting its superior effectiveness in our study. The confusion matrix for GBDT is shown in Figure 4.
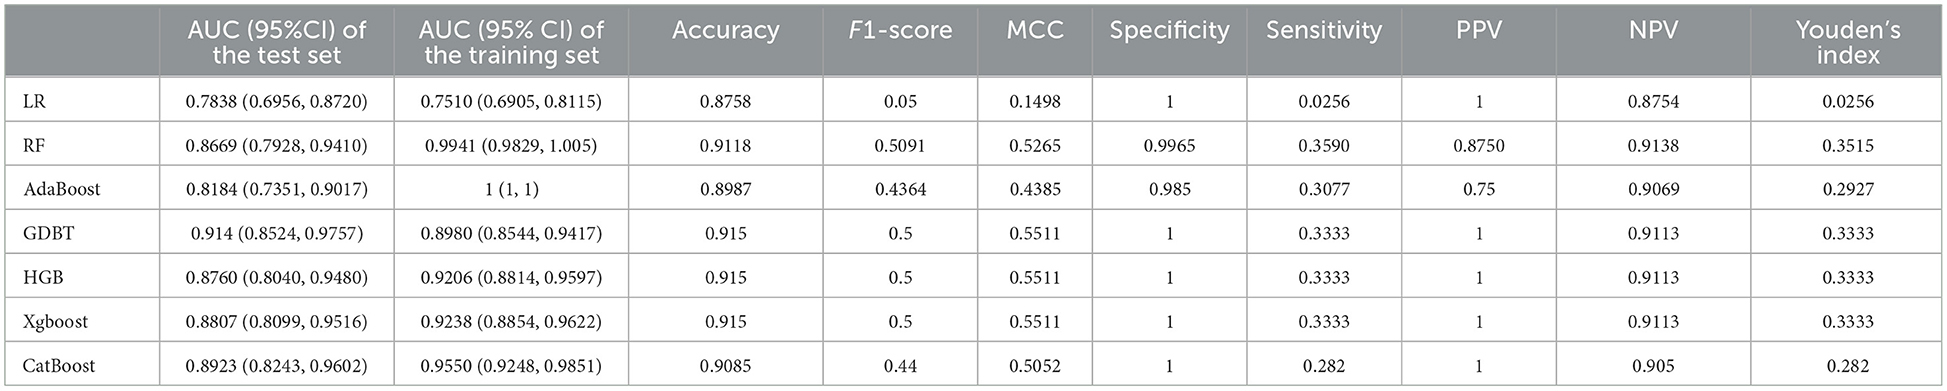
Table 2. Summary of prediction results of six ML algorithms based on the training and testing dataset.
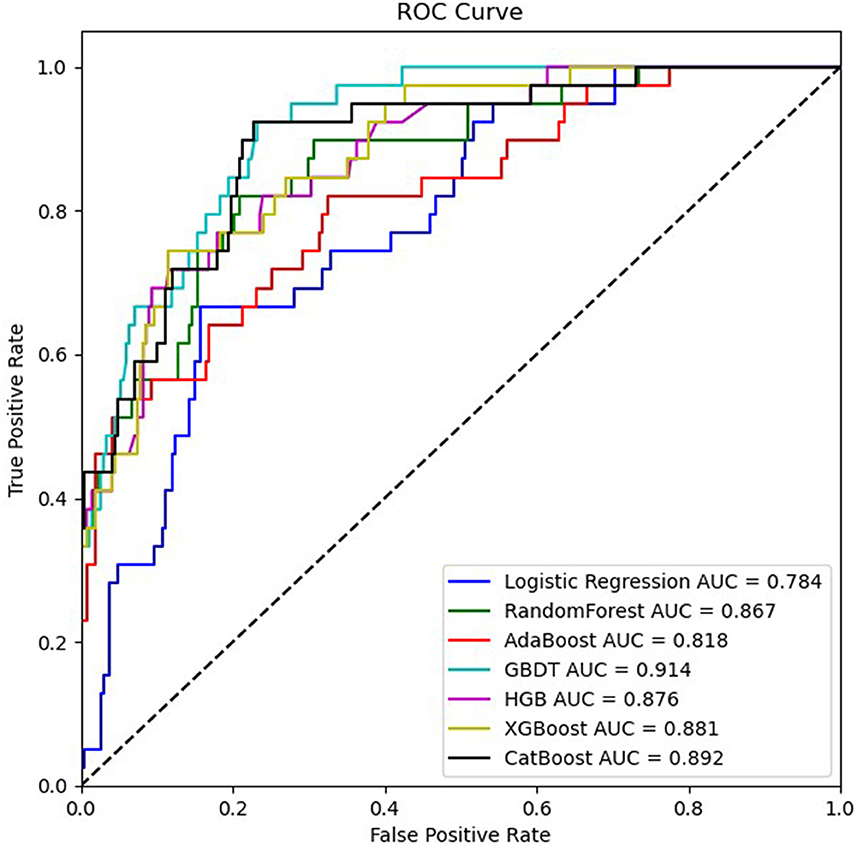
Figure 3. ROC curves of seven ML algorithms based on variables in the testing dataset.
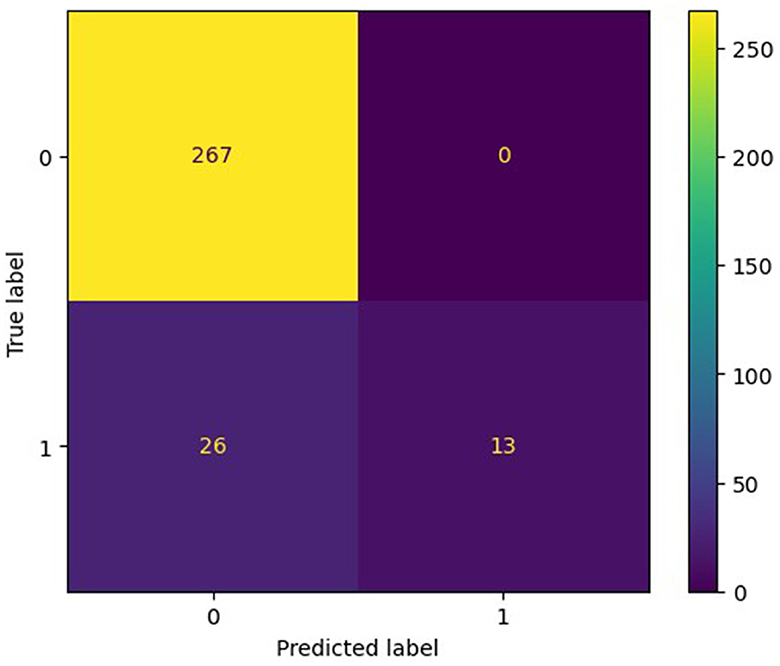
Figure 4. The confusion matrix of the most effective model, GBDT.
3.4 Interpretation of the machine learning modelTo evaluate the significance of each feature in the predictive model, we applied the SHAP method to the GBDT model in the testing dataset. The SHAP value analysis revealed that the most impactful features were apoB, TC, BUN, LDL-C, and a maximal axial infarct diameter of < 15 mm. Following these features were the stroke subtype, the basal ganglia, the thalamus, argatroban, single antiplatelet therapy, and loading dual antiplatelet therapy. Atrial fibrillation and posterior choroidal arteries also contributed to the prediction model but exhibited lower SHAP values. Figure 5 shows the SHAP summary plot for the GBDT model in the testing dataset, where each dot represents an individual case; the color indicates the feature's value (red for higher, blue for lower). Notably, a higher SHAP value for a feature indicates a greater likelihood of END occurrence. Figure 6 displays the ranking of feature importance based on SHAP values.
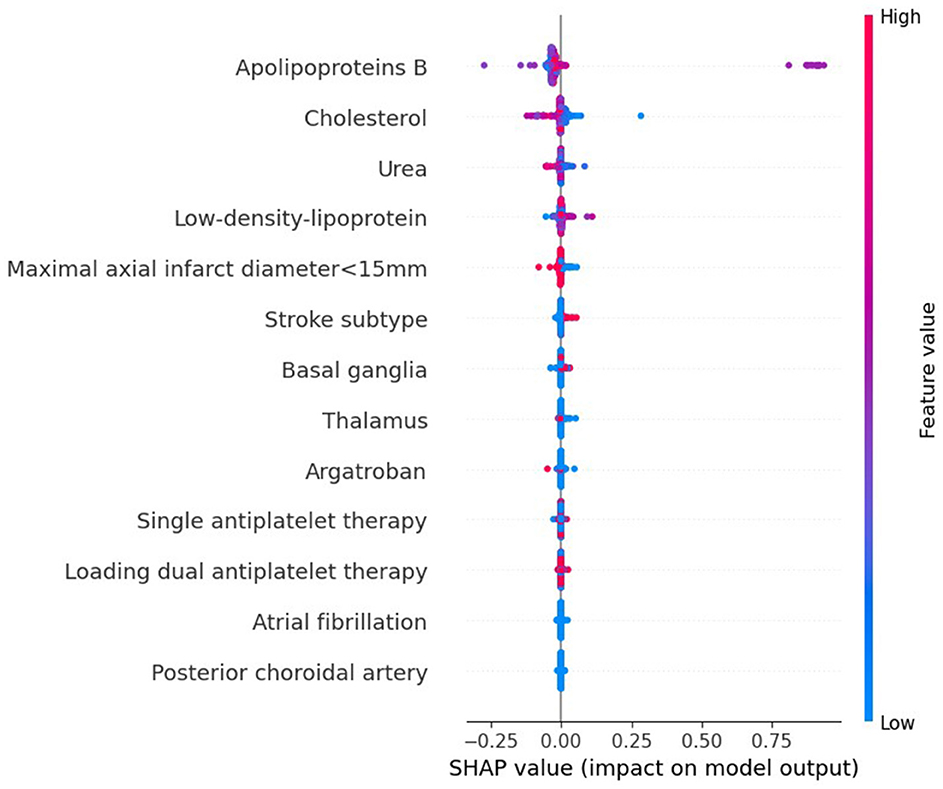
Figure 5. The SHAP summary plot on the test data derived from the optimal prediction model, GBDT.
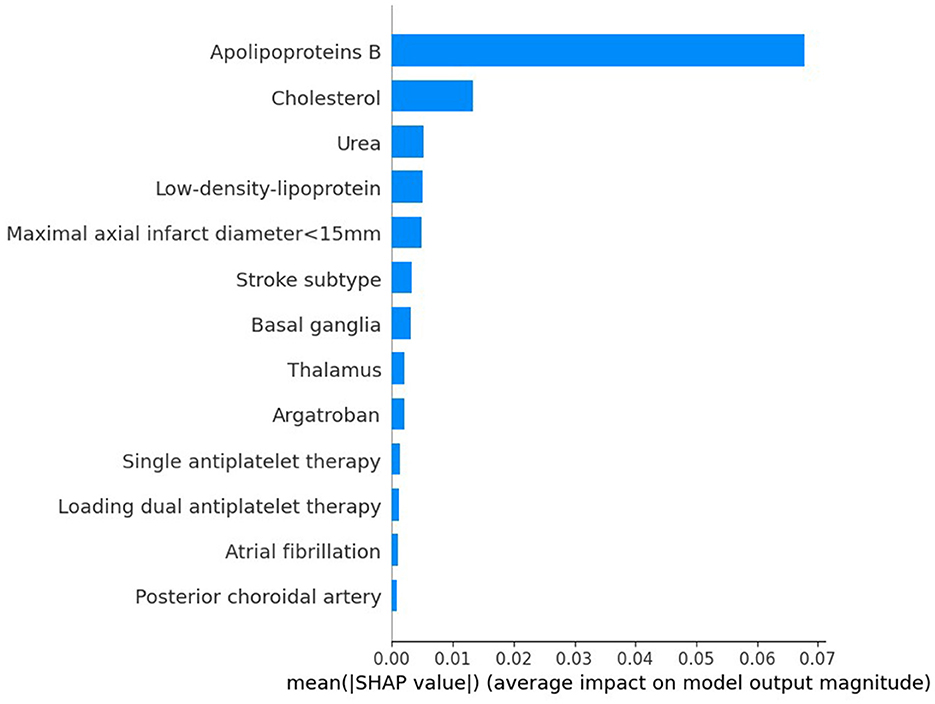
Figure 6. Ranking of the features' importance indicated by SHAP analysis of the best prediction model, GBDT.
4 DiscussionML techniques that are integral to artificial intelligence have gained substantial attention and are increasingly employed in medical research for tasks such as screening, diagnosis, and prognosis. Recent studies (15, 35) have investigated the use of ML algorithms in predicting END in patients with acute minor stroke and atrial fibrillation-related stroke. Although these studies yielded promising results with ML, they did not specifically focus on predicting END in patients with PAI—a stroke subtype with a high incidence of END. Our study aimed to use seven ML models to predict END in PAI patients. To address the inherent “black box” nature of ML, we employed the SHAP method to elucidate the predictions of the most effective model, ensuring both the model's performance and its clinical interpretability. This approach enabled the effective communication of information through intuitive visual tools, thereby enhancing clinicians' comprehension of the model's decision-making process and aiding in the clinical application of the prediction results.
In our research, we demonstrated that interpretable machine learning techniques can effectively predict END and personalize predictions for individual patients. The results showed that the GBDT model surpassed six other ML algorithms in terms of AUC and accuracy. Furthermore, the five most important variables associated with END prediction were identified as apoB, TC, BUN, LDL-C, and a maximum axial infarct diameter of < 15 mm. Previous studies have indicated that the END in single subcortical infarctions, including lacunar stroke, is influenced by various factors such as capsular warning syndrome, higher mean arterial pressure at admission, the location of the infarct in the ventral pons, and the extent of hypoperfusion lesion on perfusion-weighted imaging (17). Other factors, such as the initial NIHSS score, pulsatility index, parent artery disease, and neutrophil-to-lymphocyte ratio, also play significant roles (9). In our study, END in PAI was determined by multiple factors, distinguishing it from previous research. The differences between studies may be attributed to variations in study populations, the influence of different statistical methodologies, and the inclusion of diverse variables.
Initially, the END group exhibited dyslipidemia, characterized by higher levels of apoB, TC, and LDL-C compared to the clinically stable group. ApoB, an essential structural component of atherogenic lipoprotein particles such as LDL, lipoprotein, and triglyceride-rich lipoproteins, is acknowledged as a predictor of ischemic cerebrovascular events in patients with preexisting cardiovascular diseases (36). LDL-C, a commonly used clinical lipid marker for assessing lipid-associated risk, including ischemic stroke, has been linked to a reduced frequency of cardiovascular events at lower levels (37). Moreover, previous studies have shown a positive association between TC levels and ischemic stroke risk (38). However, the exact relationship between these lipids and the outcome of END is not yet fully understood. Elevated apoB levels may increase endothelial permeability to LDL, and there is a positive correlation between hypercholesterolemia and apoB generation within plaques. High apoB levels facilitate the penetration of particles into the arterial wall, leading to localized accumulation within the subendothelium. This process heightens the susceptibility to modifications in the artery wall, contributing to the onset of atherosclerosis and plaque progression. Thus, this study suggests that high levels of apoB, TC, and LDL-C, particularly apoB, are linked to END in PAI patients. Previous studies have revealed that a high baseline level of apoB correlates with an increased risk of major adverse cardiovascular events in acute coronary syndrome (39). This study observed lower BUN levels in the END group, with reduced BUN levels correlating with an increased risk of developing END, aligning with previous research (40), which suggested that lower BUN levels were observed in patients with progressive infarction in the anterior circulation and small subcortical infarction.
Previous studies have reported that END is more frequently observed in patients with BAD (41), a trend also evident in our study, suggesting an association between BAD-related PAI and the development of END. We also found that the proportion of maximum axial infarct diameters of < 15 mm was lower in the END group than in the clinically stable group. This finding implies that smaller infarct diameters (< 15 mm), typically linked to LI, are negatively correlated with the occurrence of END. The infarction location significantly influences functional limitations, clinical progression, and patient outcomes (42). Previous studies have indicated that infarct locations within the brainstem, corona radiata, and lenticulostriate artery area, including the internal capsule, are associated with an increased risk of END (4, 43–45). In our study, lesions in the basal ganglia (excluding the internal capsule) and thalamus were identified as predictors of END, with the former located in the lenticulostriate artery area, aligning with previous studies, and the latter showing comparatively favorable outcomes in terms of mortality and permanent motor deficits.
In the management of acute ischemic stroke, antiplatelet therapy is a fundamental therapeutic strategy. Several studies have indicated that DAPT reduces the risk of END (17, 46, 47). In our study, the utilization of antiplatelet therapy in the END group was less frequent than in the clinically stable group. However, our findings suggest that DAPT does not show a clear advantage over SAPT in preventing END. Moreover, we observed that combining argatroban with antiplatelet therapy was associated with a decreased risk of END in patients with PAI, consistent with previous research (48). The contribution of the AF and posterior choroidal artery to the model was found to be minimal.
Our analysis demonstrated that ML models, particularly the GBDT algorithm, showed promising outcomes in predicting END in PAI patients. GBDT, a sophisticated ML algorithm, integrates multiple decision trees to develop a more accurate and robust model. This algorithm effectively handles both continuous and categorical variables, shows a lower susceptibility to overfitting compared to more complex models, and adeptly manages missing data. Considering the inherent multivariate heterogeneity and noise in clinical research data, such as demographic information, laboratory findings, and radiological results available upon hospital arrival, it is critical to choose variables based on prior knowledge. Consequently, we used recursive feature elimination with cross-validation (RFECV) to select 13 predictors for the model, enhancing prediction accuracy.
A strength of this study is that the model performance and clinical interpretability were ensured by using the SHAP algorithm, which was effectively presented to users through easy-to-use visualization tools. Clinicians could better understand the model's decision-making process, thus facilitating the clinical application of prediction results. In addition, our ML model for interpreting predictions was based on a large number of variables, including demographics and laboratory/radiological data obtained from real-world clinical situations at hospital admission. Finally, we demonstrated the potential of interpretable machine learning methods for predicting END in PAI patients and personalizing these predictions within patient populations.
The limitations of our study are as follows: First, the data used in this study is retrospective in nature and sourced from a single center. The retrospective nature of the data may have introduced recall and selection biases to varying degrees. Therefore, it is necessary to use more datasets and conduct prospective multicenter clinical trials to further verify the results and enhance the model's accuracy. Second, we only performed internal validation for dataset validation, but external validation is needed to assess the robustness of the ML model further. Third, missing values were handled using mean interpolation, which inevitably introduces a degree of bias. However, if missing values are removed, some selection bias cannot be completely avoided. Fourth, the exclusion of omics data from the study may potentially limit the predictive performance to some extent.
5 ConclusionWe have demonstrated that seven ML models, particularly the GBDT model, can accurately predict END in PAI patients. However, further research with a larger cohort is essential to validating the model's accuracy. Additionally, the predictive efficacy of this model merits exploration in prospective clinical studies.
Data availability statementThe original contributions presented in the study are included in the article/Supplementary material, further inquiries can be directed to the corresponding authors.
Ethics statementThe studies involving humans were approved by the Ethics Committee of the Jincheng People's Hospital. The studies were conducted in accordance with the local legislation and institutional requirements. Written informed consent from the patients/participants or patients/participants' legal guardian/next of kin was not required to participate in this study in accordance with the national legislation and the institutional requirements.
Author contributionsWL: Conceptualization, Data curation, Formal analysis, Funding acquisition, Investigation, Methodology, Project administration, Resources, Software, Supervision, Validation, Visualization, Writing – original draft, Writing – review & editing. LJ: Writing – review & editing. LX: Writing – review & editing. FY: Writing – review & editing. ZG: Writing – review & editing. JL: Writing – review & editing. DZ: Writing – review & editing, Data curation. YL: Data curation, Writing – review & editing. HX: Data curation, Writing – review & editing. HC: Writing – review & editing, Formal analysis. JH: Writing – review & editing. SL: Writing – review & editing. HL: Formal analysis, Writing – review & editing.
FundingThe author (s) declare that no financial support was received for the research, authorship, and/or publication of this article.
Conflict of interestThe authors declare that the research was conducted in the absence of any commercial or financial relationships that could be construed as a potential conflict of interest.
Publisher's noteAll claims expressed in this article are solely those of the authors and do not necessarily represent those of their affiliated organizations, or those of the publisher, the editors and the reviewers. Any product that may be evaluated in this article, or claim that may be made by its manufacturer, is not guaranteed or endorsed by the publisher.
Supplementary materialThe Supplementary Material for this article can be found online at: https://www.frontiersin.org/articles/10.3389/fneur.2024.1368902/full#supplementary-material
References1. Liao X, Feng S, Wang Y, Pan Y, Chen W, Qu H, et al. Tirofiban combined with aspirin in the treatment of acute penetrating artery territory infarction (STRATEGY): protocol for a multicentre, randomised controlled trial. Stroke Vasc Neurol. (2023) 9:75–81. doi: 10.1136/svn-2022-002284
PubMed Abstract | Crossref Full Text | Google Scholar
2. Yaghi S, Raz E, Yang D, Cutting S, Mac Grory B, Elkind MS, et al. Lacunar stroke: mechanisms and therapeutic implications. J Neurol Neurosurg Psychiatry. (2021) jnnp-2021-326308. doi: 10.1136/jnnp-2021-326308
PubMed Abstract | Crossref Full Text | Google Scholar
3. Nah H-W, Kang D-W, Kwon SU, Kim JS. Diversity of single small subcortical infarctions according to infarct location and parent artery disease: analysis of indicators for small vessel disease and atherosclerosis. Stroke. (2010) 41:2822–7. doi: 10.1161/STROKEAHA.110.599464
PubMed Abstract | Crossref Full Text | Google Scholar
4. Jin D, Yang J, Zhu H, Wu Y, Liu H, Wang Q, et al. Risk factors for early neurologic deterioration in single small subcortical infarction without carrier artery stenosis: predictors at the early stage. BMC Neurol. (2023) 23:83. doi: 10.1186/s12883-023-03128-3
PubMed Abstract | Crossref Full Text | Google Scholar
6. Regenhardt RW, Das AS, Lo EH, Caplan LR. Advances in understanding the pathophysiology of lacunar stroke: a review. JAMA Neurol. (2018) 75:1273–81. doi: 10.1001/jamaneurol.2018.1073
PubMed Abstract | Crossref Full Text | Google Scholar
7. Jeong H-G, Kim BJ, Yang MH, Han M-K, Bae H-J. Neuroimaging markers for early neurologic deterioration in single small subcortical infarction. Stroke. (2015) 46:687–91. doi: 10.1161/STROKEAHA.114.007466
PubMed Abstract | Crossref Full Text | Google Scholar
8. Jiang J, Huang X, Zhang Y, Deng W, Shen F, Liu J. Total MRI burden of cerebral vessel disease correlates with the progression in patients with acute single small subcortical strokes. Brain Behav. (2019) 9:e01173. doi: 10.1002/brb3.1173
PubMed Abstract | Crossref Full Text | Google Scholar
9. Nam K-W, Kwon H-M, Lee Y-S. Different predictive factors for early neurological deterioration based on the location of single subcortical infarction: early prognosis in single subcortical infarction. Stroke. (2021) 52:3191–8. doi: 10.1161/STROKEAHA.120.032966
PubMed Abstract | Crossref Full Text | Google Scholar
10. Han X-J. Relationship between lesion patterns of single small infarct and early neurological deterioration in the perforating territory. Eur Rev Med Pharmacol Sci. (2017) 21:3642–8.
11. Helleberg BH, Ellekjaer H, Indredavik B. Outcomes after early neurological deterioration and transitory deterioration in acute ischemic stroke patients. Cerebrovasc Dis. (2016) 42:378–86. doi: 10.1159/000447130
PubMed Abstract | Crossref Full Text | Google Scholar
12. Chen SD, You J, Yang XM, Gu HQ, Huang XY, Liu H, et al. Machine learning is an effective method to predict the 90-day prognosis of patients with transient ischemic attack and minor stroke. BMC Med Res Methodol. (2022) 22:195. doi: 10.1186/s12874-022-01672-z
PubMed Abstract | Crossref Full Text | Google Scholar
14. Heo J, Yoon JG, Park H, Kim YD, Nam HS, Heo JH. Machine learning-based model for prediction of outcomes in acute stroke. Stroke. (2019) 50:1263–5. doi: 10.1161/STROKEAHA.118.024293
PubMed Abstract | Crossref Full Text | Google Scholar
15. Kim S-H, Jeon E-T, Yu S, Oh K, Kim CK, Song T-J, et al. Interpretable machine learning for early neurological deterioration prediction in atrial fibrillation-related stroke. Sci Rep. (2021) 11:20610. doi: 10.1038/s41598-021-99920-7
PubMed Abstract | Crossref Full Text | Google Scholar
16. Wardlaw JM, Smith EE, Biessels GJ, Cordonnier C, Fazekas F, Frayne R, et al. Neuroimaging standards for research into small vessel disease and its contribution to ageing and neurodegeneration. Lancet Neurol. (2013) 12:822–38. doi: 10.1016/S1474-4422(13)70124-8
PubMed Abstract | Crossref Full Text | Google Scholar
17. Vynckier J, Maamari B, Grunder L, Goeldlin MB, Meinel TR, Kaesmacher J, et al. Early neurologic deterioration in lacunar stroke: clinical and imaging predictors and association with long-term outcome. Neurology. (2021) 97:e143746. doi: 10.1212/WNL.0000000000012661
PubMed Abstract | Crossref Full Text | Google Scholar
18. Petrone L, Nannoni S, Del Bene A, Palumbo V, Inzitari D. Branch atheromatous disease: a clinically meaningful, yet unproven concept. Cerebrovasc Dis. (2016) 41:87–95. doi: 10.1159/000442577
PubMed Abstract | Crossref Full Text | Google Scholar
19. van Leijsen EMC, van Uden IWM, Ghafoorian M, Bergkamp MI, Lohner V, Kooijmans ECM, et al. Nonlinear temporal dynamics of cerebral small vessel disease. Neurology. (2017) 89:1569–77. doi: 10.1212/WNL.0000000000004490
PubMed Abstract | Crossref Full Text | Google Scholar
20. Nusinovici S, Tham YC, Chak Yan MY, Wei Ting DS Li J, Sabanayagam C, Wong TY, et al. Logistic regression was as good as machine learning for predicting major chronic diseases. J Clin Epidemiol. (2020) 122:56–69. doi: 10.1016/j.jclinepi.2020.03.002
PubMed Abstract | Crossref Full Text | Google Scholar
21. Yang L, Wu H, Jin X, Zheng P, Hu S, Xu X, et al. Study of cardiovascular disease prediction model based on random forest in eastern China. Sci Rep. (2020) 10:5245. doi: 10.1038/s41598-020-62133-5
PubMed Abstract | Crossref Full Text | Google Scholar
22. Zheng Z, Yang Y. Adaptive boosting for domain adaptation: toward robust predictions in scene segmentation. IEEE Trans Image Process. (2022) 31:5371–82. doi: 10.1109/TIP.2022.3195642
PubMed Abstract | Crossref Full Text | Google Scholar
23. Seto H, Oyama A, Kitora S, Toki H, Yamamoto R, Kotoku J, et al. Gradient boosting decision tree becomes more reliable than logistic regression in predicting probability for diabetes with big data. Sci Rep. (2022) 12:15889. doi: 10.1038/s41598-022-20149-z
PubMed Abstract | Crossref Full Text | Google Scholar
24. Velichko A, Huyut MT, Belyaev M, Izotov Y, Korzun D. Machine learning sensors for diagnosis of COVID-19 disease using routine blood values for internet of things application. Sensors.(2022) 22:7886. doi: 10.3390/s22207886
PubMed Abstract | Crossref Full Text | Google Scholar
26. Chen T, Guestrin C. XGBoost: a scalable tree boosting system: In: KDD '16: Proceedings of the 22nd ACM SIGKDD International Conference on Knowledge Discovery and Data Mining. ACM (2016). doi: 10.1145/2939672.2939785
留言 (0)