

記住我
Tuberculosis is one of the most deadly infectious diseases in the world, and about one-quarter of the world’s population has been infected with Mycobacterium tuberculosis (Wilkins et al., 2022). According to the latest World Health Organization (WHO) report, there were approximately 10.6 million new cases and 1.3 million deaths worldwide in 2022 (Mi et al., 2024). The incidence and mortality of tuberculosis are still high worldwide, although its prevention and treatment have cost a lot (Drain et al., 2018; Huang et al., 2019). The main reason is the long-term incubation of tuberculosis and the delay in the emergence of new and effective anti-tuberculosis drugs (Venketaraman et al., 2015; Cole, 2016). Therefore, the research on new drug targets for tuberculosis is the focus of developing anti-tuberculosis drugs (Gashaw et al., 2011).
Drug targets refer to the binding sites of drugs in vivo, including biological macromolecules such as gene sites, receptors, enzymes, ion channels and nucleic acids. The key to modern new drug research and development is first to find, determine and prepare drug screening targets (Eder and Herrling, 2016). Transcription factors are important molecules that control gene expression and the convergence point of multiple signal pathways in eukaryotic cells, and play an important role in the function of cells and the healthy development of the body (Vaquerizas et al., 2009; Papavassiliou and Papavassiliou, 2016). Transcription factors and their corresponding target genes construct a corresponding regulatory network, and the key factors in this regulatory network are the targets of drug action or clinical diagnosis. Therefore, new potential drug targets for tuberculosis can be explored by constructing a transcription factor regulatory network for tuberculosis.
In this study, differentially expressed genes were screened in tuberculosis patients and healthy people by using mRNA sequencing technology. The transcription factors of the differentially expressed genes were screened in the AnimalTFDB 3.0 database (Hu W. et al., 2019) to construct a regulatory network, then the key targets and their related pathways were further screened by MCODE cluster analysis and Kyoto Encyclopedia of Genes and Genomes (KEGG) pathway analysis (Kanehisa et al., 2017) and the pathogenesis of tuberculosis and its potential new drug targets were analyzed.
2 Materials and methods2.1 Data source and groupingThis study was approved by the Ethics Committee of Jilin Provincial Tuberculosis Hospital. In this study, 10 patients with pulmonary tuberculosis diagnosed in clinics were included (case group), and 10 healthy volunteers were taken as the normal control group (control group). After signing the written informed consent approved by the Ethics Committee of Jilin Provincial Tuberculosis Hospital, peripheral blood samples from the patients and volunteers were collected, and there were 10 sequencing samples in each group.
The sequences generated in the present study are available through the SRA Sequence Read Archive (https://www.ncbi.nlm.nih.gov/bioproject/PRJNA876021).
2.2 mRNA sequencingThe quality of total RNA extracted and purified from the whole blood samples was controlled by using Agilent Bioanalyzer 2100 (Agilent Technologies, United States). The RNA with RIN ≥ 7.0 was used in the study to ensure the construction of a high-quality downstream Total RNA-Seq library. The double-stranded cDNA was purified by using Agencourt AMpure XP magnetic beads. The concentration of cDNA in the library was quantified with an Invitrogen Qubit 3.0 Spectrophotometer (Thermo Fisher Scientific, United States) and the size distribution of library fragments was determined with an Agilent 2100 Bioanalyzer, and finally, the library was sequenced by 2 × 150 bp double-ended sequencing.
2.3 Construction of PPI networkThe differentially expressed genes were input into the STRING (https://string-db.org/) database (Szklarczyk et al., 2021), and the research species was selected as Homes sapiens and the free nodes were removed to construct a protein-protein interactions (PPI) network of the differentially expressed genes. The CytoNCA plug-in (Zhang et al., 2012) for the analysis of network centrality analysis in Cytoscape 3.9.1 was used to sort the PPI networks according to Degree.
2.4 Screening of transcription factorsThe differentially expressed genes were input into the AnimalTFDB 3.0 database (https://guolab.wchscu.cn/AnimalTFDB4//#/) (Tang et al., 2015), and the research species was selected as Homo sapiens, and the transcription factors with specific binding sites were selected as the research objects.
2.5 Construction of transcription factor regulatory networkTwenty transcription factors (TF) and 66 target genes were predicted to combine the total of 165 TF-to-target pairs (Supplementary Table S1). The relation obtained from the analysis of the differential co-expression was mapped to the human transcription factors and target gene pairs to obtain transcription regulation pairs. Finally, Cytoscape3.9.1 software was used for plotting.
2.6 MCODE cluster analysisMCODE, a density-based algorithm for multi-component protein complexes, can grasp the correlation between targets as a whole, and is considered to be a module division method with a lower entropy value compared with the direct screening of key targets by using the average value and medium centrality (Bader and Hogue, 2003). The transcription factor regulatory network was imported into Cytoscape 3.9.1 software, and the MCODE plug-in was used to further screen the possible drug targets of tuberculosis and its diagnostic targets.
2.7 GO function annotation enrichment analysis and KEGG pathway enrichment analysisDAVID (Database for Annotation Visualization and Integrated Discovery) database (Dennis et al., 2003) was used for the Gene Ontology (GO) function annotation enrichment analysis and Kyoto Encyclopedia of Genes and Genomes (KEGG) pathway analysis (Kanehisa et al., 2017) on the screened differential genes. According to the GO significance reflected by the differentially expressed genes (p < 0.05), the differentially expressed genes were further analyzed from the functional perspective.
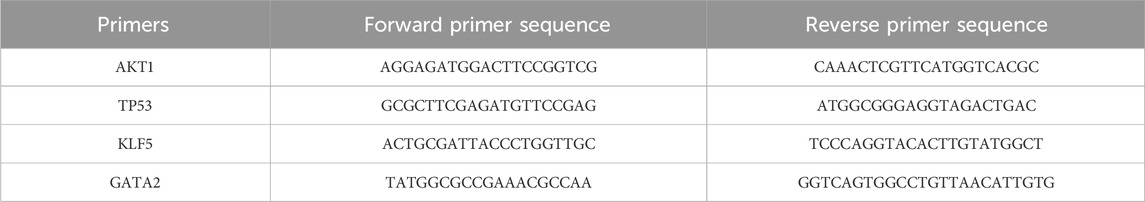
2.8 RT-qPCR verificationTotal RNA of peripheral blood samples was extracted by the TRIzol (Life Technologies) method according to manufacturer’s instructions. The RNA will then be transcribed into cDNA. The RT-qPCR program is set as follows: Keep at 95°C for 30 s; Denatured 95°C 15 s and anneal or extend at 60°C 1 min in 40 cycles. Primers are shown in Table 1.
Table 1. Primers for RT-qPCR.
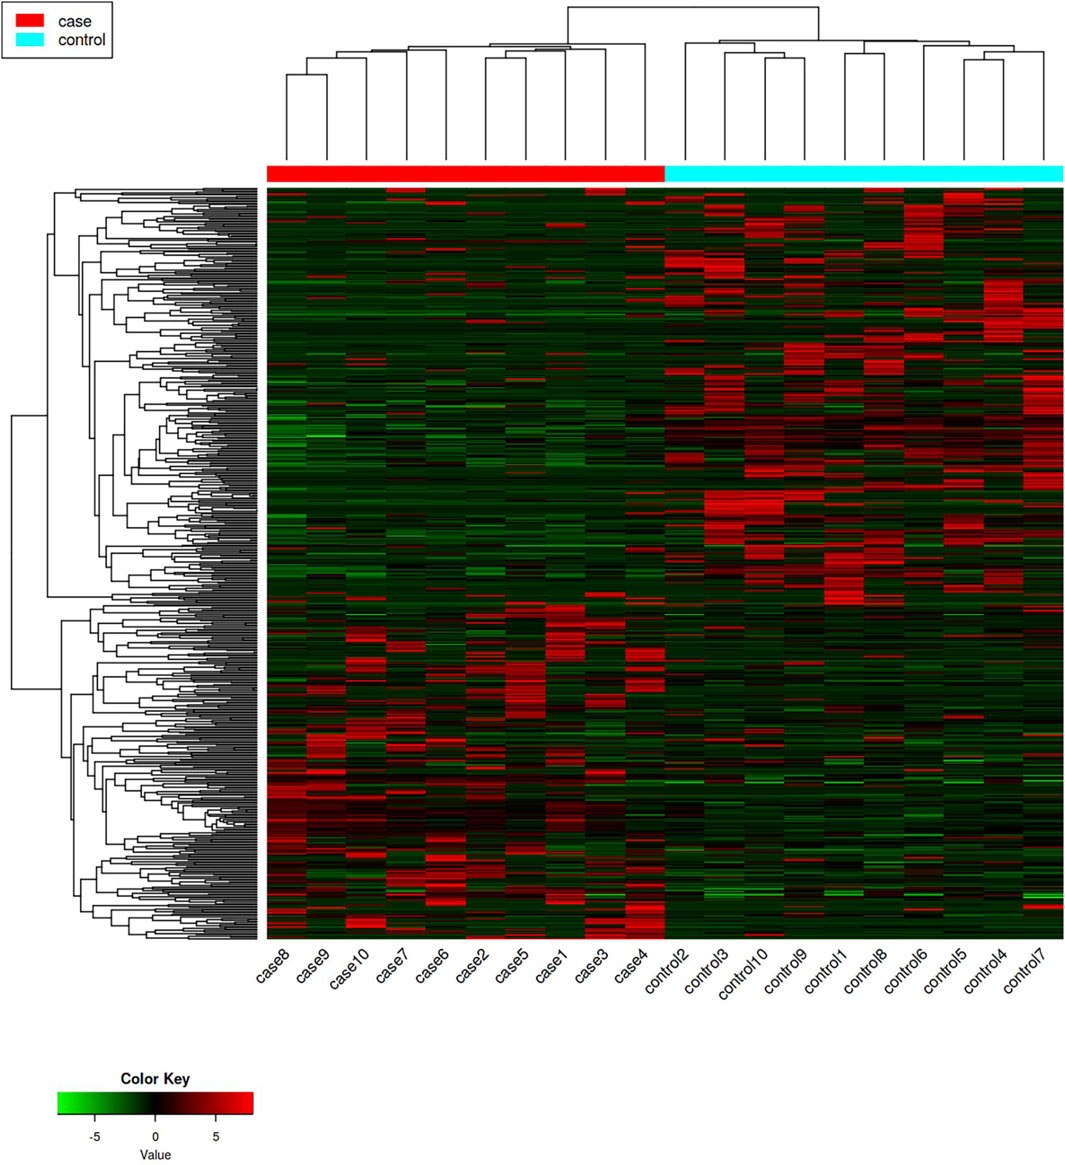
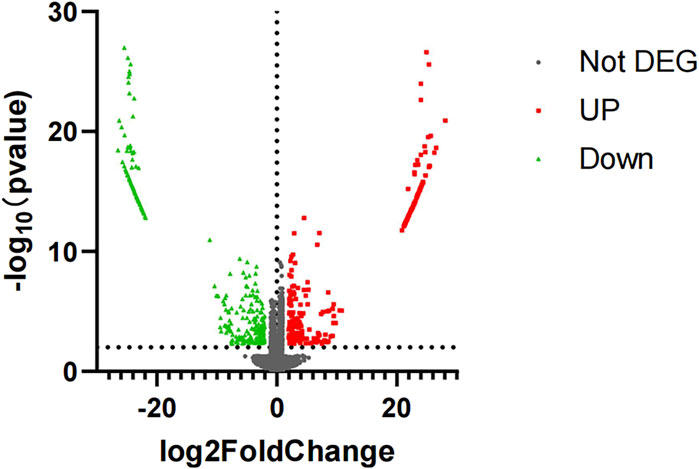
3 Results3.1 Screened differentially expressed genesDifferentially expressed genes in the case group and control group were screened with p-value < 0.005 and |log2 (fold change)| ≥ 2 as conditions, in which 556 differentially expressed genes were screened out (Supplementary Table S2), including 256 upregulated differentially expressed genes and 300 downregulated differentially expressed genes (Figures 1, 2).
Figure 1. Hotspot map of mRNA sequencing results. The red represents upregulated differentially expressed genes, and the green represents downregulated differentially expressed genes.
Figure 2. Volcano plot of mRNA sequencing. The red represents upregulated differentially expressed genes, and the green represents downregulated differentially expressed genes.
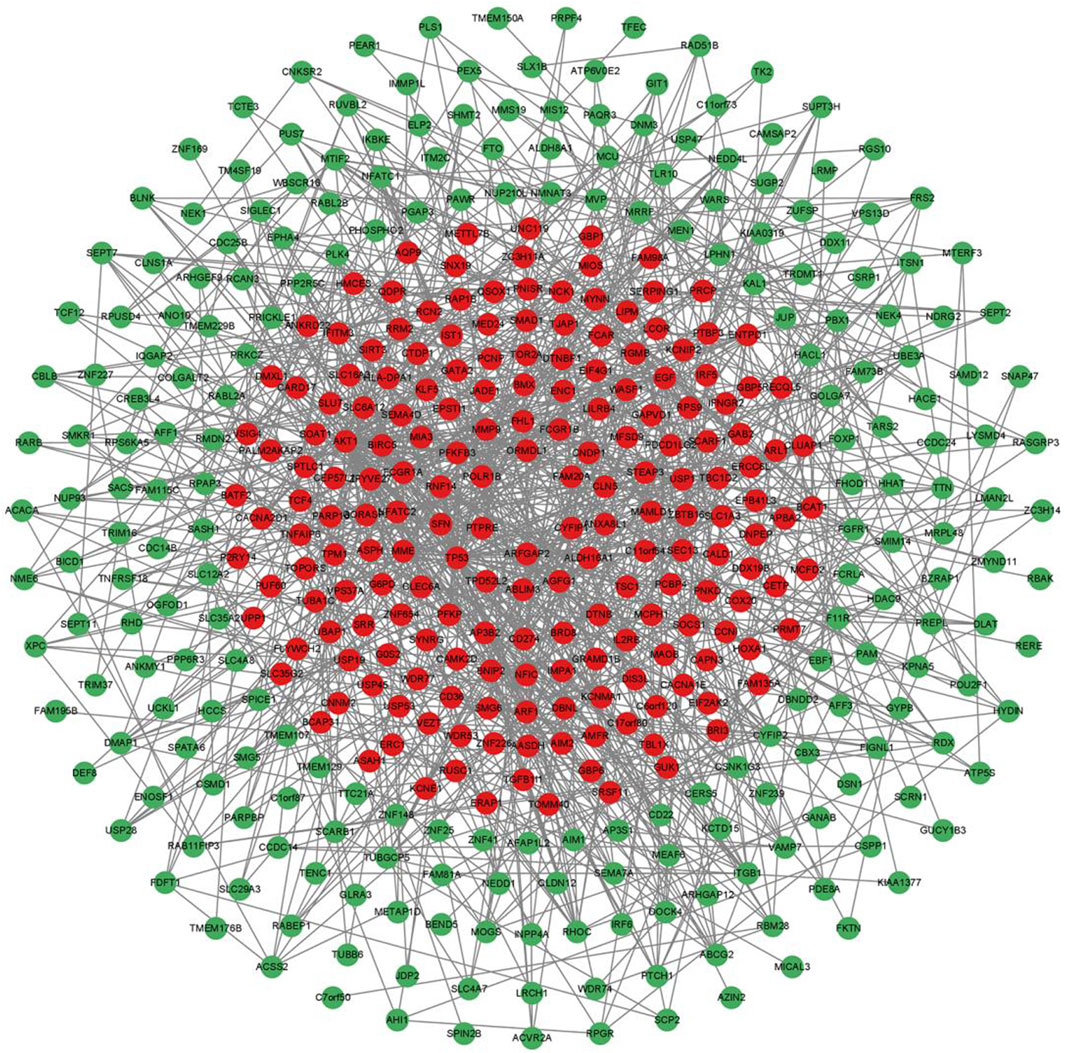
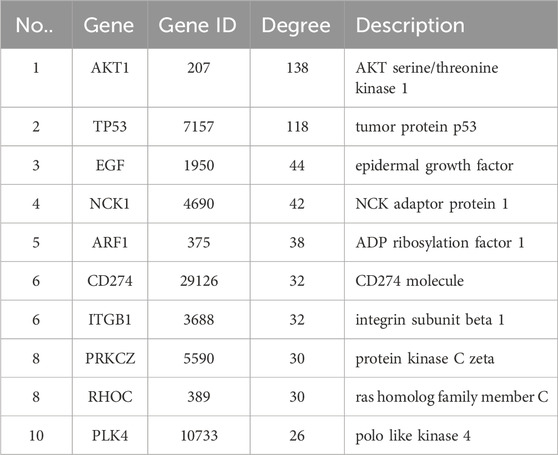
3.2 Construction of PPI regulatory network of differentially expressed genesWe imported 556 differentially expressed genes into the STING database, then the free nodes deviating from the main network were removed, and finally the PPI regulatory network of 430 important genes was obtained (Figure 3). They were ranked according to Degree (Yang et al., 2019), and the top 10 important genes were AKT1, TP53, EGF, NCK1, ARF1, CD274, ITGB1, PRKCZ, RHOC, and PLK4 (Table 2).
Figure 3. PPI regulation network of 430 important differentially expressed genes. The green nodes are the downregulated expressed genes, and the red nodes are the upregulated expressed genes.
Table 2. Differentially expressed genes in the top 10 order of Degree in the PPI regulatory network.
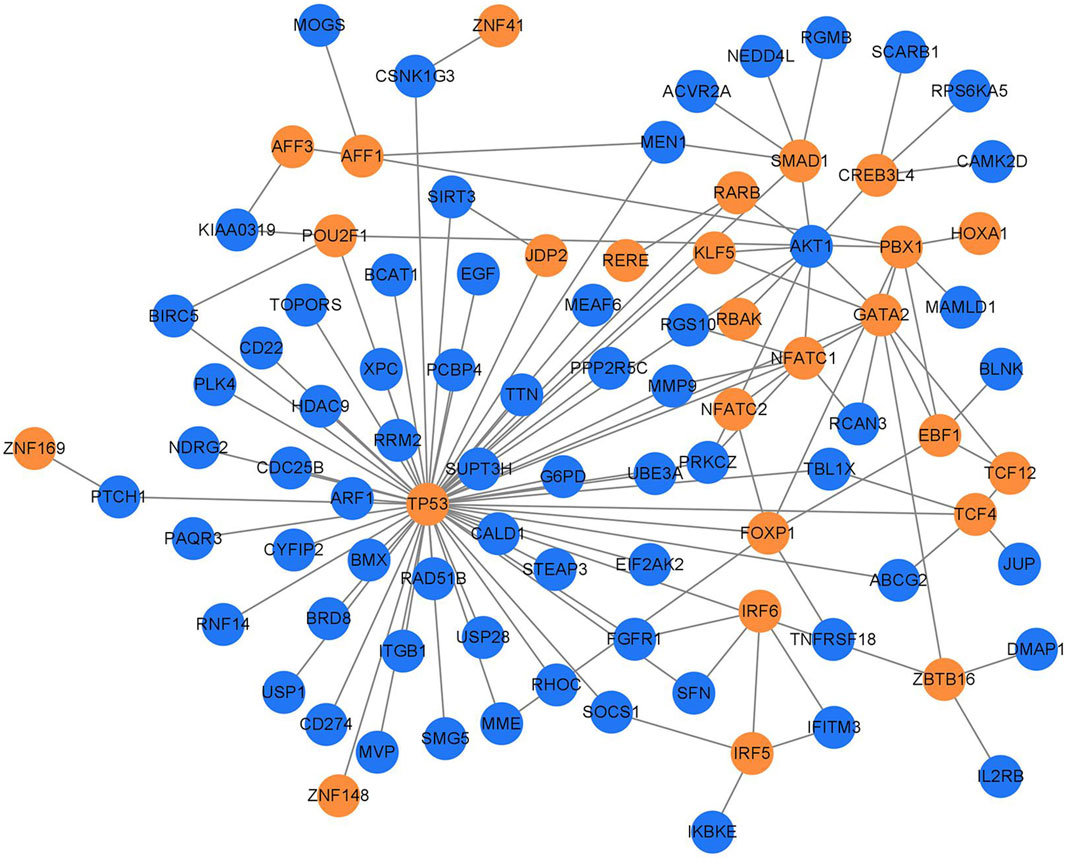
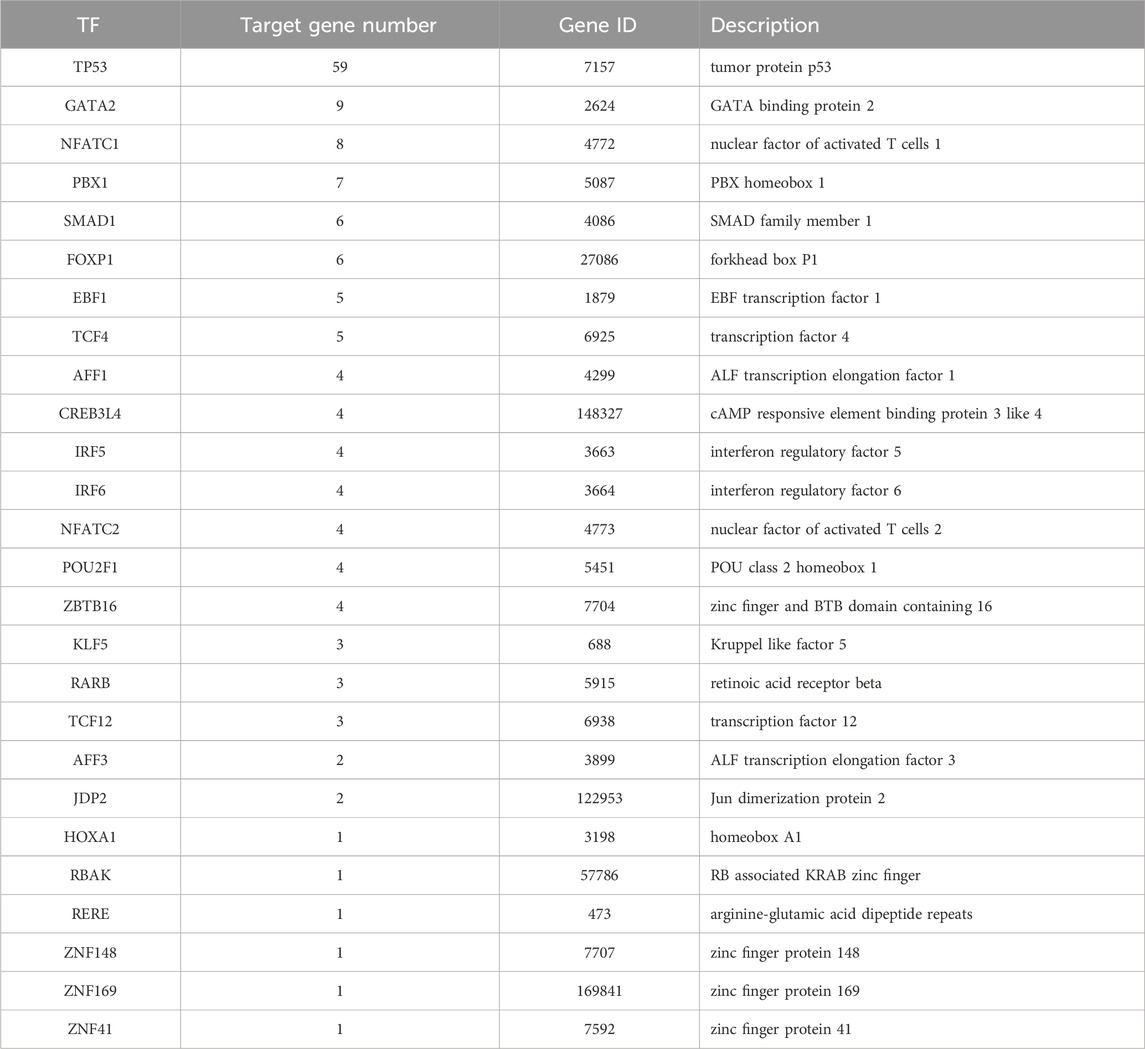
3.3 Transcription factor regulatory network diagramTranscription factors of 430 important genes in the PPI regulatory network were screened in the AnimalTFDB 3.0 database, and 26 transcription factors and 66 target genes regulated by them were screened out (Figure 4; Table 3).
Figure 4. TB transcription factor regulatory network. The yellow circles represent the transcription factors, and the blue circles represent the regulated target genes.
Table 3. 26 Transcription factors.
It was found in the transcription factor regulation network (Figure 4) that 10 target genes were regulated by more than 2 transcription factors (Table 4), among which TP53, AKT1, GATA2, and PBX1 were the targets regulated by the most transcription factors, 11, 9, 7, and 6 transcription factors, respectively.
Table 4. Genes regulated by transcription factors.
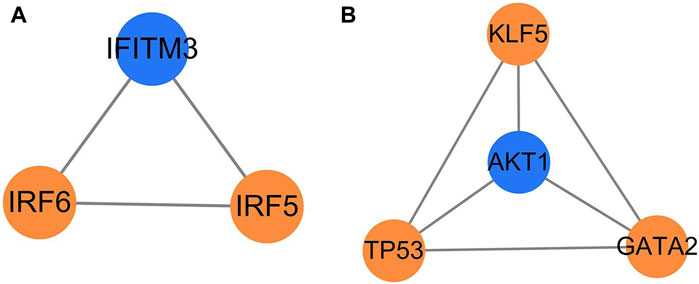
3.4 Key factors screened by MCODE cluster analysisThe MCODE cluster analysis on 26 transcription factors and 66 target genes regulated by them in the transcription factor regulatory network was also performed with the plug-in in Cytoscape 3.9.1 software, and two core regulatory sub-networks were obtained (Figures 5A, B). The core regulatory sub-network with the highest score (score = 4) was selected for research (Figure 5B), and four key factors (AKT1, TP53, KLF5, and GATA2) were obtained, of which TP53, GATA2, and KLF5 were the key transcription factors, and AKT1 was the key target gene regulated by transcription factors.
Figure 5. Core regulation sub-network. The yellow represents the transcription factors, and the blue represents the target genes; (A) score = 3 and (B) score = 4.
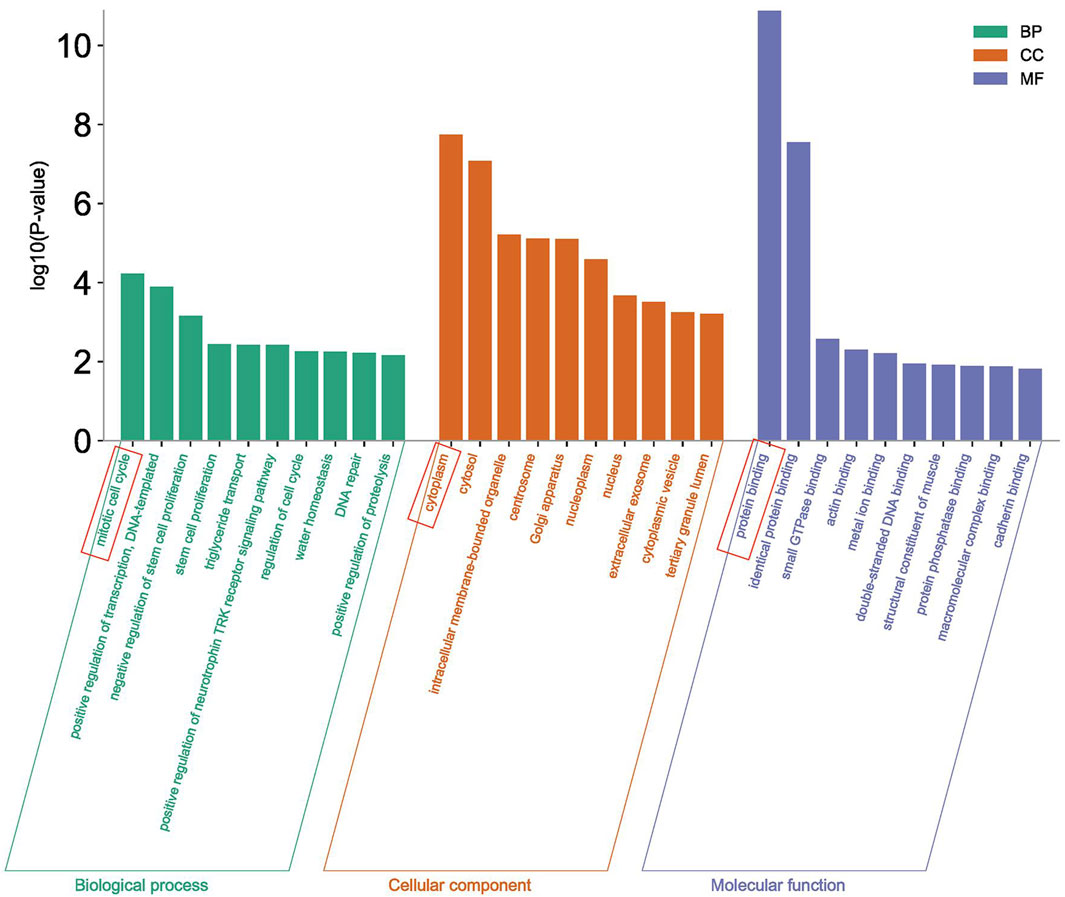
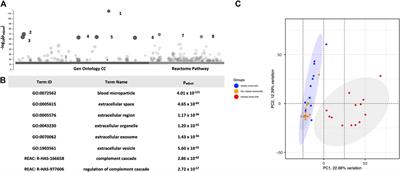
3.5 GO cluster analysisThe Gene Ontology analysis of 430 differentially expressed genes was performed in the DAVID database, and a total of 222 items were obtained. Among them, 121 items were related to Biological Process (BP), of which the item with the highest p-value significance was the mitotic cell cycle, 61 items were related to the Cellular Component (CC), of which the item with the highest p-value significance was cytoplasm, and 40 items were related to Molecular Function (MF), of which the item with the highest p-value significance was protein binding (Figure 6).
Figure 6. GO enrichment analysis.
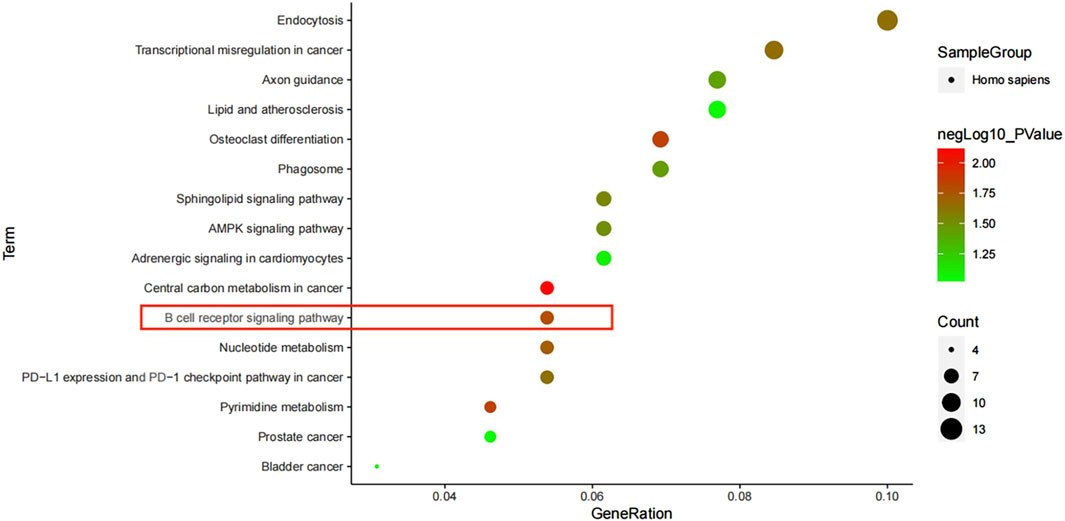
3.6 KEGG channel analysisWe analyzed 430 differentially expressed genes in the KEGG database and obtained 16 signal pathways (p < 0.05), mainly related to immunity and cancer. Among them, the most significant pathway was the central carbon metabolism in cancer, and there were three signal pathways (B cell receiver signaling pathway, Sphingolipid signaling pathway and AMPK signaling pathway), of which B cell receiver signaling pathway was the most significant signal pathway, mainly related to immunity (Figure 7).
Figure 7. KEGG pathway enrichment analysis.
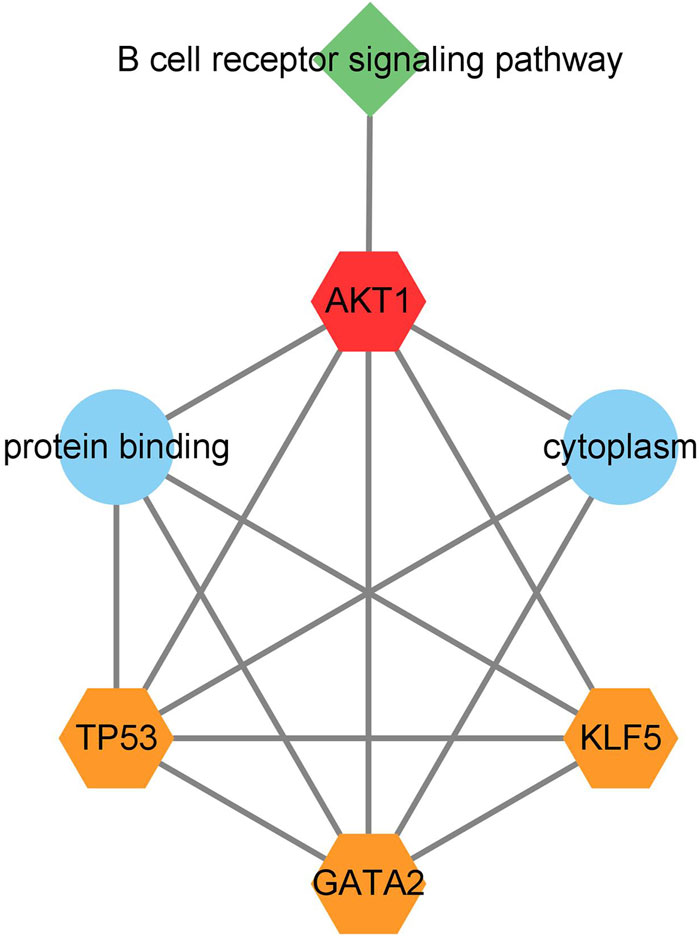
3.7 Construction of functional relationship network diagram of key genesA network diagram of the relationship between network nodes (Figure 8) was constructed by combining the three key transcription factors (TP53, GATA2, and KLF5), one key gene (AKT1) and the related pathway (B cell receiver signaling pathway) previously screened. It was found in the network diagram of the relationship between network nodes that AKT1, TP53, KLF5, and GATA2 were all related to the protein binding function, and AKT1, TP53 and GATA2 were also related to the cytoplasm function. The target gene AKT1 mainly played a regulatory role in the immune-related pathway B cell receiver signaling pathway, so it was inferred that M. tuberculosis may activate the expression of the AKT1 gene by regulating the transcription factors TP53, KLF5 and GATA2, thus leading to the infection and invasion of M. tuberculosis through B cell receiver signaling pathway.
Figure 8. Network diagram of the relationship between network nodes. The orange pentagons represent transcription factors, the red pentagons represent target genes regulated by transcription factors, the blue circles represent Gene Ontology, and the green quadrangles represent the B cell receptor signaling path.
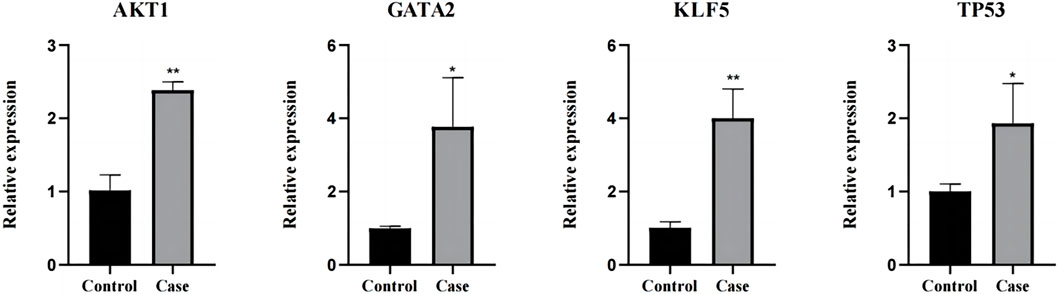
3.8 RT-qPCR verification experimentThe four key factors (AKT1, TP53, KLF5, and GATA2) screened were verified by RT-PCR. AKT1, TP53, KLF5, and GATA2 were all upregulated genes, and the results of RT-PCR experiment were consistent with the results of mRNA sequencing (Figure 9).
Figure 9. The results were verified by RT-qPCR. *: p < 0.05, **: p < 0.01.
4 DiscussionIn recent years, tuberculosis has made a comeback, with a significant rise in its incidence and mortality, and the resistance of M. tuberculosis to anti-tuberculosis drugs commonly used at present has become increasingly serious, which has become a thorny problem in the clinical treatment of tuberculosis (Suárez et al., 2019; Olivença et al., 2022). In the past 30 years, no new and efficient anti-tuberculosis drugs have been developed. Therefore, it is urgent to find potential targets of new anti-tuberculosis drugs for studying and developing new anti-tuberculosis drugs to achieve effective control of tuberculosis (Rode et al., 2019). In this study, 556 differentially expressed genes were screened out by mRNA sequencing, and 430 important differentially expressed genes were identified by constructing a PPI regulatory network and removing free genes. Twenty-six transcription factors and 66 target genes regulated by them were identified from 430 important differentially expressed genes through the AnimalTFDB 3.0 database.
A transcription factor regulatory network of 26 transcription factors and 66 target genes regulated by them was constructed. It was found by the analysis of the transcription factor regulatory network that the target genes corresponding to TP53 were the most common (59), and its Degree value ranked second in the PPI regulatory network. TP53 is the coding gene of the tumor suppressor gene p53 protein, located on human chromosome 17 (Hu H. et al., 2019). TP53 wild-type mutation will lead to apoptosis of cancer cells, while TP53 mutant will increase the risk of cancer, so that the mutation status of TP53 may be a biomarker to predict the response of different cancer types to cancer immunotherapy (Li et al., 2020). In addition, some studies have pointed out that TP53 can regulate human immune function and affect the host immune system (Yuan et al., 2018). GATA2 is the second most common transcription factor (9), corresponding to the target gene. GATA2 is a zinc-finger transcription factor expressed in human hematopoietic stem cells and various hematopoietic progenitor cells (Oleaga-Quintas et al., 2021). There are also many target genes corresponding to the transcription factor GATA2 (9), and the GATA2 gene is believed to regulate the ontogeny and function of monocytes, macrophages, dendritic cells, B cells and NK cells (Yuag et al., 2017; Monif et al., 2018). Therefore, we find that both TP53 and GATA2 are closely related to the body’s immune system.
The analysis of target genes regulated by transcription factors showed that TP53, AKT1, GATA2 and PBX1 were the four target genes most regulated by transcription factors, regulating 11, 9, 7 and 6 target genes, respectively. Our previous study has shown that genes TP53 and GATA2 are very important transcription factors and are closely related to immune function. AKT1 is a serine/threonine protein kinase, also known as Akt kinase. Akt can regulate the development and function of innate immune cells such as neutrophils, macrophages and dendritic cells, which play an important role in the regulation of immune cells (Xia et al., 2020). AKT1 plays a key role in the process of controlling the growth of M. tuberculosis cells and is a key kinase involved in controlling the growth of M. tuberculosis cells. AKT1 inhibitors have the potential to be used as antibiotics to treat tuberculosis (Wang et al., 2010). The PBX1 gene promotes the early development of NK cells by directly up-regulating the expression of Nfil3 (Xu et al., 2020). PBX1 is required to maintain the self-renewal of hematopoietic stem cells during the development of the immune system. PBX1 deficient embryonic stem cells cannot produce lymphoid progenitor cells, leading to the loss of B and NK cells as well as the impaired development of T cells (Niu et al., 2017; Gu et al., 2023). Therefore, these four target genes that are most regulated by transcription factors are also closely related to the immune function of the body.
Through MCODE cluster analysis, a core sub-network of the transcription factor regulatory network was constructed, and four important nodes, AKT1, TP53, KLF5, and GATA2 were screened out. As described above, AKT1 is an important gene regulated by transcription factors, TP53 and GATA2 are important transcription factors, and AKT1, TP53, and GATA2 are all related to the immune function of the body. The MCODE cluster analysis showed that transcription factor KLF5 was closely related to other key genes (Figure 5B) although it only regulated three target genes (Table 3). Some studies have shown that KLF5 plays an important role in the differential regulation of angiogenesis progress induced by M. tuberculosis, closely related to the pathogenesis of pulmonary tuberculosis, and the expression of the KLF5 gene has also been verified by immunofluorescence imaging in these studies (Mukherjee et al., 2022). It can be inferred that tuberculosis may activate the expression of the AKT1 gene by regulating the transcription factors TP53, KLF5, and GATA2, thus leading to the infection and invasion of M. tuberculosis.
The GO analysis and KEGG analysis of 430 important differentially expressed genes screened were also performed in this study. The GO analysis showed that the enrichment of the mitotic cell cycle was the most significant in the biological processes (BP), and it is well known that mitosis is an important process to maintain the normal growth and development of individuals. It has been indicated in some studies that the mitotic index of tuberculosis patients who have received treatment with anti-tuberculosis drugs will improve (Jaju et al., 1983). In the cell components (CC), the enrichment of cytoplasm was the most significant. The cytoplasm is the main place for metabolism and plays a regulatory role in the nucleus. In the molecular functions (MF), the enrichment of protein binding was the most significant. The GO enrichment analysis results suggest that M. tuberculosis may play a regulatory role in the nucleus by changing the function of the main metabolic sites, thus affecting the protein binding function.
In the KEGG pathway analysis of differential genes, we screened out 16 pathways, of which central carbon metabolism in cancer was the most significant. Tuberculosis and cancer are two diseases that tend to produce resistance to the host immune system, with certain similarities in the regulation of immune response (Bickett and Karam, 2020). B cell receiver signaling pathway is one of the most significant signal pathways, mainly related to immunity (Sun et al., 2020; Tanaka and Baba, 2020). The key gene AKT1 can regulate this pathway, and the gene AKT1 is one of the four key nodes we screened out. Therefore, the gene AKT1 is likely to be the key gene to activate the B cell receiver signaling pathway.
5 ConclusionFour key genes and a pathway closely related to tuberculosis were screened out by constructing the tuberculosis transcription factor network, of which TP53, KLF5, and GATA2 are transcription factors and AKT1 is the target gene. Mycobacterium tuberculosis may activate the expression of the AKT1 gene by regulating the transcription factors TP53, KLF5 and GATA2, thus leading to the infection and invasion of M. tuberculosis through the B cell receptor signaling pathway.
Data availability statementThe data presented in this study are deposited in the NIH SRA repository, accession number: PRJNA876021.
Ethics statementThe studies involving humans were approved by Jilin Provincial Tuberculosis Hospital Ethics Committee. The studies were conducted in accordance with the local legislation and institutional requirements. The human samples used in this study were acquired from Changchun Infectious Disease Hospital where the authors worked. Written informed consent for participation was obtained from the participants or the participants’ legal guardians/next of kin in accordance with the national legislation and institutional requirements.
Author contributionsSW: Writing–original draft. NY: Data curation, Writing–review and editing. YY: Writing–review and editing. LS: Investigation, Writing–review and editing. YH: Investigation, Writing–review and editing. JZ: Supervision, Writing–review and editing. GX: Supervision, Writing–review and editing.
FundingThe author(s) declare that financial support was received for the research, authorship, and/or publication of this article. This work was supported by National Natural Science Foundation of China (81973371), Jilin Provincial Department of Education Science and Technology Research Project (JJKH20220065KJ).
Conflict of interestThe authors declare that the research was conducted in the absence of any commercial or financial relationships that could be construed as a potential conflict of interest.
Publisher’s noteAll claims expressed in this article are solely those of the authors and do not necessarily represent those of their affiliated organizations, or those of the publisher, the editors and the reviewers. Any product that may be evaluated in this article, or claim that may be made by its manufacturer, is not guaranteed or endorsed by the publisher.
Supplementary materialThe Supplementary Material for this article can be found online at: https://www.frontiersin.org/articles/10.3389/fmolb.2024.1410445/full#supplementary-material
ReferencesDennis, G., Sherman, B. T., Hosack, D. A., Yang, J., Gao, W., Lane, H. C., et al. (2003). DAVID: database for annotation, visualization, and integrated Discovery. Genome Biol. 4 (5), R60. PMID: 12734009. doi:10.1186/gb-2003-4-9-r60
PubMed Abstract | CrossRef Full Text | Google Scholar
Drain, P. K., Bajema, K. L., Dowdy, D., Dheda, K., Naidoo, K., Schumacher, S. G., et al. (2018). Incipient and subclinical tuberculosis: a clinical review of early stages and progression of infection. Clin. Microbiol. Rev. 31 (4), 000211–e118. doi:10.1128/CMR.00021-18
CrossRef Full Text | Google Scholar
Gu, S., Zhang, J., Han, X., Ding, H., Yao, C., Ye, Z., et al. (2023). Involvement of transcriptional factor Pbx1 in peripheral B cell homeostasis to constrain lupus autoimmunity. Arthritis Rheumatol. 75 (8), 1381–1394. Epub 2023 Jun 4. PMID: 36862399. doi:10.1002/art.42487
PubMed Abstract | CrossRef Full Text | Google Scholar
Hu, H., Miao, Y. R., Jia, L. H., Yu, Q. Y., Zhang, Q., and Guo, A. Y. (2019a). AnimalTFDB 3.0: a comprehensive resource for annotation and prediction of animal transcription factors. Nucleic Acids Res. 47 (D1), D33–D38. doi:10.1093/nar/gky822
PubMed Abstract | CrossRef Full Text | Google Scholar
Hu, W., Chen, S., Thorne, R. F., and Wu, M. (2019b). TP53, TP53 target genes (DRAM, TIGAR), and autophagy. Adv. Exp. Med. Biol. 1206, 127–149. doi:10.1007/978-981-15-0602-4_6
PubMed Abstract | CrossRef Full Text | Google Scholar
Huang, L., Nazarova, E. V., and Russell, D. G. (2019). Mycobacterium tuberculosis: bacterial fitness within the host macrophage. Microbiol. Spectr. 7 (2), 10. doi:10.1128/microbiolspec.BAI-0001-2019
PubMed Abstract | CrossRef Full Text | Google Scholar
Jaju, M., Jaju, M., and Ahuja, Y. R. (1983). Further study on the cytogenetic effects of combined chemotherapy with isoniazid and para-aminosalicylic acid on human lymphocytes in vivo: sister chromatid exchanges, chromosome aberrations in first-division metaphases, cell growth kinetics, and mitotic index. Environ. Mutagen 5 (6), 847–857. doi:10.1002/em.2860050609
PubMed Abstract | CrossRef Full Text | Google Scholar
Kanehisa, M., Furumichi, M., Tanabe, M., Sato, Y., and Morishima, K. (2017). KEGG: new perspectives on genomes, pathways, diseases and drugs. Nucleic Acids Res. 45 (D1), D353–D361. doi:10.1093/nar/gkw1092
PubMed Abstract | CrossRef Full Text | Google Scholar
Mi, J., Liu, Y. P., Xue, Y., Sun, W. N., Liang, Y., Liang, J. Q., et al. (2024). The changes and its significance of peripheral blood NK cells in patients with tuberculous meningitis. Front. Microbiol. 15, 1344162. doi:10.3389/fmicb.2024.1344162
PubMed Abstract | CrossRef Full Text | Google Scholar
Monif, M., Huq, A., Chee, L., and Kilpatrick, T. (2018). MonoMac syndrome with associated neurological deficits and longitudinally extensive cord lesion. BMJ Case Rep. 2018, bcr2017222872. doi:10.1136/bcr-2017-222872
PubMed Abstract | CrossRef Full Text | Google Scholar
Mukherjee, T., Bhatt, B., Prakhar, P., Lohia, G. K., Rajmani, R. S., and Balaji, K. N. (2022). Epigenetic reader BRD4 supports mycobacterial pathogenesis by co-modulating host lipophagy and angiogenesis. Autophagy 18 (2), 391–408. doi:10.1080/15548627.2021.1936355
PubMed Abstract | CrossRef Full Text | Google Scholar
Niu, Y., Sengupta, M., Titov, A. A., Choi, S. C., and Morel, L. (2017). The PBX1 lupus susceptibility gene regulates CD44 expression. Mol. Immunol. 85, 148–154. doi:10.1016/j.molimm.2017.02.016
PubMed Abstract | CrossRef Full Text | Google Scholar
Oleaga-Quintas, C., de Oliveira-Júnior, E. B., Rosain, J., Rapaport, F., Deswarte, C., Guérin, A., et al. (2021). Inherited GATA2 deficiency is dominant by haploinsufficiency and displays incomplete clinical penetrance. J. Clin. Immunol. 41 (3), 639–657. doi:10.1007/s10875-020-00930-3
PubMed Abstract | CrossRef Full Text | Google Scholar
Olivença, F., Nunes, A., Macedo, R., Pires, D., Silveiro, C., Anes, E., et al. (2022). Uncovering beta-lactam susceptibility patterns in clinical isolates of Mycobacterium tuberculosis through whole-genome sequencing. Microbiol. Spectr. 10 (4), e0067422. doi:10.1128/spectrum.00674-22
PubMed Abstract | CrossRef Full Text | Google Scholar
Rode, H. B., Lade, D. M., Grée, R., Mainkar, P. S., and Chandrasekhar, S. (2019). Strategies towards the synthesis of anti-tuberculosis drugs. Org. Biomol. Chem. 17 (22), 5428–5459. doi:10.1039/c9ob00817a
PubMed Abstract | CrossRef Full Text | Google Scholar
Suárez, I., Fünger, S. M., Kröger, S., Rademacher, J., Fätkenheuer, G., and Rybniker, J. (2019). The diagnosis and treatment of tuberculosis. Dtsch. Arztebl Int. 116 (43), 729–735. PMID: 31755407. doi:10.3238/arztebl.2019.0729
PubMed Abstract | CrossRef Full Text | Google Scholar
Sun, L., Tu, J., Liu, C., Pan, A., Xia, X., and Chen, X. (2020). Analysis of lncRNA expression profiles by sequencing reveals that lnc-AL928768.3 and lnc-AC091493.1 are novel biomarkers for disease risk and activity of rheumatoid arthritis. Inflammopharmacology 28 (2), 437–450. Epub 2019 Nov 28. PMID: 31781981. doi:10.1007/s10787-019-00666-6
PubMed Abstract | CrossRef Full Text | Google Scholar
Szklarczyk, D., Gable, A. L., Nastou, K. C., Lyon, D., Kirsch, R., Pyysalo, S., et al. (2021). The STRING database in 2021: customizable protein-protein networks, and functional characterization of user-uploaded gene/measurement sets. Nucleic Acids Res. 49 (D1), D605–D612. doi:10.1093/nar/gkaa1074
PubMed Abstract | CrossRef Full Text | Google Scholar
Tang, Y., Li, M., Wang, J., Pan, Y., and Wu, F. X. (2015). CytoNCA: a cytoscape plugin for centrality analysis and evaluation of protein interaction networks. Biosystems 127, 67–72. doi:10.1016/j.biosystems.2014.11.005
PubMed Abstract | CrossRef Full Text | Google Scholar
Vaquerizas, J. M., Kummerfeld, S. K., Teichmann, S. A., and Luscombe, N. M. (2009). A census of human transcription factors: function, expression and evolution. Nat. Rev. Genet. 10 (4), 252–263. doi:10.1038/nrg2538
PubMed Abstract | CrossRef Full Text | Google Scholar
Wang, X., Cao, Z., Jiang, J., Zhu, Y., Dong, M., Tong, A., et al. (2010). AKT1 polymorphisms are associated with tuberculosis in the Chinese population. Int. J. Immunogenet 37 (2), 97–101. doi:10.1111/j.1744-313X.2010.00897.x
PubMed Abstract | CrossRef Full Text | Google Scholar
Wilkins, J. J., Svensson, E. M., Ernest, J. P., Savic, R. M., Simonsson, U. S. H., and McIlleron, H. (2022). Pharmacometrics in tuberculosis: progress and opportunities. Int. J. Antimicrob. Agents 60 (3), 106620. doi:10.1016/j.ijantimicag.2022.106620
PubMed Abstract | CrossRef Full Text | Google Scholar
Xia, Q. D., Xun, Y., Lu, J. L., Lu, Y. C., Yang, Y. Y., Zhou, P., et al. (2020). Network pharmacology and molecular docking analyses on Lianhua Qingwen capsule indicate Akt1 is a potential target to treat and prevent COVID-19. Cell Prolif. 53 (12), e12949. doi:10.1111/cpr.12949
PubMed Abstract | CrossRef Full Text | Google Scholar
Xu, X., Zhou, Y., Fu, B., Zhang, J., Dong, Z., Zhang, X., et al. (2020). PBX1 promotes development of natural killer cells by binding directly to the Nfil3 promoter. FASEB J. 34 (5), 6479–6492. doi:10.1096/fj.202000121R
PubMed Abstract | CrossRef Full Text | Google Scholar
Yang, L., Sun, H., Cao, Y., Xuan, B., Fan, Y., Sheng, H., et al. (2017). GATA2 inhibition sensitizes acute myeloid leukemia cells to chemotherapy. PLoS One 12 (1), e0170630. doi:10.1371/journal.pone.0170630
PubMed Abstract | CrossRef Full Text | Google Scholar
Yang, X., Li, Y., Lv, R., Qian, H., Chen, X., and Yang, C. F. (2019). Study on the multitarget mechanism and key active ingredients of herba siegesbeckiae and volatile oil against rheumatoid arthritis based on network pharmacology mechanism and key active ingredients of herba siegesbeckiae and volatile oil against rheumatoid arthritis based on network pharmacology. Evid. Based Complement. Altern. Med. 2019, 8957245. doi:10.1155/2019/8957245
CrossRef Full Text | Google Scholar
Yuan, G., Bai, Y., Zhang, Y., and Xu, G. (2018). Data mining Mycobacterium tuberculosis pathogenic gene transcription factors and their regulatory network nodes. Int. J. Genomics 2018, 3079730. doi:10.1155/2018/3079730
PubMed Abstract | CrossRef Full Text | Google Scholar
Zhang, H. M., Chen, H., Liu, W., Liu, H., Gong, J., Wang, H., et al. (2012). AnimalTFDB: a comprehensive animal transcription factor database. Nucleic Acids Res. 40 (Database issue), D144–D149. doi:10.1093/nar/gkr965
留言 (0)