
記住我

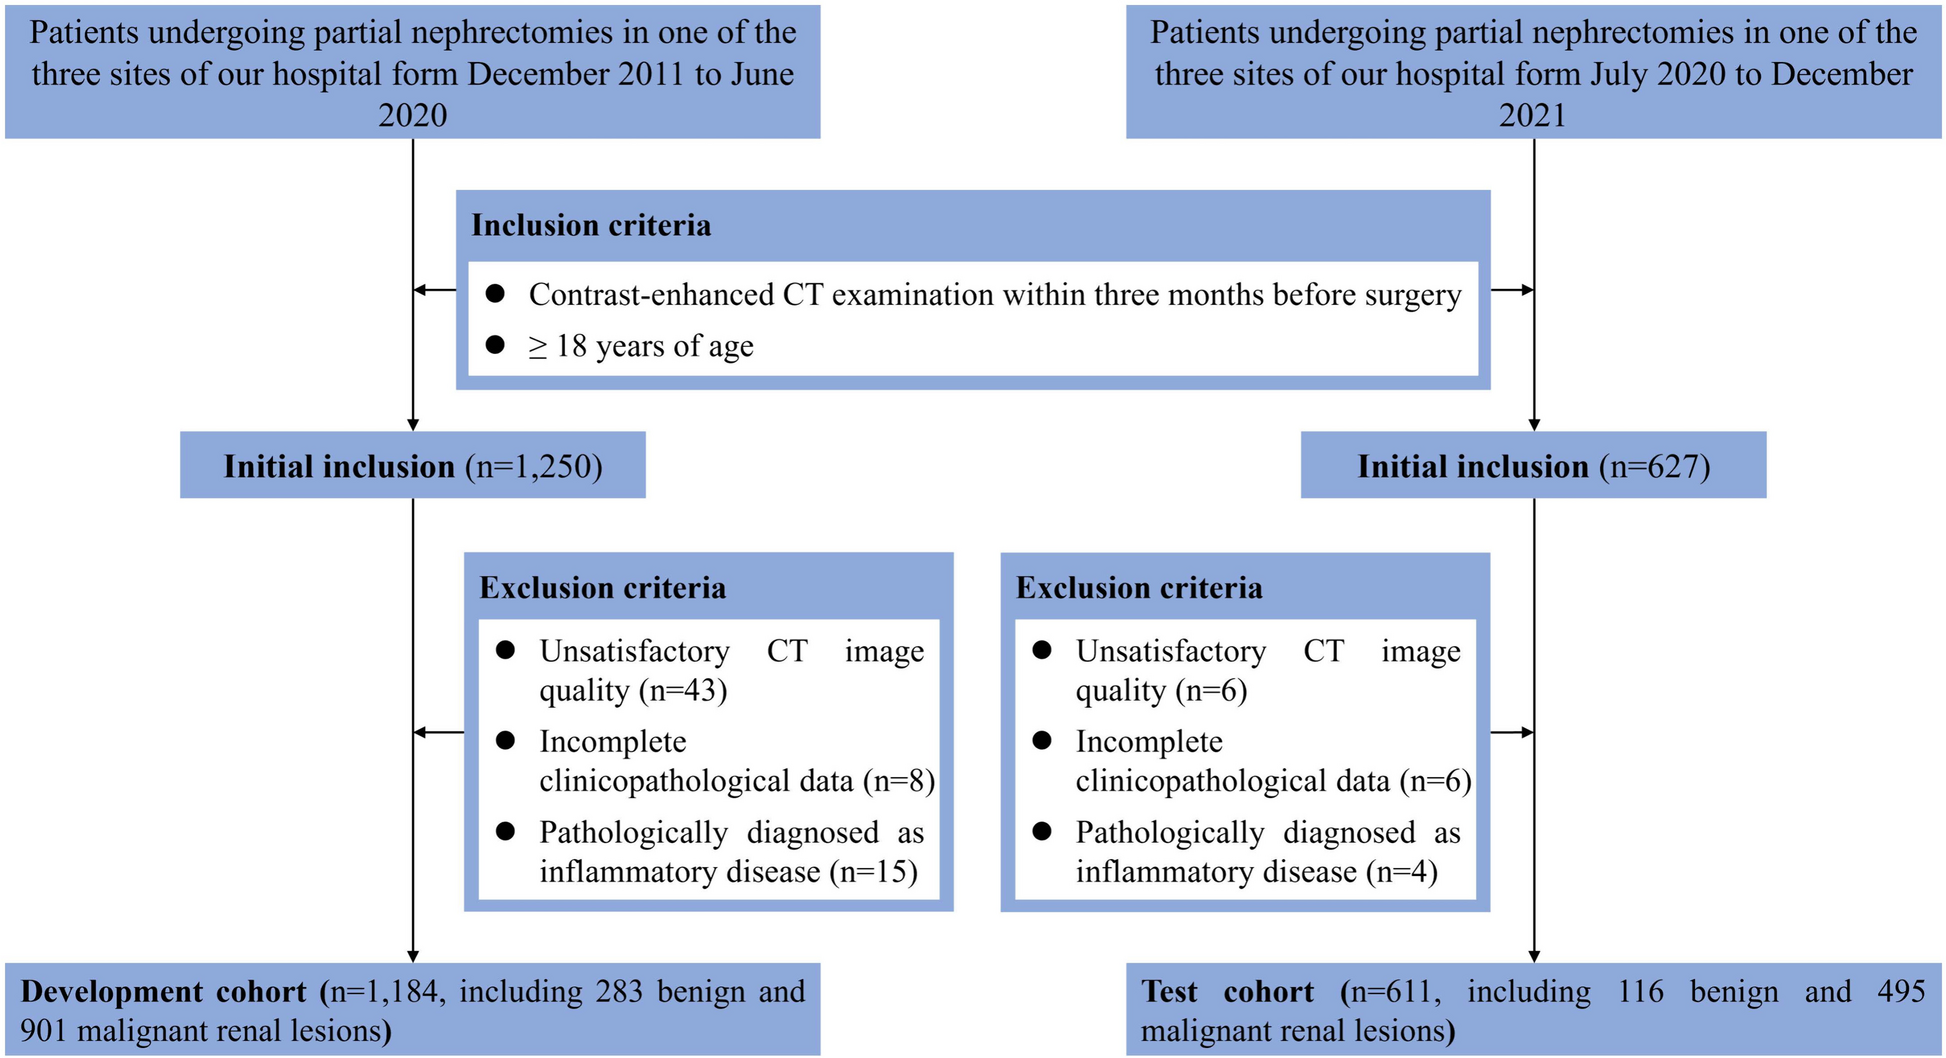


This is a retrospective multi-center study with data from the four medical centers (Taiyuan People Hospital, China; Xian People Hospital, China; Department of Radiology, China-Japan Friendship Hospital, Beijing, China; Heping Hospital, Changzhi Medical College, China) by four kinds of medical instruments (Toshiba320-slice CT, SOMATOM 64-slice CT, Philips 128-slice CT and SOMATOM force dual source CT), with a largely varying in-plane resolution from 0.5 mm to 1.0 mm and slice spacing from 5.0 mm to 8.0 mm. For simplicity, we represent the above four datasets as D1, D2, D3 and D4, respectively. Our dataset was collected from 2015 to 2018, which contains 211 CT image samples (211 ordinary CT volumes and 63 enhanced CT volumes), of which D1 included 74 cases, D2 included 39 cases, D3 included 47 cases (47 ordinary CT volumes and 63 enhanced CT volumes), and D4 included 51 cases. The ground truth of segmentation is annotated by four experienced radiologists using the ITK-SNAP software based on surgical pathology. The four experienced radiologists all specialize in abdominal radiology, two of them have 8 years of clinical experience and the other two have more than 10 years of clinical experience. Note that the used dataset has passed the ethical review of the relevant hospitals and obtained the informed consent of the patients.
To cope with the limitation of 3D data on computer memory consumption, and considering that the tumor area is smaller than the background area, we cut and resample each volume to patches including voxels with a voxel size of 5.0 × 0.741 × 0.741mm3 or 8.0 × 0.741 × 0.741 mm3. To compensate for the lack of training data, we not only use the online data augmentation [12] (e.g., flipping, rotation, translation), but also perform CT image normalization (automatic clipping operation from 0.5 to 99.5% intensity value of all foreground voxels) and voxel space resampling (with third order spline interpolation).
Network overviewFigure 1 shows the overview of the proposed HCA-DAN, which includes two collaborative components, i.e., AsTr and HCADA. The proposed 3D domain adaptation network takes an abdominal CT volume as input and starts with AsTr as backbone to extract multi-scale context features from the CT images with anisotropic resolution. Then the extracted features from source and target domains are passed to HCADA module, which can effectively distinguish the features of the source and target domains by taking into account class information.
Fig. 1
The overview of the proposed HCA-DAN. AsBlock: anisotropic convolutional block; SE-Res: squeeze-and-excitation residual block; PBA: pyramid boundary-aware block; HCADA: hierarchical class-aware domain alignment module, which includes four CADA blocks. Note that to demonstrate an elegant framework, we omit the display of the positional encoding when the multi-scale features generated from the As-encoder are passed to the DeTrans layer
Architecture of AsTrInspired by CoTr [18], AsTr is proposed to learn more discriminative multi-scale features for gastric tumor segmentation via jointing CNN and Transformer. AsTr consists of an anisotropic convolutional encoder (As-encoder) for feature extraction from the CT images with anisotropic resolution, a deformable Transformer-encoder (i.e., DeTrans-encoder) for long-range dependency modeling, an anisotropic convolutional decoder (As-decoder) for accurate tumor segmentation.
To address the issue of anisotropic voxel resolution, we construct the As-encoder by combining anisotropic convolution with isotropic convolution, rather than simply using isotropic convolution. The As-encoder mainly contains a Conv-GN-PReLU block, two average pooling layers, two stages of anisotropic convolution block (AsBlock), and two stages of 3D squeeze-and-excitation residual (SE-Res) block. The Conv-GN-PReLU block represents a 3D convolutional layer followed by a group normalization (GN) and a parametric rectified linear unit (PReLU). The number of AsBlock in two stages are two and three, respectively. The number of SE-Res block in two stages are three and two, respectively. As shown in Fig. 2a, the input of AsBlock is delivered to 1 × 3 × 3 and 3 × 1 × 1 anisotropic convolutions, respectively. Then the outcomes are then concatenated with the input as the output. Moreover, the 1 × 1 × 1 convolution are employed to both input and output to adjust the channel numbers of features. Through this design, the As-encoder can independently extract features on the x-y plane and along the z direction from 3D volume, which reduces the influence of anisotropic spatial resolution. Considering that 3D data contains a wealth of information, we add two stages of SE-Res block in the back end of the As-encoder. As shown in Fig. 2b, the SE-Res block consists of residual and SE blocks, which not only improves the representation capability of the encoder, but also alleviates the overfitting problem caused by the deep network.
Fig. 2
The architectures of three blocks
To compensate for the inherent locality of convolution operation, the DeTrans layer is proposed [18] to capture the long-term dependence of pixels in multi-scale features generated by the encoder. In general, the DeTrans layer is composed of a multi-scale deformable self-attention (MS-DMSA) layer and a feedforward network, each being followed by the layer normalization.
To capture more accurate tumor boundaries, in addition to AsBlock and SE-Res blocks, we also design the PBA block in As-decoder. Therefore, the As-decoder mainly contains two stages of AsBlock, two stages of 3D SE-Res block, four PBA blocks, four transpose convolution layers, and a Conv-GN-PReLU block. Inspired by 2D pyramid edge extraction module [31], we design the 3D PBA block (as shown in Fig. 2c) to refine the boundaries of the lesion. The PBA block is a simple and effective pyramid boundary information extraction strategy, which can obtain robust boundary information by capturing different representations of pixels around the diseased area. Specifically, the PBA block takes the features F generated by the previous layer as input and passes it into a multi-branch pooling layer with different kernel sizes to obtain the features \(\left\}^,\cdots ,}^}\right\}\) with lesion edge information. Then, the feature \(\stackrel}\) is generated by a series of operations, which can be defined as:
$$\overline}=\operatorname\left\\left[\sigma\left(\boldsymbol-\boldsymbol^1\right) \otimes \boldsymbol ; \cdots ; \sigma\left(\boldsymbol-\boldsymbol^}\right) \otimes \boldsymbol\right]\right\}$$
(1)
where \(\left\}^,\cdots ,}^}\right\}\) is obtained by average pooling layers with different kernel sizes; conv means a 1 × 1 × 1 convolutional layer; \(\mathbb\) represents channel concatenation operation; \(\sigma\) denotes a Sigmoid function; \(\otimes\) indicates element-by-element multiplication. In this way, we obtain multiple granularities responses near the edge by subtracting the value of average pooling with different sizes from its local convolutional feature maps and configuring soft attention operation in each branch.
It is worth noting that during decoding, the output sequence of the DeTrans layers is reshaped into feature maps according to the size at each scale. Then, the reshaped multi-scale features are added element-by-element in the decoding path for better tumor segmentation.
Hierarchical class-aware domain alignmentIn this section, we consider how to use the class-specific information to guide multi-scale feature distribution alignment in our feature extractor AsTr. On the one hand, tumors of different cases have different sizes and positions in CT images, and multi-scale feature extraction has been proved to be very effective in many scenarios, especially in the task of lesion segmentation. Technically, low resolution feature maps tend to predict large objects, while high resolution feature maps tend to predict small objects. Therefore, we introduce the hierarchical domain alignment mechanism, which takes object scales roughly into account when performing domain distribution alignment. In short, we configure a domain discriminator for each scale feature, which can effectively guide the feature alignment of tumors of different sizes. On the other hand, many efforts ignore class-specific knowledge during feature alignment, which leads to misalignment. To encourage a more discriminative distribution alignment, we produce an attention map for each class separately, which is calculated based on the probability of class occurrence. The attention map is defined as:
$$}_=\text\text\text\text\text\text\text\left(}_\right)$$
(2)
,
where \(}_\) denotes the output of the segmentation network AsTr. In other words, we use the \(\text\text\text\text\text\text\text\) function to calculate the class attention map for all output spatial positions. This class attention map is aggregated into the domain discriminator to capture class-specific information in domain adaptation, rather than class-agnostic information, which encourages more discriminative distribution alignment in the CADA block. Specifically, we employ the U-Net [32] architecture as a domain discriminator D in the CADA block. First, we upsample the feature generated by the PBA block with triple interpolation to the same resolution as the input image. The newly generated feature is then fed into the domain discriminator D and a probability map is generated to distinguish whether the feature is from the source or target domains. Finally, this probability map is multiplied by the class attention map element by element to obtain the final probability map.
Data partitioning and network implementationWe validate the proposed method in both in-center and cross-center test scenarios. In order to obtain reliable segmentation results, we employed a five-fold group cross-validation strategy in the in-center test scenario. In the cross-center test scenario, we use three datasets as the source domain and the remaining one as the target domain, which is a common validation strategy for domain adaptive methods.
The proposed cross-center 3D tumor segmentation method is implemented on the PyTorch platform and is trained with 1x NVIDIA GeForce RTX 3090 GPU (24GB). We train all 3D networks by using the SGD optimizer with a momentum of 0.99 and an initial learning rate of 1 × 10− 3. We set batch size as 2, and the network was trained for 500 epochs and each epoch contains 250 iterations. In four PBA blcoks, we use the 3 × 3 × 3 and 5 × 5 × 5 average pooling operation for the first two blocks, and 5 × 5 × 5 and 7 × 7 × 7 pooling kernels in the last two blocks.
We employ four performance metrics to quantitatively evaluate the obtained segmentation results, which include the Dice similarity coefficient (DSC), Jaccard index (JI), Average surface distance (ASD, in mm) and 95% Hausdorff distance (95HD, in mm). The first two are more sensitive to the inner filling of the mask, and the second two are more sensitive to the segmentation boundary. These metrics are calculated by the following formulas:
$$ASD=\frac\left\_ _ d\left(x,y\right), _ _ d\left(x,y\right)\right\}$$
(5)
$$HD=max\left\_ _ d\left(x,y\right), _ _ d\left(x,y\right)\right\}$$
(6)
where \(\left|*\right|\) and \(\cap\) denote the size and the intersection operation in the set, respectively. x and y are the coordinates of the midpoint of the image, \(_ _\) is average of the closest distance between two points, \(_ _\) is the shortest distance from a point in a point set to another point set. 95% HD is similar to maximum HD, which is based on the 95th percentile of the distance between the boundary points in X and Y.
Loss functionWe employ adversarial strategies to implement network training. Therefore, the proposed network consists of three losses, including segmentation loss \(}_\), discrimination loss \(}_^\) and adversarial domain adaptation loss \(}_^\). The segmentation loss is the sum of Dice loss \(}_\) and binary cross-entropy loss \(}_\), which defined as:
$$}_=1-\frac_^__}_^_}^+_^_}^}$$
(8)
$$}_=\sum _^_\text_+\sum _^_)\text(1-_)$$
(9)
where N is the voxel number of the input CT volume; \(_\in \left[\text\right]\)represents the voxel value of the predicted probabilities; \(_ \in \left\\right\}\) denotes the voxel value of the binary ground truth volume.
Following [33], we calculate the single-level discrimination and adversarial domain adaptation losses with the least squares loss function as follows:
$$}_^=_^\left(}_}^\right)\right)-1\right]}^+_^\left(}_}^\right)\right)+1\right]}^$$
(10)
$$\mathcal_^l=\boldsymbol_ \otimes\left[D\left(f_^l\left(\boldsymbol_}^l\right)\right)-1\right]^2$$
(11)
where \(_^\) denotes l-th PBA block; \(l\in \\); \(}_}^\) and \(}_}^\) represent the source domain and target domain features obtained in the layer before the l-th PBA block, respectively. Therefore, the hierarchical discrimination and adversarial domain adaptation losses are defined as:
$$}_^=_^^\cdot \mathcal}_^$$
(12)
$$}_^=_^^\cdot \mathcal}_^$$
(13)
where \(^\) denotes the weight of l-th discrimination and adversarial domain adaptation losses, which decreases exponentially with the decrease of feature resolution.
留言 (0)