
記住我


Noncoding RNAs (ncRNAs), including transfer RNA (tRNA), ribosomal RNA (rRNA), microRNA (miRNA), long noncoding RNA (lncRNA), circular RNA (circRNA), and so on, do not directly translate into functional proteins, but they play essential roles in gene expression at post-transcriptional level, accounting for up to 70% of the human genome (Palazzo and Lee, 2015). To date, it has been confirmed that ncRNAs, previously regarded as junk molecules, involved in multiple cellular physiological and pathological processes, such as metabolism and apoptosis, with rapidly development of whole-transcriptome sequencing (WTS), which can produce massive data on ncRNAs and mRNAs and predict related regulatory networks based on high-throughput sequencing technology (Cech and Steitz, 2014). Concretely, lncRNAs are long intergenic noncoding RNAs (lincRNAs) longer than 200 nucleotides (nt), and they are necessary for various biological processes, such as cell proliferation, differentiation and development, comprising sense lncRNAs, bidirectional lncRNAs, intronic lncRNAs, and intergenic lncRNAs, by controlling the expression level of the target genes at transcriptional or post-transcriptional levels through cis and trans regulation (Guttman et al., 2011; Batista and Chang, 2013; Quinn and Chang, 2016; Kopp and Mendell, 2018). On the other hand, circRNAs, first identified in viroids in 1976, are a novel kind of endogenous ncRNA and covalently closed RNA molecules without 5′ caps and 3′ tails (Sanger et al., 1976; Memczak et al., 2013). Four types of circRNAs were classified, containing circular exonic RNAs, intergenic circRNAs, circular intronic circRNAs, and exon–intron circRNAs, and they have a role in the regulation of gene expression by functioning as miRNA sponges, miRNA reservoirs, and linear mRNA splicing competitors (Hansen et al., 2013). Importantly, there are a growing number of reports on both lncRNAs and circRNAs forming competing endogenous RNAs (ceRNAs) by binding to miRNAs, which could degrade or suppress the expression of mRNA in animals (Dykes and Emanueli, 2017).
In invertebrates, the immune system can protect the body from pathogenic infection, of which innate immunity, belonging to nonspecific immunity, is the essential first line of defense against pathogens and parasites. The cellular and humoral immunity, constituting innate immunity in insects, include the encapsulation and phagocytosis of pathogens and the secretion of antimicrobial peptides (AMPs), respectively (Hillyer, 2016; Rolff and Schmid-Hempel, 2016). AMPs are gene-encoded cationic polypeptides, most of which can produce direct antimicrobial effects against bacteria and fungi (Ganz, 2003; Feng et al., 2020). There are many reports and databases that have reported numerous insect-derived AMPs from several families, such as cecropins, defensin, drosocin, drosomycin, diptericins, metchnikowin, attacins, cecropins, and moricins (Staczek et al., 2023). Moreover, it has been found that they are induced by NF-κB transcription factors, including Dorsal, DIF (dorsal-related immunity factor) and Relish, which are mainly controlled by the Toll and Imd signaling pathways in Drosophila and other model insects (Myllymaki et al., 2014; Valanne et al., 2022). In brief, defensins (Def) possess many β-sheets and a framework of disulfide-linked cysteines and are divided into three subclasses based on their molecular characterization (Ganz, 2004). Lysozymes (Lyz) are key immune effectors of the innate immune system that protect the host from pathogen infection and exert essential functions in digestion and reproduction (Xiao et al., 2023). Surprisingly, the expression of defensins and lysozymes was also found to be induced after viral infection in flies and silkworms (Feng et al., 2020). Accumulating evidence has suggested that lncRNAs and circRNAs play significant roles in insect immunity; for example, it has been shown that lncRNA_XR209691.3 can promote the proliferation of BmNPV (Bombyx mori nucleopolyhedrosis virus) through interaction with BmHSP70, and the circ_0001432–miR-2774c/miR-3406-5p–mRNA778467/101745232 axis exists in the fat body during BmNPV infection in Bombyx mori (Yin et al., 2021; Lin et al., 2023). In Drosophila, the lncRNAs CR11538, CR46018 and CR33942 play positive or negative roles in the transcription of immune effector genes in the Toll or Imd pathways (Zhou et al., 2021a,b, 2022a,b). Zhang J. et al. (2020) demonstrated that the expression of circRNAs and bound miRNAs significantly changed during rice black-streaked dwarf virus infection in the Laodelphax striatellus gut. However, the transcriptome-wide identification, annotation and prediction of lncRNA– and circRNA–mediated networks of AMPs in heteropteran insects are limited, which could be essential for understanding their adaptive homeostasis in response to environmental changes.
The insect gut is an important channel for pathogen infection, so it is the first line of defense against ingested pathogens and the entry portal for viruses and parasites owing to its connection to the host and external environment (Qiao et al., 2023). Importantly, gut microbial communities exist in host specialized guts and cell bacteriocytes and benefit host survival, homeostasis, development and functioning; thus, the hologenome concept has been inspired, either transiently or tightly, by host–microbe associations, meaning that the gut microbiome has an important role in the host’s physiology and immunity, while microbiome composition may be affected by host selection in response to environmental pressures or changes (Engel and Moran, 2013; Kokou et al., 2018; Fan and Pedersen, 2021). It is recognized that an imbalance in gut bacterial composition may lead to host fitness loss and increase susceptibility to pathogens and metabolic diseases because overall host well-being benefits from gut flora health (Evariste et al., 2019; Mougin and Joyce, 2023). The bean bug, Riptortus pedestris (Hemiptera: Alydidae), is a major agricultural pest that is widely distributed in East Asia, such as South Korea, Japan, and China, resulting in significant yield losses and low seed quality of soybean (Glycine max), which is an important oil and cash crop (Shan et al., 2021; Wei et al., 2023). Evaluation of the associations between bean bugs and gut bacteria was performed in R. pedestris (Jang et al., 2023; Wei et al., 2023; Xia et al., 2023). For example, a specific gut bacterial symbiont, Caballeronia insecticola (Burkholderia insecticola), promoted the proliferation of stem cells and simultaneously inhibited apoptosis at the tip of gut crypts in R. pedestris (Jang et al., 2023). Besides, the knockdown of thanatin genes significantly increased the population of gut symbiont Burkholderia in the M4 crypt under Escherichia coli K12 injection (Lee et al., 2022). Serratia marcescens can stably colonize the R. pedestris midgut by degrading serralysin toxin by detoxification activity from host gut symbionts (Lee and Lee, 2022). In the present work, we further assumed that shifts in the gut bacteria would affect the expression profiles of AMPs and related ncRNAs in R. pedestris under different environments.
To achieve our research goals, twelve WTS libraries from the whole gut of R. pedestris were constructed and sequenced under different feeding conditions, producing massive clean reads after quality control and filtration. Of these reads, we identified and investigated the functional, expression and target characterization of lncRNAs and circRNAs by bioinformatic analysis. Furthermore, different numbers of defensin and lysozyme family genes were screened, and we illustrated their molecular characteristics and evolutionary relationships in insects. Next, a miRNA– defensin/lysozyme target network and lncRNA-mediated ceRNA network of one lysozyme were built, and of these ncRNAs in ceRNA network, differential expression was identified and shown based on WTS data. Finally, our results provide data on associations of differentially expressed (DE) defensins, DE lysozymes and related ncRNAs, as well as most changes in the gut bacterial microbiota at the genus level with Pearson correlation analysis among the different comparison groups. Taken together, the present findings will shed light on future observations on innate immune ncRNAs and AMPs in insects and lay the foundation for pest management in hemipterous pests.
2 Materials and methods 2.1 Sample collection and treatmentsThe animal study and the sampling procedures followed the guidelines of the Animal Care and Use Committee of Nankai University. In the current study, all samples of R. pedestris were collected from soybean fields at Nankai University, Tianjin, P.R. China, and maintained in climatic chambers at 25 ± 2°C temperature, 60% ± 5% relative humidity, and a 16 h:8 h light/dark photoperiod cycle. The newly hatched eggs from above collected samples were cultured in Petri dishes, and then newly 2nd-instar nymphs were divided into three experimental groups until to emerging adults. In brief, the groups were set as follows: (i) feeding soybean seeds and ascorbic acid (DWA) water (Blank group, B); (ii) feeding potted soybean plants and DWA water (Control group, C); (iii) alternatively feeding with soybean seeds and 0.05% (w/v) DWA or only distilled water containing 50 μg/mL tetracycline (Antibiotic group, A) on the following day (Ren et al., 2023). Later, the whole guts of these above adults and field-collected adults (Field group, F) were dissected (starved after 2 days), and ultimately, three guts from the same group were surface-sterilized in 70% ethanol for 1 min and randomly pooled as one biological replicate, with three biological replicates prepared for each experimental group, and then all these samples were flash-frozen in liquid nitrogen and stored at −80°C until further extraction.
2.2 Total RNA extraction and library construction and sequencingAll gut samples were ground separately in liquid nitrogen, and total RNA was isolated using TRIzol reagent (Invitrogen, United States) according to the manufacturer’s instructions. The integrity, quality and purity of extracted RNA were evaluated using 1% agarose gel electrophoresis staining and the A260/A280 ratio by a Bioanalyzer 2,100 system (Agilent Technologies, CA, United States) and a NanoPhotometer® spectrophotometer (IMPLEN, CA, United States), respectively. In this study, the remaining total RNA after library construction was used for qRT–PCR validation.
For lncRNA sequencing, based on the manufacturer’s instructions, ribosomal RNAs (rRNAs) were removed from total RNA using the rRNA Removal Kit (Epicenter, United States) to retain mRNAs and ncRNAs, which were amplified with random hexamer primers to synthesize first-strand cDNA. Next, the second strands were produced by adding buffer, DNA polymerase I, dNTPs, and RNase H. Meanwhile, for circRNA sequencing, above remaining RNA was randomly interrupted into 140–160 nt followed by reverse transcription and amplification with random primers. The above double-stranded cDNA fragments were purified with the AMPure XP system, and the quality of constructed libraries was estimated through the Agilent Bioanalyzer 2,100 system in order to meet the requirements for further sequencing. Lastly, all the prepared libraries were sequenced by the MGI2000 platform (BGI, Wuhan, China) to generate raw reads. In addition, the raw data were submitted to the NCBI Sequence Read Archive database under accession number PRJNA638739.
2.3 Data processes and identification of lncRNAs and circRNAsFirst, raw reads with adaptor contamination, insert tags, and low-quality and undetermined data were removed to produce clean data using SOAPnuke software (version 1.5.2) (Chen et al., 2018), and simultaneously, the Q20, Q30, and GC contents of the clean data were statistically calculated. Next, the filtered clean reads with high quality were stored in FASTQ format and were mapped to the R. pedestris reference genome (accession numbers: SRR12977074) using HISAT2 (version 2.0.4) (Kim et al., 2019; Huang et al., 2021). Transcripts were assembled from the mapped reads of each group using StringTie (version 1.0.4) and were determined locations and interactions using Cufflinks (version 2.2.1) (Pertea et al., 2015).
Second, to classify the protein-coding or noncoding sequences, if the transcripts could be matched in the Pfam database, they were known as mRNAs; otherwise, they were served as lncRNAs. The coding ability of transcripts was further predicted using the Coding-Non-Coding-Index (CNCI; CNCI_threshold >0 is mRNA, CNCI_threshold <0 is lncRNA), Coding Potential Calculator (CPC, version 0.9-r2; CPC_threshold >0 is mRNA, CPC_threshold <0 is lncRNA) and txCdsPredict (txCdsPredict_threshold >500 is mRNA, txCdsPredict_threshold <500 is lncRNA) (Zhang et al., 2023).
Third, Find_circ (version 1.2) and CIRI (version 2.0.5) were employed to identify circRNAs with default parameters (Memczak et al., 2013; Gao et al., 2015). CircRNAs were assigned into all the sequencing groups based on their transcriptional location in the genome and then were classified into exonic, intronic, sense, antisense and intergenic circRNAs (Shen et al., 2017).
2.4 Expression analysis of lncRNAs and circRNAsTo investigate the expression patterns of lncRNAs, circRNAs and mRNAs, FPKM (Fragments Per Kilobase of exon model per Million mapped reads) was used to estimate their expression abundance among all the sequencing samples. The Benjamini–Hochberg correction procedure was applied to adjust the resulting p values to decrease false discovery rates (FDR). The expression profiles of lncRNAs and circRNAs were calculated and normalized to transcripts per million (TPM), and the significantly differentially expressed lncRNAs (DELs) and circRNAs (DECs) were considered with both absolute log2 |Fold Change| >1 and p < 0.001 using DESeq R package (version 3.0.3) and Bowtie2 (version 2.2.5) (Love et al., 2014).
2.5 Target prediction and bioinformatic analysesTo predict the target genes of lncRNAs, the regions 0–10 kb (kilobase) upstream or 0–20 kb downstream of cis–acting lncRNAs were scanned to find co-located target genes, and meanwhile, the lncRNAs were considered trans–acting on the target genes once the binding energy was < −30 and exceeded the above region based on the cis/trans-regulatory algorithms (Pearson correlation coefficient ≥ 0.6 and Spearman correlation coefficient ≥ 0.6). In addition, the overlaps between lncRNAs and target genes were classified into four categories: overlap, anti-overlap, incomplete, and anti-incomplete. For co-localization analysis, we searched the protein-coding genes located between 10 kb and 20 kb from the lncRNA and examined the correlation between the expression patterns of each gene and lncRNA (Zhang et al., 2022). To identify the circRNA targeting miRNAs, RNAhybrid (version 0.1) and miRanda (version 3.3a) were employed to predict miRNA sites in circRNAs using the default parameters (Energy < −30) according to Pearson correlation coefficients ≥0.6 and p < 0.05 (Sai et al., 2018).
DELs and their target genes, and DECs were blasted to the GO (Gene Ontology) and KEGG (Kyoto Encyclopedia of Genes and Genomes) pathway databases using GOseq R package and KOBAS software, respectively, and they were significantly enriched based on a corrected p < 0.01 (Boyle et al., 2004). In addition, the top 20 significantly enriched KEGG pathways were selected and performed among all the comparison groups.
2.6 Identification, characterization and phylogenetic analysis of defensins and lysozymesThe defensin and lysozyme family genes were identified from WTS data and then were compared to those of other insects by the BLAST program (TBLASTN and BLASTP databases with E-values <0.001; https://www.ncbi.nlm.nih.gov/). Subsequently, the retrieved cDNA sequences were translated using the ExPASy-Translate tool. The putative domains and signal peptides of all of the above translated protein sequences were predicted with InterProScan and TMHMM Server (version 2.0; http://www. Cbs.dtu.dk/services/TMHMM), and SignalP (version 5.0; https://services.healthtech.dtu.dk/services/SignalP-5.0/), respectively. The schematic diagrams of the protein structures were drawn and visualized using IBS software (Illustrator for Biological Sequences; version 2.0; https://ibs.renlab.org/#/home). The molecular weights (MWs), isoelectric points (PIs), and grand average of hydropathicity (GRAVY) of amino acid sequences were analyzed by the ExPASy ProtParam tool (Ren et al., 2022; Xie et al., 2022). The protein structure of the three-dimensional (3D) model was constructed and predicted using SWISSMODEL and PSIPRED (version 4.0; http://bioinf.cs.ucl.ac.uk/psipred/) (Duvaud et al., 2021; Paysan-Lafosse et al., 2023). The amino acid sequences of defensins and lysozymes from other insects were searched and downloaded from the NCBI GenBank database, and multiple sequence alignments were executed using ClustalW (version 2.1). Finally, two phylogenetic trees were generated using MEGA (Molecular Evolutionary Genetics Analysis; version 9.0) with the neighbor-joining (NJ) method (Kumar et al., 2016), whose statistical supports were calculated with 1,000 bootstrap replicates (Supplementary Table S4), and the results were visualized and optimized using FigTree software (version 1.4.4) (Tong et al., 2015).
2.7 The identification and construction of interaction networksLncRNAs and circRNAs with miRNA binding sites, serving as miRNA sponges, can compete with mRNAs for interaction with target miRNAs involving in the expression regulation of corresponding mRNAs (Hansen et al., 2013). In this study, we constructed a ceRNA network according to the ceRNA hypothesis using Cytoscape software (version 3.9.1). In brief, we selected lncRNAs, circRNAs, miRNAs and mRNAs to build the ceRNA network based on the same expression trends of lncRNAs or circRNAs and mRNAs and opposite expression of those with miRNAs, and the p value and |Pearson correlation coefficients| of lncRNA–miRNA, circRNA–miRNA, and miRNA–mRNA pairs were less than 0.05 and more than 0.6, respectively. In addition, the prediction and annotation of the miRNA–mRNA pairs were from our previous report (Ren et al., 2023).
2.8 Correlated analysis of the WTS and 16S rRNA sequencing dataTo detect the associations between DE defensin, DE lysozymes and related DE ncRNAs, and most changes in the gut bacterial microbiota at the genus level among the six comparison groups, the heatmaps were produced using R software (version 2.15.3) based on Pearson correlation coefficients and the levels of statistically significant difference at *p < 0.05, **p < 0.01, and *** p < 0.001 (Ren et al., 2023).
2.9 Corroboration of WTS data by qRT–PCRThe remaining total RNA after library construction was used to synthesize first strand cDNA with the TransScript II One-Step gDNA Removal and cDNA Synthesis Kit (TransGen, Beijing, China). The quantitative real–time PCR (qRT–PCR) assay was executed with a Green qPCR SuperMix Kit (TransGen, Beijing, China) on a CFX96 real–time PCR detection system (Bio-Rad Laboratories, Hercules, CA) following the manufacturer’s instructions. The PCR procedures were performed as described previously (Fu et al., 2021; Ren et al., 2023). The EF–1α gene was used as an internal control for normalization of the expression levels, and specific primers of selected DE AMPs and ncRNAs were designed by Primer Premier 5 software (Supplementary Table S5). Finally, the results were calculated and displayed between the log2 (Fold Change) values from the WTS data and the log 2 of the relative quantification (RQ) values from above selected AMPs and ncRNAs using qRT–PCR reaction (Livak and Schmittgen, 2001), and column charts were produced using GraphPad Prism (version 9.0; GraphPad Software Inc., United States).
3 Results 3.1 Overview and filtration of WTS dataTo explore the lncRNA profiles in the R. pedestris gut during different feeding conditions, a total of twelve WTS libraries were constructed and sequenced using the high-throughput MGI2000 platform. Overall, we obtained a total of 1,498,361,064 clean reads from a total of 1,592,518,964 raw data by filtration and quality control, with Q20 ≥ 96% and Q30 ≥ 91% (Supplementary Table S1). Next, clean reads were mapped to the R. pedestri genome, indicating the matching rates of each experimental group were more than 77% (Supplementary Table S1). The transcripts were assembled and filtered, and their basic information are shown in Supplementary Figures S1A-C). To identify lncRNAs and mRNAs by coding potential prediction, as shown in Figures 1A,B, 30,599 transcripts were classified as lncRNAs, and 31,139 transcripts were viewed as mRNAs.
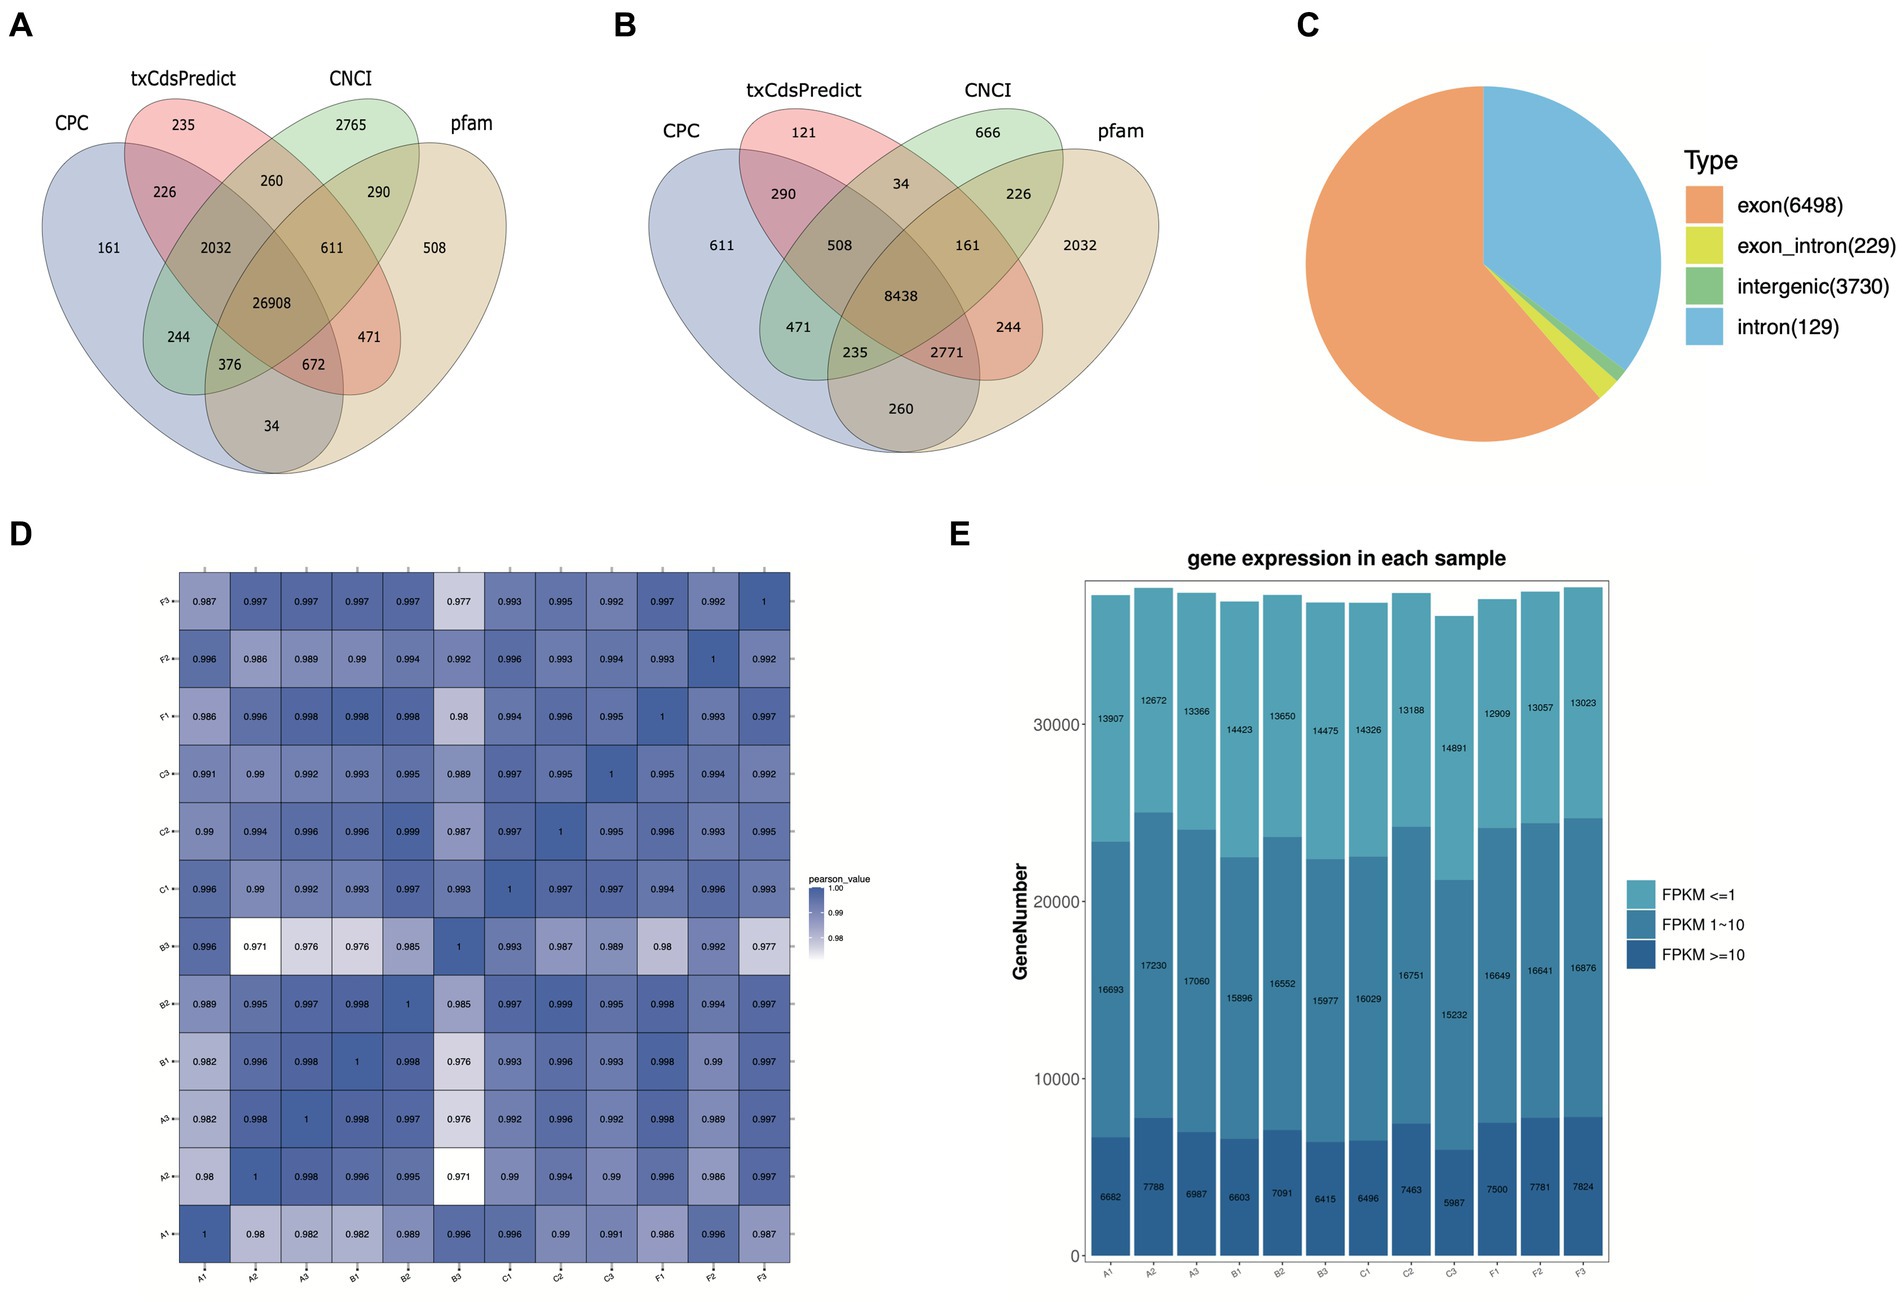
Figure 1. Basic information on twelve WTS libraries in the R. pedestris gut under different feeding conditions. The coding capacity predictions of lncRNAs (A) and mRNAs (B) are shown in Venn diagrams using CNCI, CPC, txCdsPredict, and pfam. (C) Summary of circRNA types from twelve libraries. (D) The correlation heatmap of all WTS libraries. (E) The expression profiles of all genes from twelve WTS libraries are shown by FPKM values. X-axis: twelve WTS libraries, Y-axis: Gene numbers in different libraries.
On the other hand, circRNAs were also identified and classified from twelve WTS libraries of four experimental treatments. We obtained a total of 1498.36 million clean reads with Q20 ≥ 96.9 and Q30 ≥ 92.66, indicating that they possess high quality after filtering out 1592.5 million raw reads (Supplementary Table S2). Through mapping clean reads to the R. pedestris genome, a total of 10,586 circRNAs were identified using CIRI and Find_circ prediction, which were mainly equally distributed in all chromosomes and partial scffolds, while they did not distributed in several scaffolds (data not shown). As evidenced in Supplementary Figure S1D, the length information suggested that the majority of circRNAs were above 3,000 nt. All circRNAs were classified into four types, including 6,498 exon circRNAs, 229 exon_intro circRNAs, 3,730 intergenic circRNAs, and 129 intron circRNAs (Figure 1C). In addition, we predicted the potential function of circRNA coding capacity through cORF (circRNA open reading frame) and IRES (internal ribosome entry site) prediction, suggesting that 5,953 cORFs were identified from 63 to 11,571 bp (Supplementary Figure S1E) and that a total of 8,965 circRNAs possess IRESs from different start and end sites (Supplementary Table S3).
3.2 Expression analysis of lncRNAs and circRNAsIn this study, the correlation values exceeded 0.97 among each of twelve WTS libraries, representing the robustness of the biological replicates and the reliability of the sequencing data (Figure 1D), and different numbers of expressed genes were calculated with FPKM values, as shown in Figure 1E. The expression patterns and hierarchical clustering of above genes are shown in a heatmap diagram, and massive clusters are exhibited based on their expression signatures (Supplementary Figure S2). The different numbers of DELs among the six comparison groups is displayed in Figure 2A, suggesting that a total of 9,081 DELs were identified in the antibiotic groups compared to the other groups, including 5,559 upregulated DELs and 3,522 downregulated DELs, and the comparison group of F vs. B observed the largest numbers of DELs. Additionally, a total of 1,854 DECs were selected among the six comparison groups, containing a total number of 672 upregulated DECs and 1,182 downregulated DECs (Figure 2B). The F vs. C group had the majority of DECs, with 126 upregulated DECs and 411 downregulated DECs.
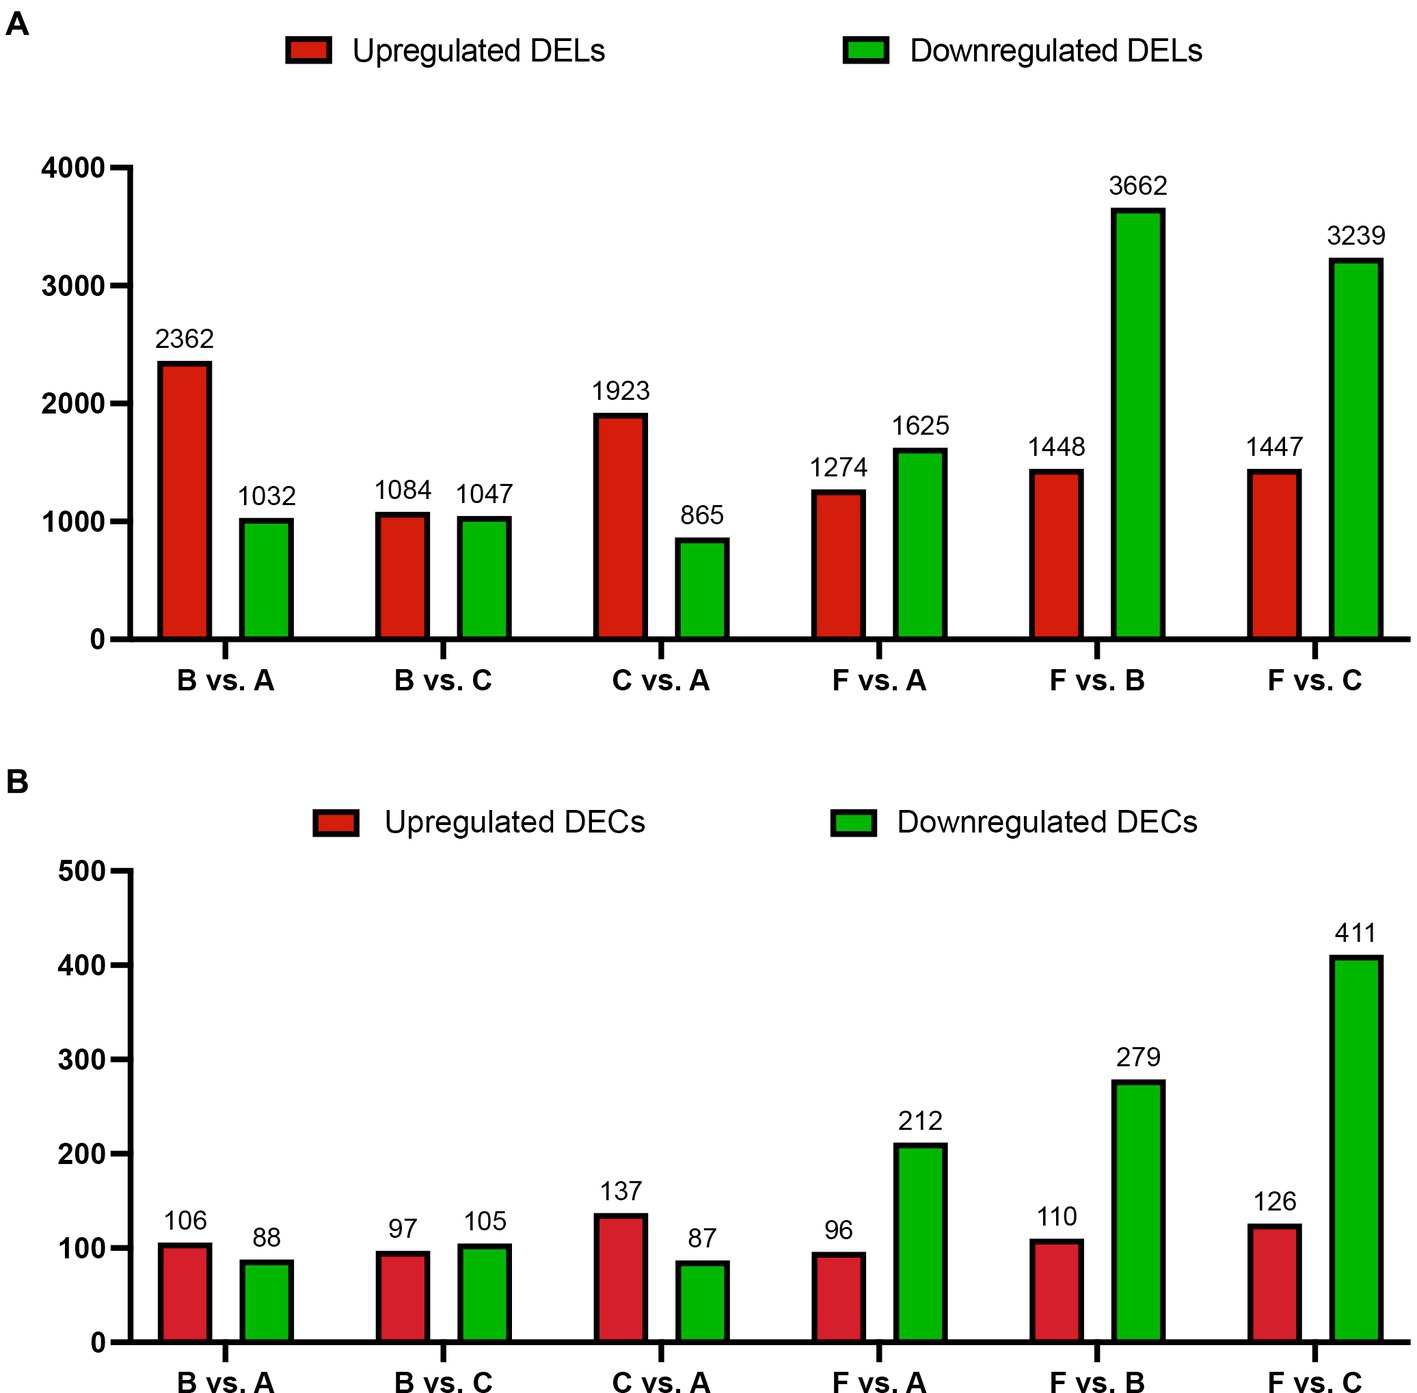
Figure 2. The number of DELs (A) and DECs (B) for the host genes based on absolute log2 |Fold Change| >1 and p < 0.001 among the six comparison groups. X-axis: six comparison groups, Y-axis: the number of DELs or DECs for the host genes, respectively. Red and green bars represent upregulated and downregulated DELs or DECs for the host genes, respectively.
3.3 Target prediction and bioinformatic analysisTo further determine the potential regulatory role of lncRNAs, all obtained lncRNAs were applied to predict the potential target mRNAs (lncRNA–mRNA interactions), revealing that a total of 8,850 lncRNA–mRNA pairs, including 3,466 cis (nonoverlap)_trans and 5,384 overlap pairs, were calculated in our research. Next, in order to explore the functional annotation of DELs and target genes, we detected different numbers of significantly enriched GO terms among all the comparison groups, containing biological process (BP), cellular component (CC), and molecular function (MF). The GO annotation indicated that the cellular process, cellular anatomical entity, and binding were most enriched (Supplementary Figure S3). The KEGG annotation demonstrated that more than 340 (DELs) and 200 (target genes) KEGG pathways were enriched, and moreover, 20 representative pathways were selected and are shown in Supplementary Figure S4, comprising some immune pathways, such as apoptosis, PI3K-AKT, MAPK-fly, lysosome, Toll and Imd, NOD-like receptor, and TGF-β signaling pathways.
It is well known that circRNAs function as miRNA sponges that regulate target gene expression by binding to miRNAs, so a total of 7,570 circRNAs targeting 2,743 miRNAs were annotated through the interaction prediction. The GO functional annotation of the host genes generated for DECs were also categorized into three types, biological process, cellular component, and molecular function, indicating that DECs were enriched in cellular process, cellular anatomical entity, response to stimulus, catalytic activity, binding, molecular transducer activity, transporter activity, signaling, immune system process, biological regulation, metabolic process, and regulation of biological process (Supplementary Figures S5A–F). For KEGG analysis, the results revealed that the top 20 pathways of DECs distributed in innate immune pathways, metabolism-related pathways, and detoxification-related pathways among the various comparison groups, including apoptosis, lysosome, Toll and Imd, NOD-like receptor, caffeine metabolism, metabolism of xenobiotics by cytochrome P450, nitrogen metabolism signaling pathways, and so forth (Supplementary Figures S5G–L).
Finally, as shown in Table 1, we summarized different numbers of DELs and DECs in innate immune signaling pathways, suggesting that they might be involved in immune activation or regulation, which provide significant implications for the understanding their underlying immune regulation in R. pedestris.
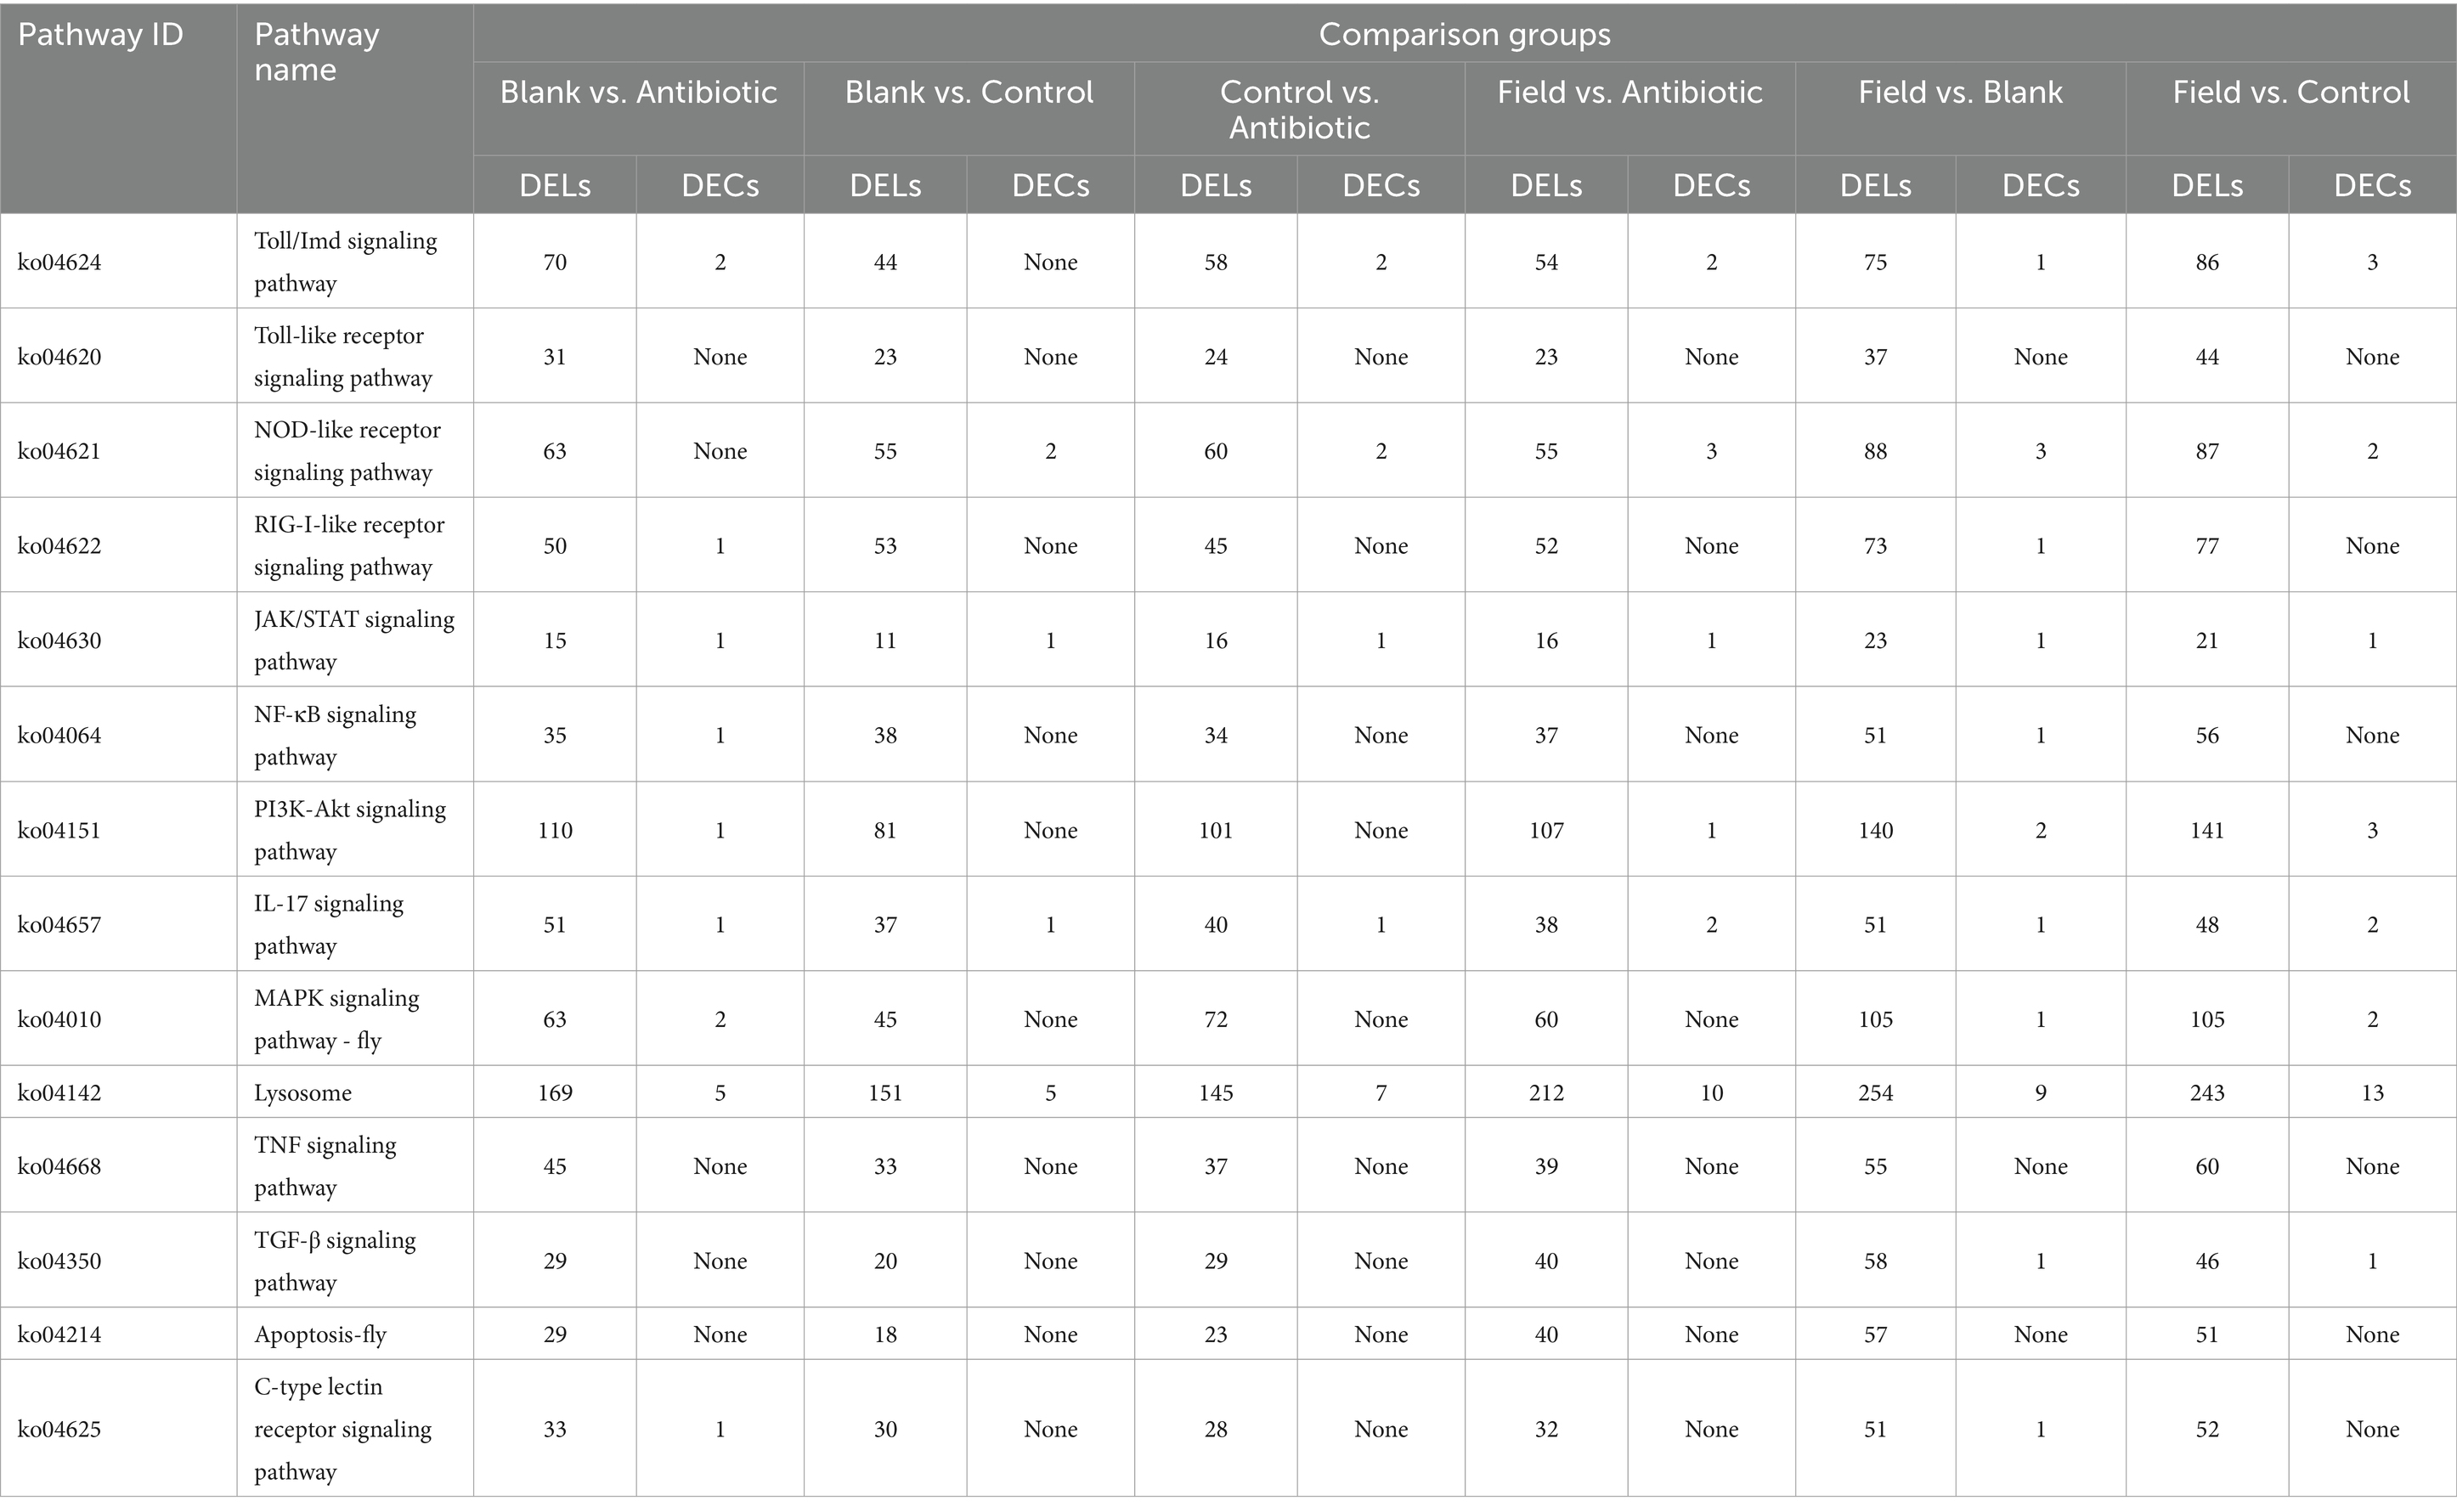
Table 1. Summary the number of DELs and DECs in immune-related pathways.
3.4 Identification and characterization of defensin and lysozyme family genesIn the present research, we identified a total of five defensins from WTS data in the R. pedestris gut, namely, Def-1, Def-2, Def-3, Def-4, and Def-5, and of them, Def-5 was reported in a previous study (Futahashi et al., 2013). The characteristics of cDNA and protein sequences, such as sequence length, molecular weight, theoretical isoelectric point, domain locations, and NCBI accession numbers, are summarized in Table 2. In detail, the cDNA sequences of defensins varied from 291 bp (Def-1) to 222 bp (Def-5), encoding 96 amino acids (aa) to 73 aa with MWs from 10.62 to 5.87, respectively. Furthermore, five R. pedestris defensins were observed to possess a 17 or 18 aa signal peptide and a typical defensin-like (DEFL) domain (nearly 30 aa) that has six conserved cysteines for forming intrachain disulfide bonds (Supplementary Figure S6A), with positive or negative hydropathicity. Reasonable 3D models of all R. pedestris defensins were predicted and selected, revealing that their structures contain different numbers of alpha helixes and beta strands (Figures 3A,B). Here, a phylogenetic tree was performed to validate the orthologous relationships of defensins between R. pedestris and other insects, suggesting that Def-2 and Def-3, as well as Def-1 and Def-4, were clustered in the same branch, and Def-5 grouped with the corresponding defensins of Anopheles gambiae and A. quadriannulatus (Figure 3C).

Table 2. The characterization of cDNA and protein sequences of defensin and lysozyme family genes.
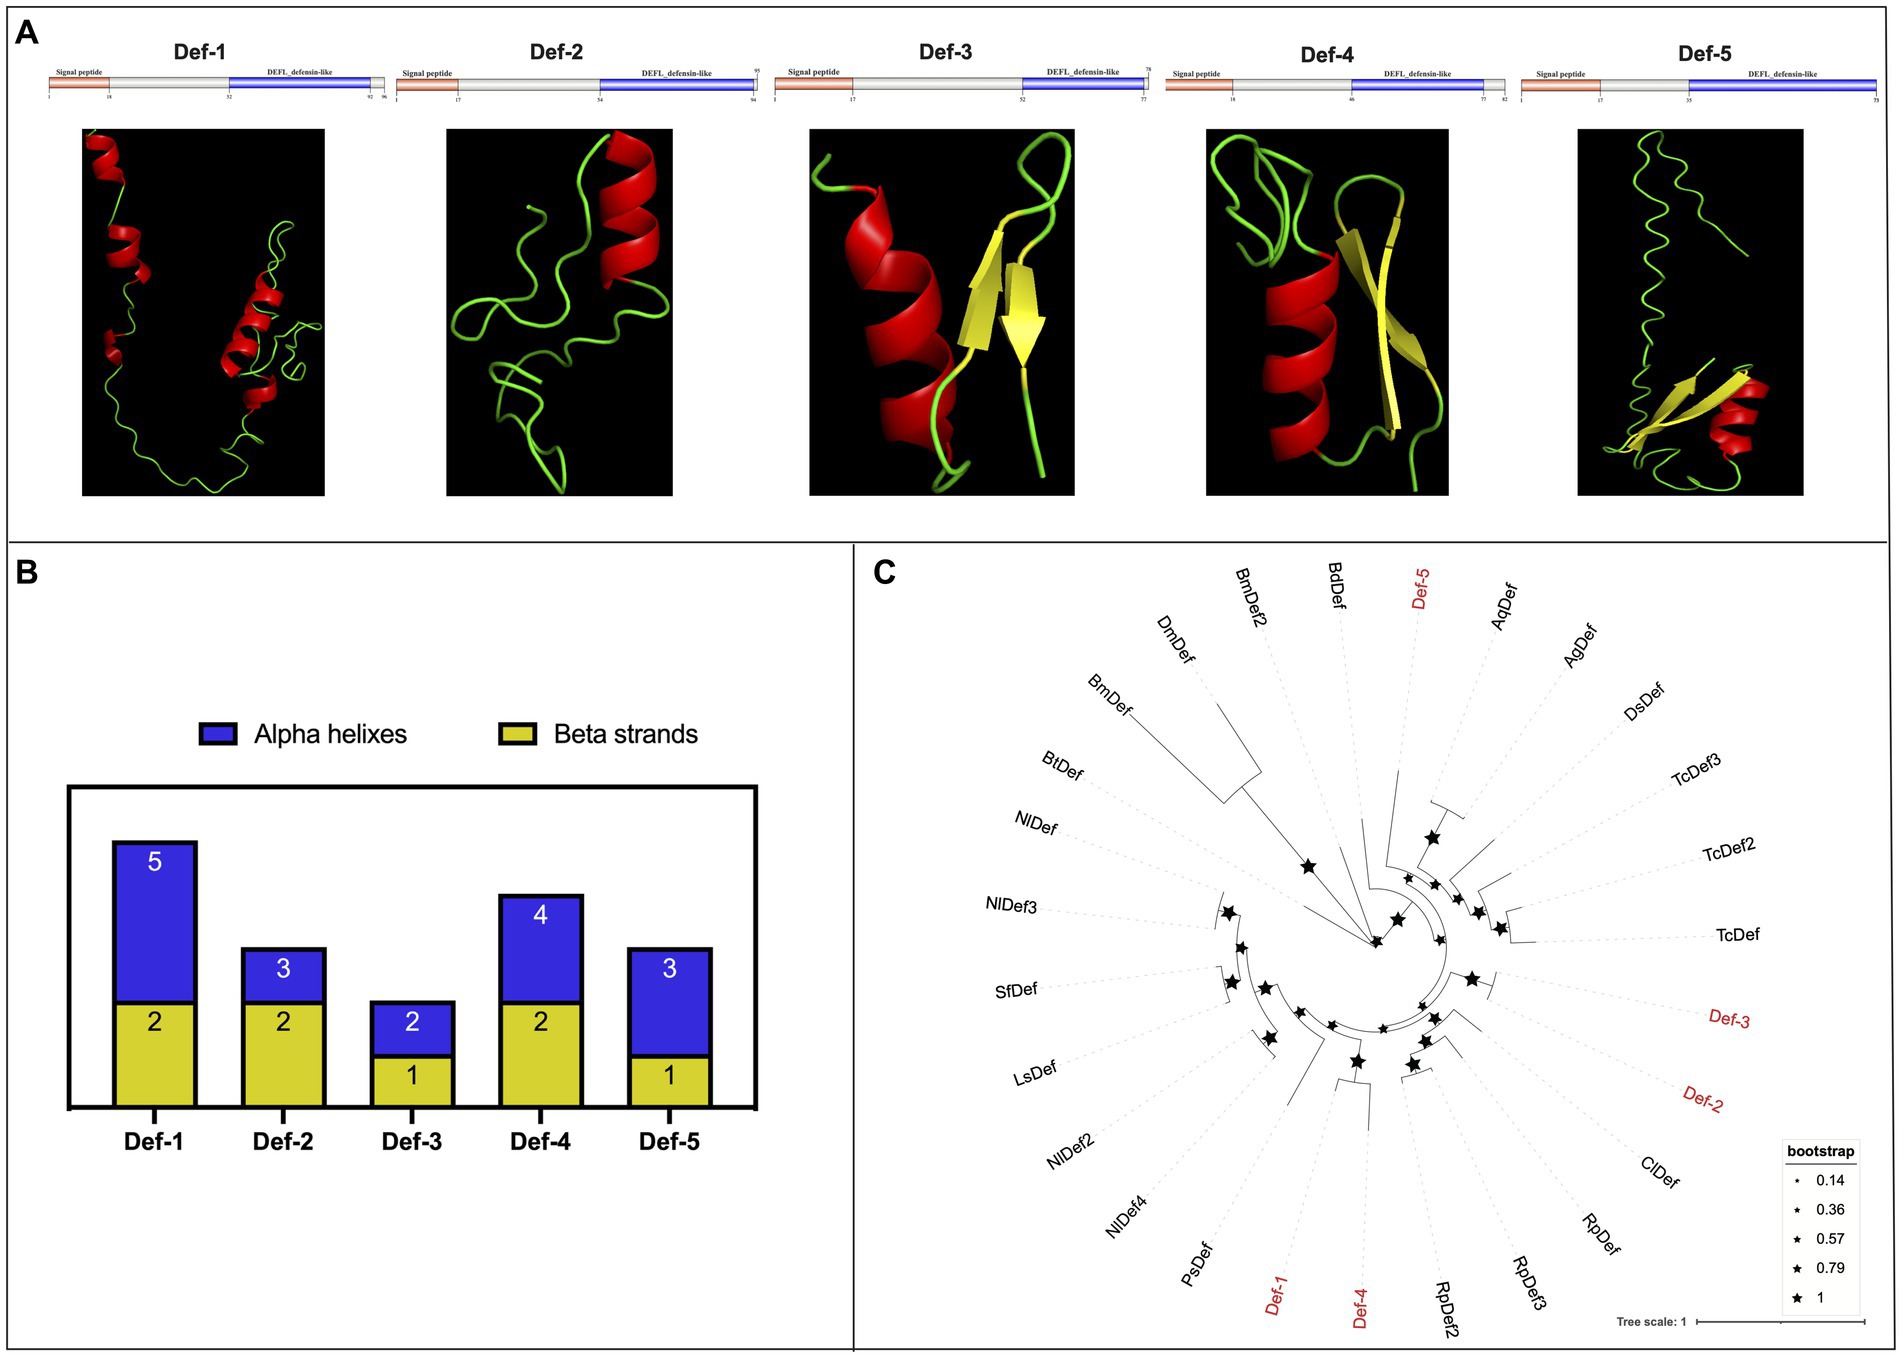
Figure 3. Protein structures and phylogenetic analysis of defensins. (A) Schematic and tertiary structures of five defensin proteins of R. pedestris. 3D models and schematic representation of the domain topology of all defensins were generated and predicted using SWISSMODEL and SMART, indicating alpha-helix (red), beta-fold (green), and random coil (yellow). SP: signal peptide. (B) Summary of the number of alpha helixes and beta strands of five defensin proteins in R. pedestris. (C) Phylogenetic relationships of defensins from R. pedestris and other insects. The phylogenetic tree was built using MEGA 9.0 and 1,000 bootstrap support replicates. The value bar represents the genetic distance, and only branch support values for the main branches are shown by black pentacles with proportional sizes. Five R. pedestris defensins are indicated in red, and the GenBank accession numbers used for phylogenetic tree construction are found in Supporting Information: Supplementary Table S4.
Next, a total of eleven lysozyme family genes were selected and characterized in R. pedestris, which were classified into three subfamilies, I-type (LyzI-1 to −4), C-type (LyzC-1 to −4) and B-type (LyzB-1 to −3), of which, LyzC-3 and LyzC-4 have been reported in Futahashi et al., 2013. Concretely, the cDNA length of all lysozymes ranged from 675 bp (LyzB-2) to 459 bp (LyzI-2), and their protein length ranged from 224 aa to 152 aa with negative hydropathicity (Table 2). Among these lysozymes, the pI values ranged from 9.32 (LyzB-3) to 4.73 (LyzI-1), and LyzB-2 (25.05) and LyzI-2 (16.92) possess the largest and smallest molecular weights, respectively. The results of domain prediction showed that the I-type lysozymes have a signal peptide motif and Destabilase domain, which contains ten conserved cysteines that form disulfide bonds (Figures 4A and Supplementary Figure S6B). As shown in Figures 4B and Supplementary Figure S6C, the C-type lysozymes shared a typical invertebrate LYZ_C_invert domain, which has seven conserved cysteines to form disulfide bonds, while a signal peptide or transmembrane region existed in three C-type lysozyme members of R. pedestris. The signal peptide and Glyco_hydro_25 (GH 25) domain consisted of all B-type lysozymes (Figures 4C and Supplementary Figure S6D). Moreover, the 3D protein structures of eleven lysozymes were constructed with the online programs (Figures 4A–C), showing that each B-type lysozyme has eight alpha helixes and eight beta strands in R. pedestris, composed of eight β-strands and six α-helices in the Glyco_hydro_25 (GH 25) domain. LyzI-2, LyzI-3 and LyzI-4 consist of seven alpha helixes and one beta strand, while LyzI-1 contains more alpha helixes than other I-type lysozymes and one beta strand in R. pedestris because the Destabilase domain of I-type lysozyme is commonly characterized by six α-helices and one β-strand. The total number of alpha helixes and beta strands of R. pedestris LyzC-3 was than in other C-type lysozymes (Figure 4D). Finally, a phylogenetic tree was constructed using the protein sequences of three lysozyme subtypes from R. pedestris and other insects using the NJ method and 1,000 bootstrap replicates, supporting that all selected lysozymes were grouped together in each well-supported clade along with three distinct subfamilies, as our classification, with higher branch support values (Figure 4E).
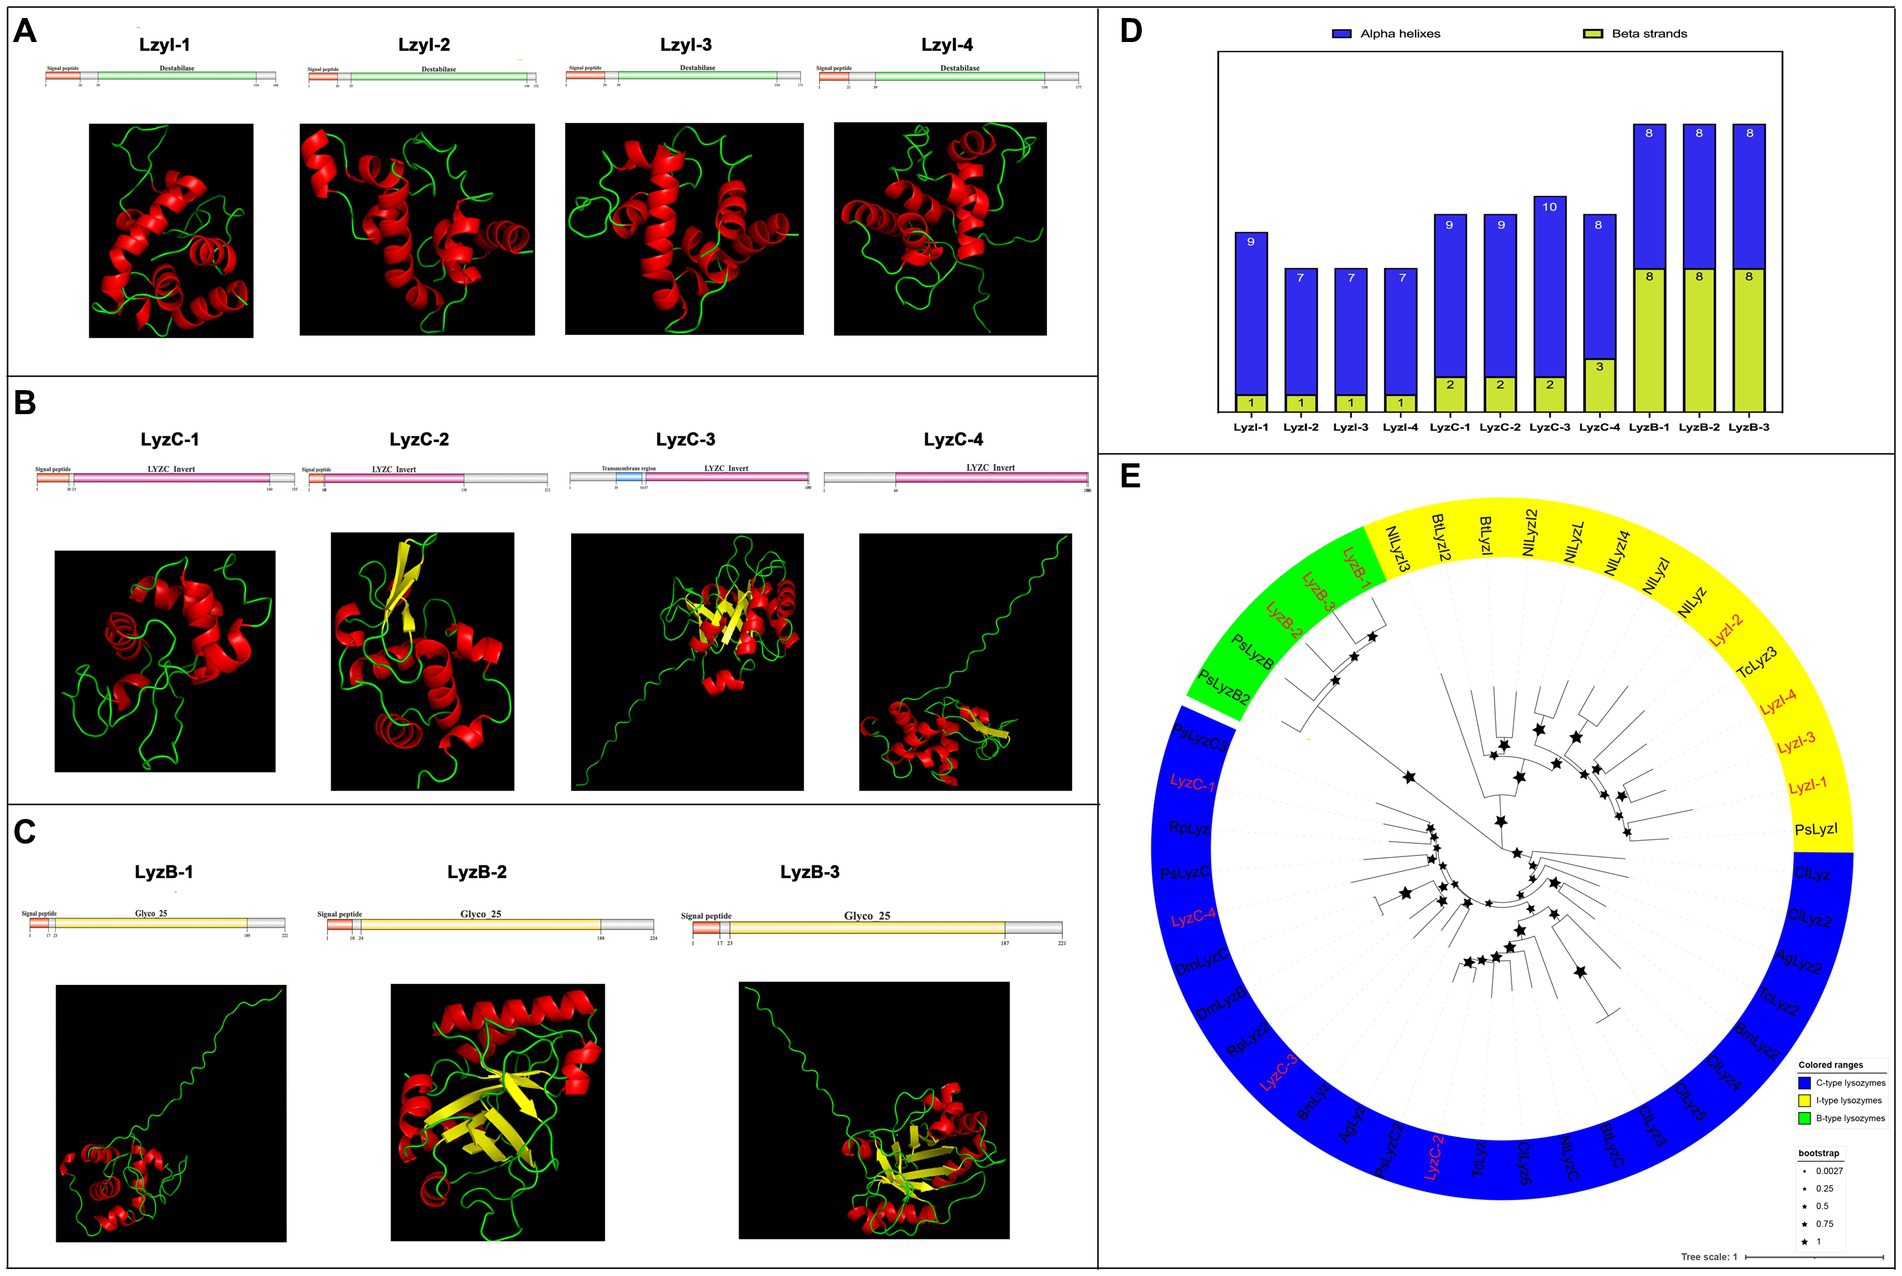
Figure 4. Protein structures and phylogenetic analysis of lysozymes. Schematic and tertiary structures of four I-type lysozymes (A), C-type lysozymes (B), and B-type lysozymes (C) of R. pedestris. 3D models and schematic representation of the domain topology of all lysozymes were generated and predicted using SWISSMODEL and SMART, indicating alpha-helix (red), beta-fold (green) and random coil (yellow). SP, Signal peptide; TM, Transmembrane region. (D) Summary of the number of alpha helixes and beta strands of lysozyme proteins in R. pedestris. (E) Phylogenetic relationships of lysozymes from R. pedestris and other insects. The phylogenetic tree was built using MEGA 9.0 and 1,000 bootstrap support replicates. The value bar represents the genetic distance, and only branch support values for the main branches are shown by black pentacles with proportional sizes. All different types of R. pedestris lysozymes are indicated in red, and GenBank accession numbers used for phylogenetic tree construction are found in Supporting Information: Supplementary Table S4. I-type lysozymes, C-type lysozymes, and B-type lysozymes of selected insects are highlighted in yellow, blue and green, respectively.
3.5 Expression and correlated analyses of defensins and lysozymesFirst, overall expression patterns of defensins and lysozymes showed that Def-2, Def-3, Def-5, LyzC-3, LyzC-4, and LyzB-1 exhibited relatively high distributions (FPKM values more than 100) among all the experimental groups (Figure 5A). On the contrary, Def-4, LyzI-3, LyzC-1, and LyzC-2 were relatively low expression (FPKM values less than 1) among all the treatment groups. Of note, the expression levels of Def-1 and Def-4 were not detected in Antibiotic group. To investigate the differentially expressed patterns of defensin and lysozyme family genes in the R. pedestris gut under different rearing conditions, bar charts were generated using log2 (fold change) values based on WTS data (Figure 5B). Concretely, a total number of 32 DE defensins and 30 DE lysozymes were identified from the Field group compared to the Control and Blank groups. Only one AMP, LyzB-3, differentially expressed in the F vs. A group. In addition, there were different numbers of DE defensins and lysozymes in the B vs. A and C vs. A groups, but we only selected DE LyzB-1 and LyzB-2 without DE defensins in the B vs. C group.
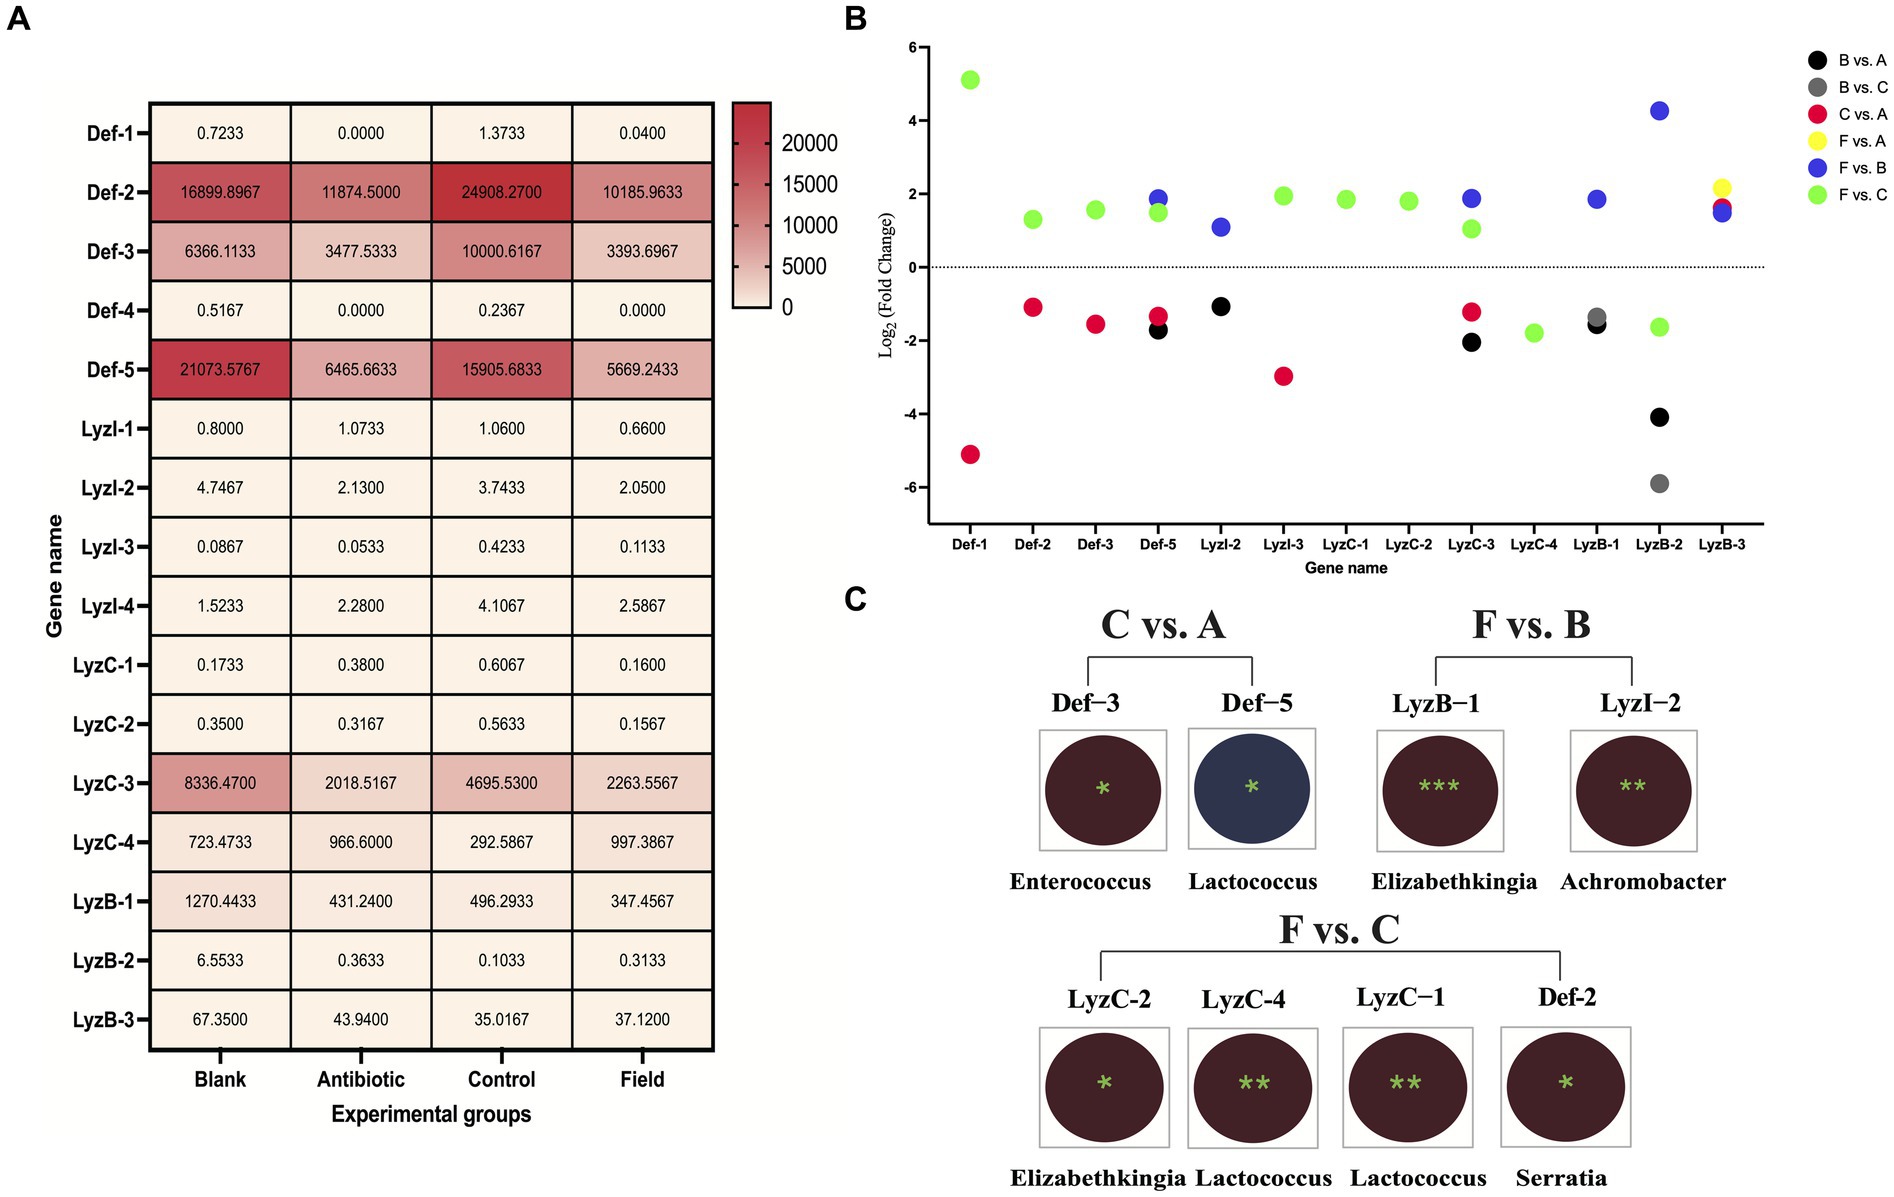
Figure 5. Expression and correlated analyses of defensins and lysozymes. (A) Expression heatmap of defensins and lysozymes under four rearing conditions in R. pedestris guts. All grids, with different colors corresponded to different expression levels, shown by FPKM values as mean (N = 3). (B) Expression profiles of DE defensin and lysozyme family genes among the six comparison groups. X-axis: the name of DE AMP genes, Y-axis: Log2 (Fold Change) values of all above DE AMP genes. Different circle colors represent different comparison groups, including B vs. A, B vs. C, C vs. A, F vs. A, F vs. B, and F vs. C. (C) Integrated analyses of gut bacterial changes and two DE AMP genes from C vs. A, F vs. B, and F vs. C groups with Pearson correlation coefficients using R software (version 2.15.3) in the R. pedestri guts under different rearing conditions. Red and blue colors represent negative and positive correlation, respectively, and the correlation significance is shown by *** (p < 0.001), ** (p < 0.01), and * (p < 0.05).
The Pearson correlation coefficients were estimated to investigate the correlation of above DE AMPs and most changes in the gut bacterial abundance at the genus level among all the comparison groups according to WTS and 16S rRNA sequencing data, which could provide a good and reliable model to elucidate their associations in R. pedestris. As shown in Figure 5C, in the results of the F vs. C group, we found maximal significantly correlated pairs, including three DE lysozymes, one DE defensin, and three genera in gut bacteria. In the C vs. A group, two DE defensins (Def-3 and Def-5) were significantly negatively and positively associated with two genera in gut bacterial changes (Enterococcus and Lactococcus), respectively, while significantly associated pairs of lysozyme-gut bacteria were not observed. Conversely, only two DE lysozymes (LyzB-1 and LyzI-2) were significantly negatively associated with changes in Elizabethkingia and Achromobacter genera, respectively.
Finally, a total of three DE AMPs, four DELs and two DECs were selected for qRT–PCR validation, and the results showed that their expression trends were consistent with WTS data (Supplementary Figure S7).
3.6 The potential ncRNA-mediated networks of defensins and lysozymesBased on the negatively regulatory mechanism between miRNAs and corresponding target genes, a total number of twenty-nine miRNA–defensin and seventy-four miRNA–lysozyme pairs were predicted and selected to construct a interaction network, containing all defensin and lysozyme genes in R. pedestris (Supplementary Figure S8A). Subsequently, a ceRNA network of lncRNA–miRNA–LyzI-4 pairs were found (Figure 6C and Supplementary Table S6). In brief, there were fifteen lncRNAs and two miRNAs in this network, and LTCONS_00019574 target to both novel-miRNA-154-5p and novel-miRNA-111-5p for indirectly regulating the LyzI-4 expression. The basic information of above lncRNAs is summarized in Table 3, showing that they ranged from 12,896 nt (LTCONS_00033484) to 1,092 nt (LTCONS_00026728) in length and distributed on different chromosomes of R. pedestris, and some of them were classified into cis_overlap and cis_down20K. Besides, the precursor and mature sequences of novel-miRNA-154-5p and novel-miRNA-111-5p are both 56 nt and 22 nt in length, respectively, exhibiting typical stable stem-loop secondary structures (Supplementary Figure S8B).
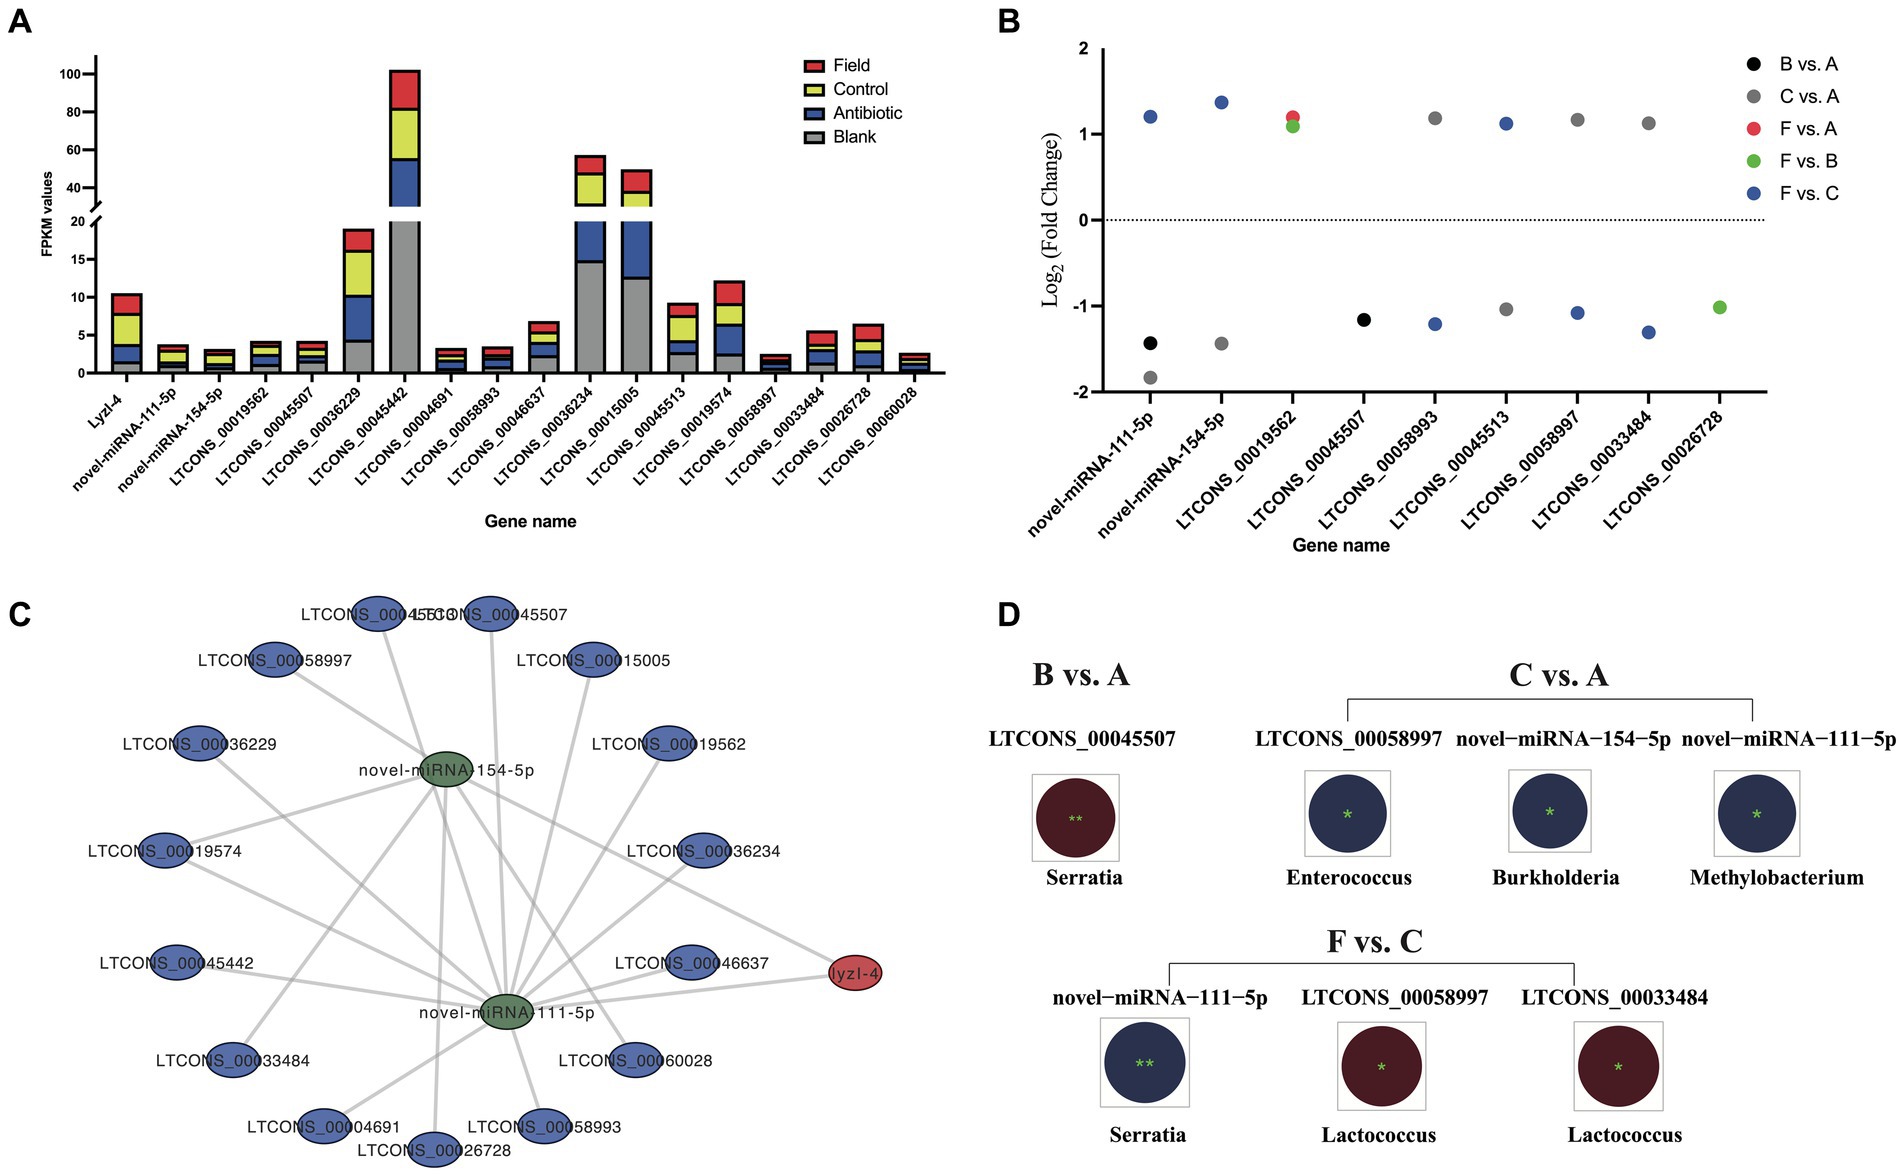
Figure 6. The ceRNA network of lncRNA–miRNA–lyzI-4. (A) The expression levels of the ceRNA network of all lncRNAs, miRNAs and lyzI-4 among four experimental groups. X-axis: the ceRNA network of all lncRNA, miRNA and lyzI-4, Y-axis: FPKM values. (B) Differential expression of lncRNAs and miRNAs for ceRNA construction among the six comparison groups. X-axis indicates the name of DELs and DECs, and Y-axis indicates Log2 (Fold Change) values of corresponding DELs and DECs. Different circle colors represent the different comparison groups, including B vs. A, C vs. A, F vs. A, F vs. B, and F vs. C. (C) The ceRNA networks of lyzI-4 based on WTS annotation and target prediction by Cytoscape software (version 3.9.1). The red node indicates lyzI-4, the green nodes indicate miRNAs, and the blue nodes indicate lncRNAs. (D) Integrated analysis of gut bacterial changes and above DELs and DECs from the B vs. A, C vs. A, and F vs. C groups with Pearson correlation coefficients using R software (version 2.15.3) in the R. pedestri gut samples under different rearing conditions. Red and blue colors represent the negative and positive correlation, respectively, and the correlation significance is shown by ** (p < 0.01) and * (p < 0.05).
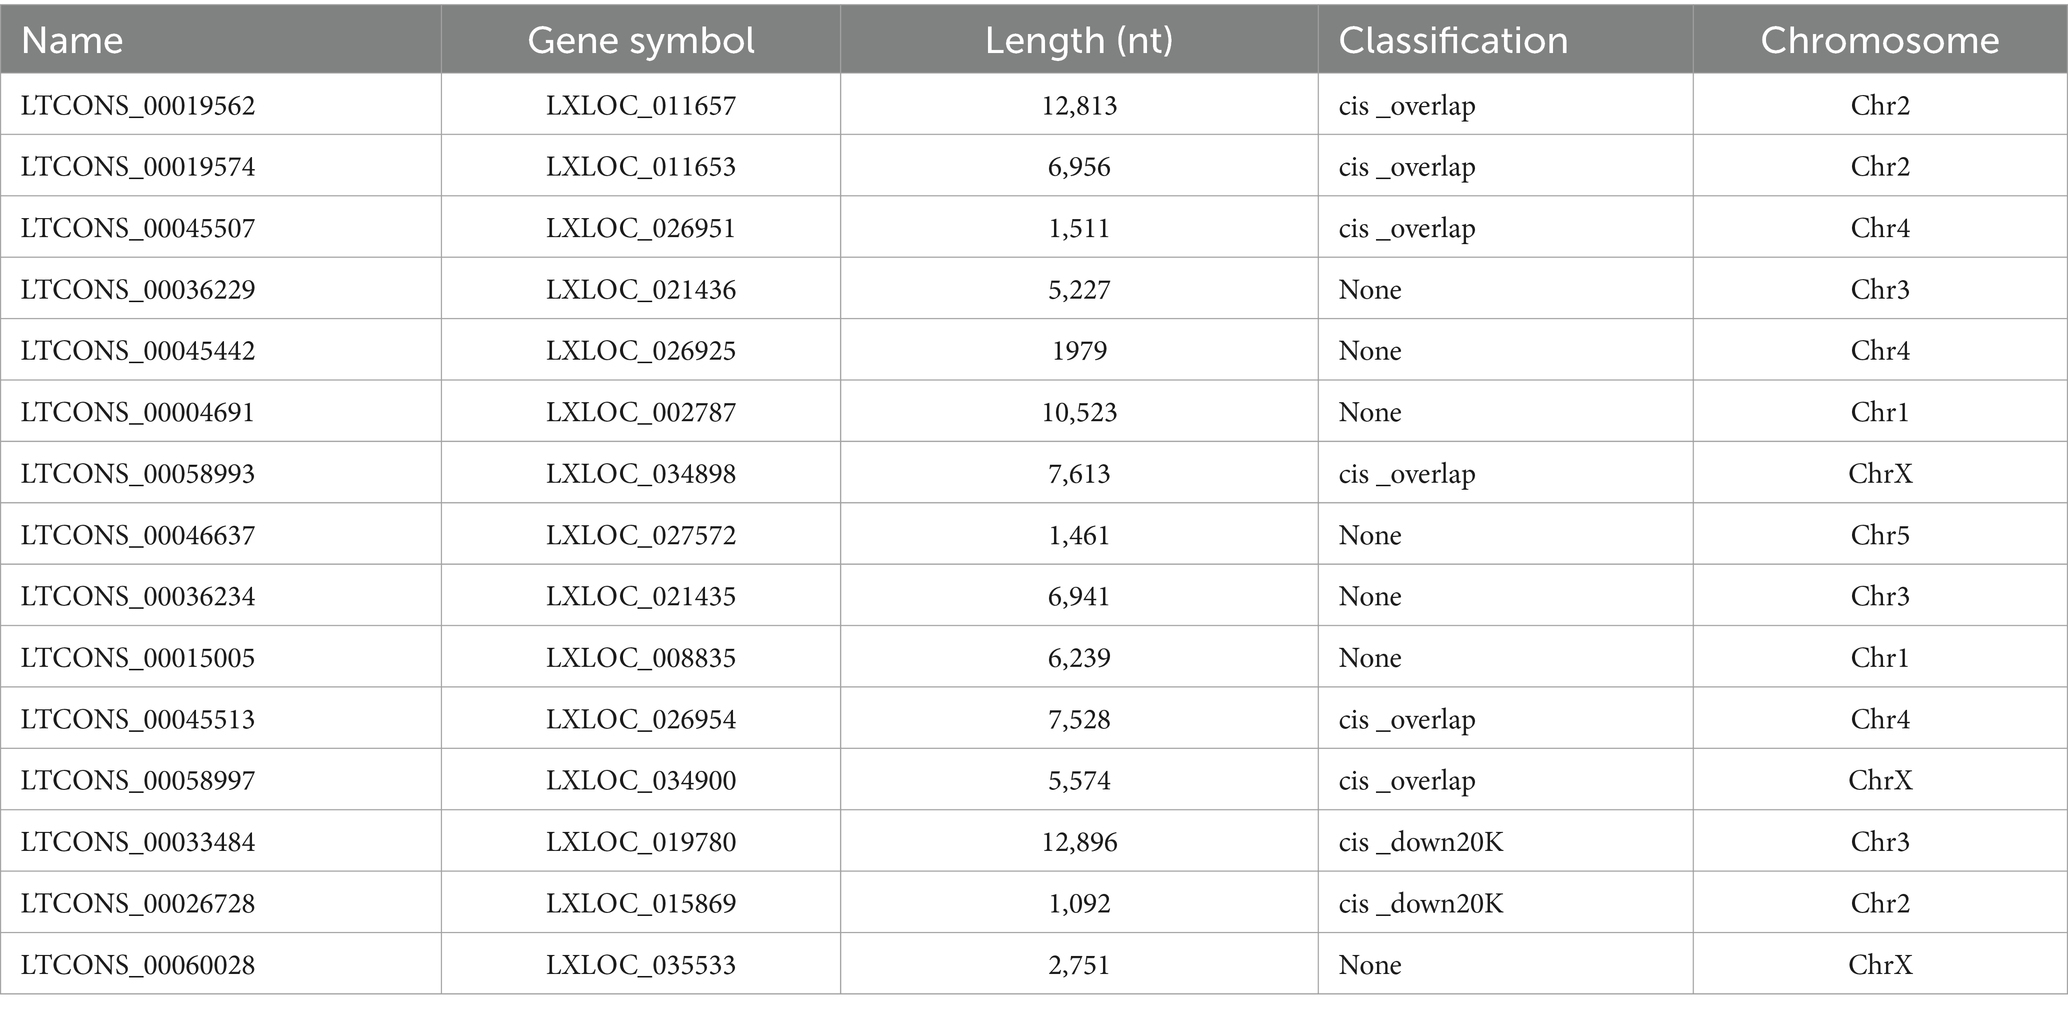
Table 3. The basic information of lncRNAs for ceRNA construction.
Overall, as shown in Figure 6A, the expression changes of above lncRNAs and LyzI-4 among all the experimental groups displayed the varying trends were observed to higher than the expression profiles of novel-miRNA-154-5p and novel-miRNA-111-5p. Of these lncRNAs and miRNAs, a total of seven DELs and two DE miRNAs (DEMs) were identified in the LyzI-4-related ceRNA network under feeding environmental changes of R. pedestris (Figure 6B). We further evaluated the correlated relationships between above DELs and DEMs, as well as most changes in the gut bacterial abundance at the genus level among all the comparison groups. Concretely, the results illustrated that DE LTCONS_00045507 was significantly negatively correlated with Serratia genus variation in the B vs. A group. Conversely, DE novel-miRNA-154-5p, novel-miRNA-111-5p and LTCONS_00058997 were significantly positively associated with changes in Burkholderia, Methylobacterium and Enterococcus genera in the C vs. A group, respectively Ultimately, the alterations in Serratia and Lactococcus genera significantly positively and negatively influenced the expression of novel-miRNA-111-5p, as well as LTCONS_00058997 and LTCONS_00033484 in the F vs. C group, respectively.
4 DiscussionRiptortus pedestris is a widely distributed pest in East Asia and result in significant yield losses to soybeans by sucking pods, so it is urgent to explore a model of the plant–insect–microbe interactions for pest management (Huang et al., 2021; Wei et al., 2023). With the rapid development of high-throughput sequencing, a deep understanding and elucidation of the biological function of ncRNAs, such as lncRNAs, circRNAs and miRNAs, which contribute to a new aspect of the adaptive evolution in insects, are rapidly improving (Hu et al., 2018; Zhang et al., 2021, 2023; Zhou et al., 2021a, 2022b). In previous reports, some AMPs were found to exert functions in distinguishing gut commensal symbionts from pathogens in R. pedestris (Kim et al., 2015; Lee et al., 2017), and a subsequent study found that its gut symbionts play complementary roles under AMP deletion (Lee et al., 2022). Here, the current study is the first to demonstrate the large-scale identification and characterization of ncRNAs and their potential interaction with R. pedestris AMPs, and the associations of gut bacterial changes at the genus level and above DE ncRNAs and AMPs under feeding environmental changes. Our work aimed to pave the way for pest control and adaptive evolution in hemipterous pests.
The lncRNA and circRNA profiles using WTS technology provide deeper insight into their regulatory mechanism under feeding environmental changes in the R. pedestris gut. First, in order to select massive lncRNAs, all clean reads from each treatment group were independently mapped to the R. pedestris reference genome, exceeding 77% mapping ratio, and moreover, the transcripts were filtered out, yielding a total of 30,599 lncRNAs and 31,139 mRNAs by protein-coding potential prediction. Meanwhile, we further obtained a total of 10,586 circRNAs, which were divided into exon circRNAs, exon_intron circRNAs, intergenic circRNAs, and intron circRNAs, and their lengths were nearly above 3,000 nt. In this study, the numbers of lncRNAs and circRNAs were more than those in other insects, but the types of these circRNAs are similar to those in model insect (Wu et al., 2016; Hu et al., 2018; Zhang J. et al., 2020; Zhang S. et al., 2020; Yin et al., 2021; Zhang et al., 2021). Furthermore, we identified abundant DELs and DECs among the six comparison groups, consisting of a total number of 5,559 upregulated DELs and 3,522 downregulated DELs as well as a total number of 339 upregulated DECs and 387 downregulated DECs in comparison between antibiotic and other treatments. Our results are in agreement with these previous findings that different numbers of DE ncRNAs were calculated from insect tissues or cells under various treatments, such as B. mori, Tribolium castaneum and Aedes aegypti (Etebari et al., 2016; Hu et al., 2018; Yin et al., 2021; Abd El Halim and Ali, 2022).
For target prediction and functional annotation of lncRNAs and circRNAs, 8,850 lncRNA–mRNA pairs, including 3,466 cis (nonoverlap) trans and 5,384 overlap pairs, and 7,570 circRNAs targeting 2,743 miRNAs were predicted in this study. Although there is much information on the lncRNAs or circRNAs involved in the regulation of innate immune responses in model insects, little is known about the mode of them in nonmodel insects. For this objective, in the present study, GO and KEGG enrichment analyses were performed to annotate the function of above DELs, DECs, and their targets, suggesting that they were mainly involved in numerous immune signaling pathways, such as the Toll and Imd, NOD-like receptor, PI3K-AKT, and MAPK-fly signaling pathways. It has been revealed that insects depend on humoral immunity against pathogens, such as Toll, Imd, and JAK–STAT, which are the most important signaling cascades for the immune response and metabolism (Yang and Hultmark, 2017). In keeping with our data, GO and KEGG analyses were also used to explore the biological functions and potential mechanisms of circRNAs in BmCPV-infected B. mori midguts and fat bodies, important metabolic and immune organs in maintaining normal physiological functions, suggesting that abundant immune circRNAs were identified in response to BmCPV infection using circRNA sequencing (Hu et al., 2018; Yin et al., 2021). In addition, a total of 7,448 DELs and 12,263 lncRNA–mRNA pairs were predicted and obtained based on cis-regulation analysis in the normal and BmNPV-infected BmN cells, some of which contributed to immune and metabolic processes according to GO and KEGG enrichment analyses (Zhang S. et al., 2020). The red flour beetle, T. castaneum, was also found to be a useful model for several biological research areas because it is one of the major pests of stored agricultural products, generating numerous DELs and target genes potentially related to immune priming under bacterial infection (Abd El Halim and Ali, 2022). Notably, in this research, as DECs were not annotated in some innate immune pathways, it is possible that circRNAs cannot involve in the regulation of these pathways in response to environmental variations in the R. pedestris gut. Overall, all these data on differential expression, target prediction, and functional annotation of lncRNAs and circRNAs in the R. pedestris gut could provide new evidence on insect adaption to environmental changes by post-transcriptional regulation.
Studies on insect AMPs, known as the ‘backbone’ of the innate immune system, have attracted our attention, and to date, there are 98 types of AMPs from insect cells or tissues under different developmental phases, such as Hyalophora cecropia, D. melanogaster, A. gambiae, T. castaneum and Apis mellifera (Azmiera et al., 2022). In general, AMPs are small amino acid sequences that are positively charged (cationic) due to the prevalence of basic amino acids, such as arginine, lysine, and histidine, and they are classified into four subtypes: α-helical peptides (cecropin and moricin), cysteine-rich peptides (insect de
留言 (0)