
記住我


Hepatocellular carcinoma (HCC) accounts for 85%–90% of primary liver cancer, making it the fourth most common and second deadliest cancer in China (1). Hepatitis virus infection, alcohol consumption, non-alcoholic steatohepatitis, and older age mainly lead to liver cirrhosis, which is the main risk factor of HCC (2). Most hepatitis B virus (HBV)-induced HCC patients have a background of cirrhosis in China (3). HBV infection accounts for 63.9% of cancer deaths and cases in China (4).
The current guidelines recommend a monitoring interval of 6 months (3, 5, 6) for patients with liver cirrhosis. Widely available monitoring tests include tumor markers such as alpha fetoprotein (AFP) as well as various imaging techniques including ultrasound (US), computed tomography (CT), and abdominal magnetic resonance imaging (MRI). Clinical cohort studies support a biannual HCC monitoring strategy based on ultrasound (US), which improves the clinical outcomes at a reasonable cost (7, 8). Compared to annual CT, the combination of AFP and biannual US monitoring is more sensitive in detecting HCC (9). However, the advantages of the US strongly depended on the quality of the equipment and the professional knowledge of ultrasonic instruments (10). It was more cost-effective of a clinical scoring system to screen high-HCC-risk patients with cirrhosis before the diagnostic performance of US.
There is no clinical application of the HCC scoring system only applying for patients with HBV-related cirrhosis, which comprised a huge Chinese population. Currently, many models have been reported to predict HCC risk based on different etiologies. Toronto HCC risk index (THRI) scoring system (10) and our previous research (11) were applied to assess HCC risk in patients with all-cause cirrhosis. The AASL (age, albumin, sex, and liver cirrhosis)-HCC scoring system (12), real-world risk score for hepatocellular carcinoma (RWS-HCC) (13), and Chinese University (CU)-HCC score (14) were used for the prediction of HCC risk in CHB patients, taking cirrhosis into account. However, the risk of HCC varied among patients with cirrhosis of different etiologies. It is somewhat limited that these models were applied for patients with HBV-related cirrhosis (15). We are committed to develop a HCC predictive model to provide better choices for this group of patients with HBV-related cirrhosis. Moreover, from the perspective of statistical methods, these models were established using Cox proportional risk regression and Kaplan–Meier (KM) survival curve analysis and overestimated the cumulative risk of HCC (16). KM survival curves may not capture the event of interest following the occurrence of a competing event.
Liver cirrhosis is a multistate disease model, and the mortality rate increases as the disease progresses (16). Moreover, death before HCC is non-negligible, and it should always be considered a competing risk to correctly assess the HCC risks. Herein, using a large clinical cohort of HBV-related cirrhosis patients (n = 1401) with long-term follow-up (median, 69.9 months), we aimed to assess the HCC cumulative incidence in the presence of competing events [cirrhosis-related death and liver transplantation (LT)]. We established and internally validated a competitive risk scoring system based on Fine and Gray regression to accurately predict up-to-10-year HCC risk among patients with HBV cirrhosis.
Materials and methodsPatient selectionA total of 1,401 patients with HBV-related cirrhosis who were admitted at Capital Medical University, Beijing You’An Hospital, from January 1, 2011 to December 31, 2014 were included. Patients with cirrhosis were diagnosed through imaging and histological examination based on the etiology, medical history, clinical manifestations, and complications. According to the diagnosis time of liver cirrhosis, 1,401 patients were randomly divided into a training dataset (n = 1,017) and a validation dataset (n = 384) at a ratio of 3:1. We collected demographic and baseline clinical pathological information from all patients with cirrhosis, as shown below: age, sex, medical history, blood routine examination, liver and kidney function test, coagulation markers, alpha fetoprotein (AFP), and HBV viral DNA load as described in our previous study (11).
The standard of diagnosis for cirrhosis was based on Chinese guidelines on the management of liver cirrhosis (17), and for HCC it was based on the Chinese standard for the diagnosis and treatment of primary liver cancer (18). In order to minimize inter-etiological confounding of cirrhosis, the highest known risk of HCC development was set as etiological feature according to the standard of THRI methods (10). For the purpose of this study’s analysis, patients with cirrhosis who had both chronic hepatitis B and a history of alcohol or non-alcoholic steatohepatitis were classified as chronic hepatitis B (10, 19). The inclusion criteria and the exclusion criteria were described in detail in our previous study (11), and the screening process for all patients is shown in Figure 1.
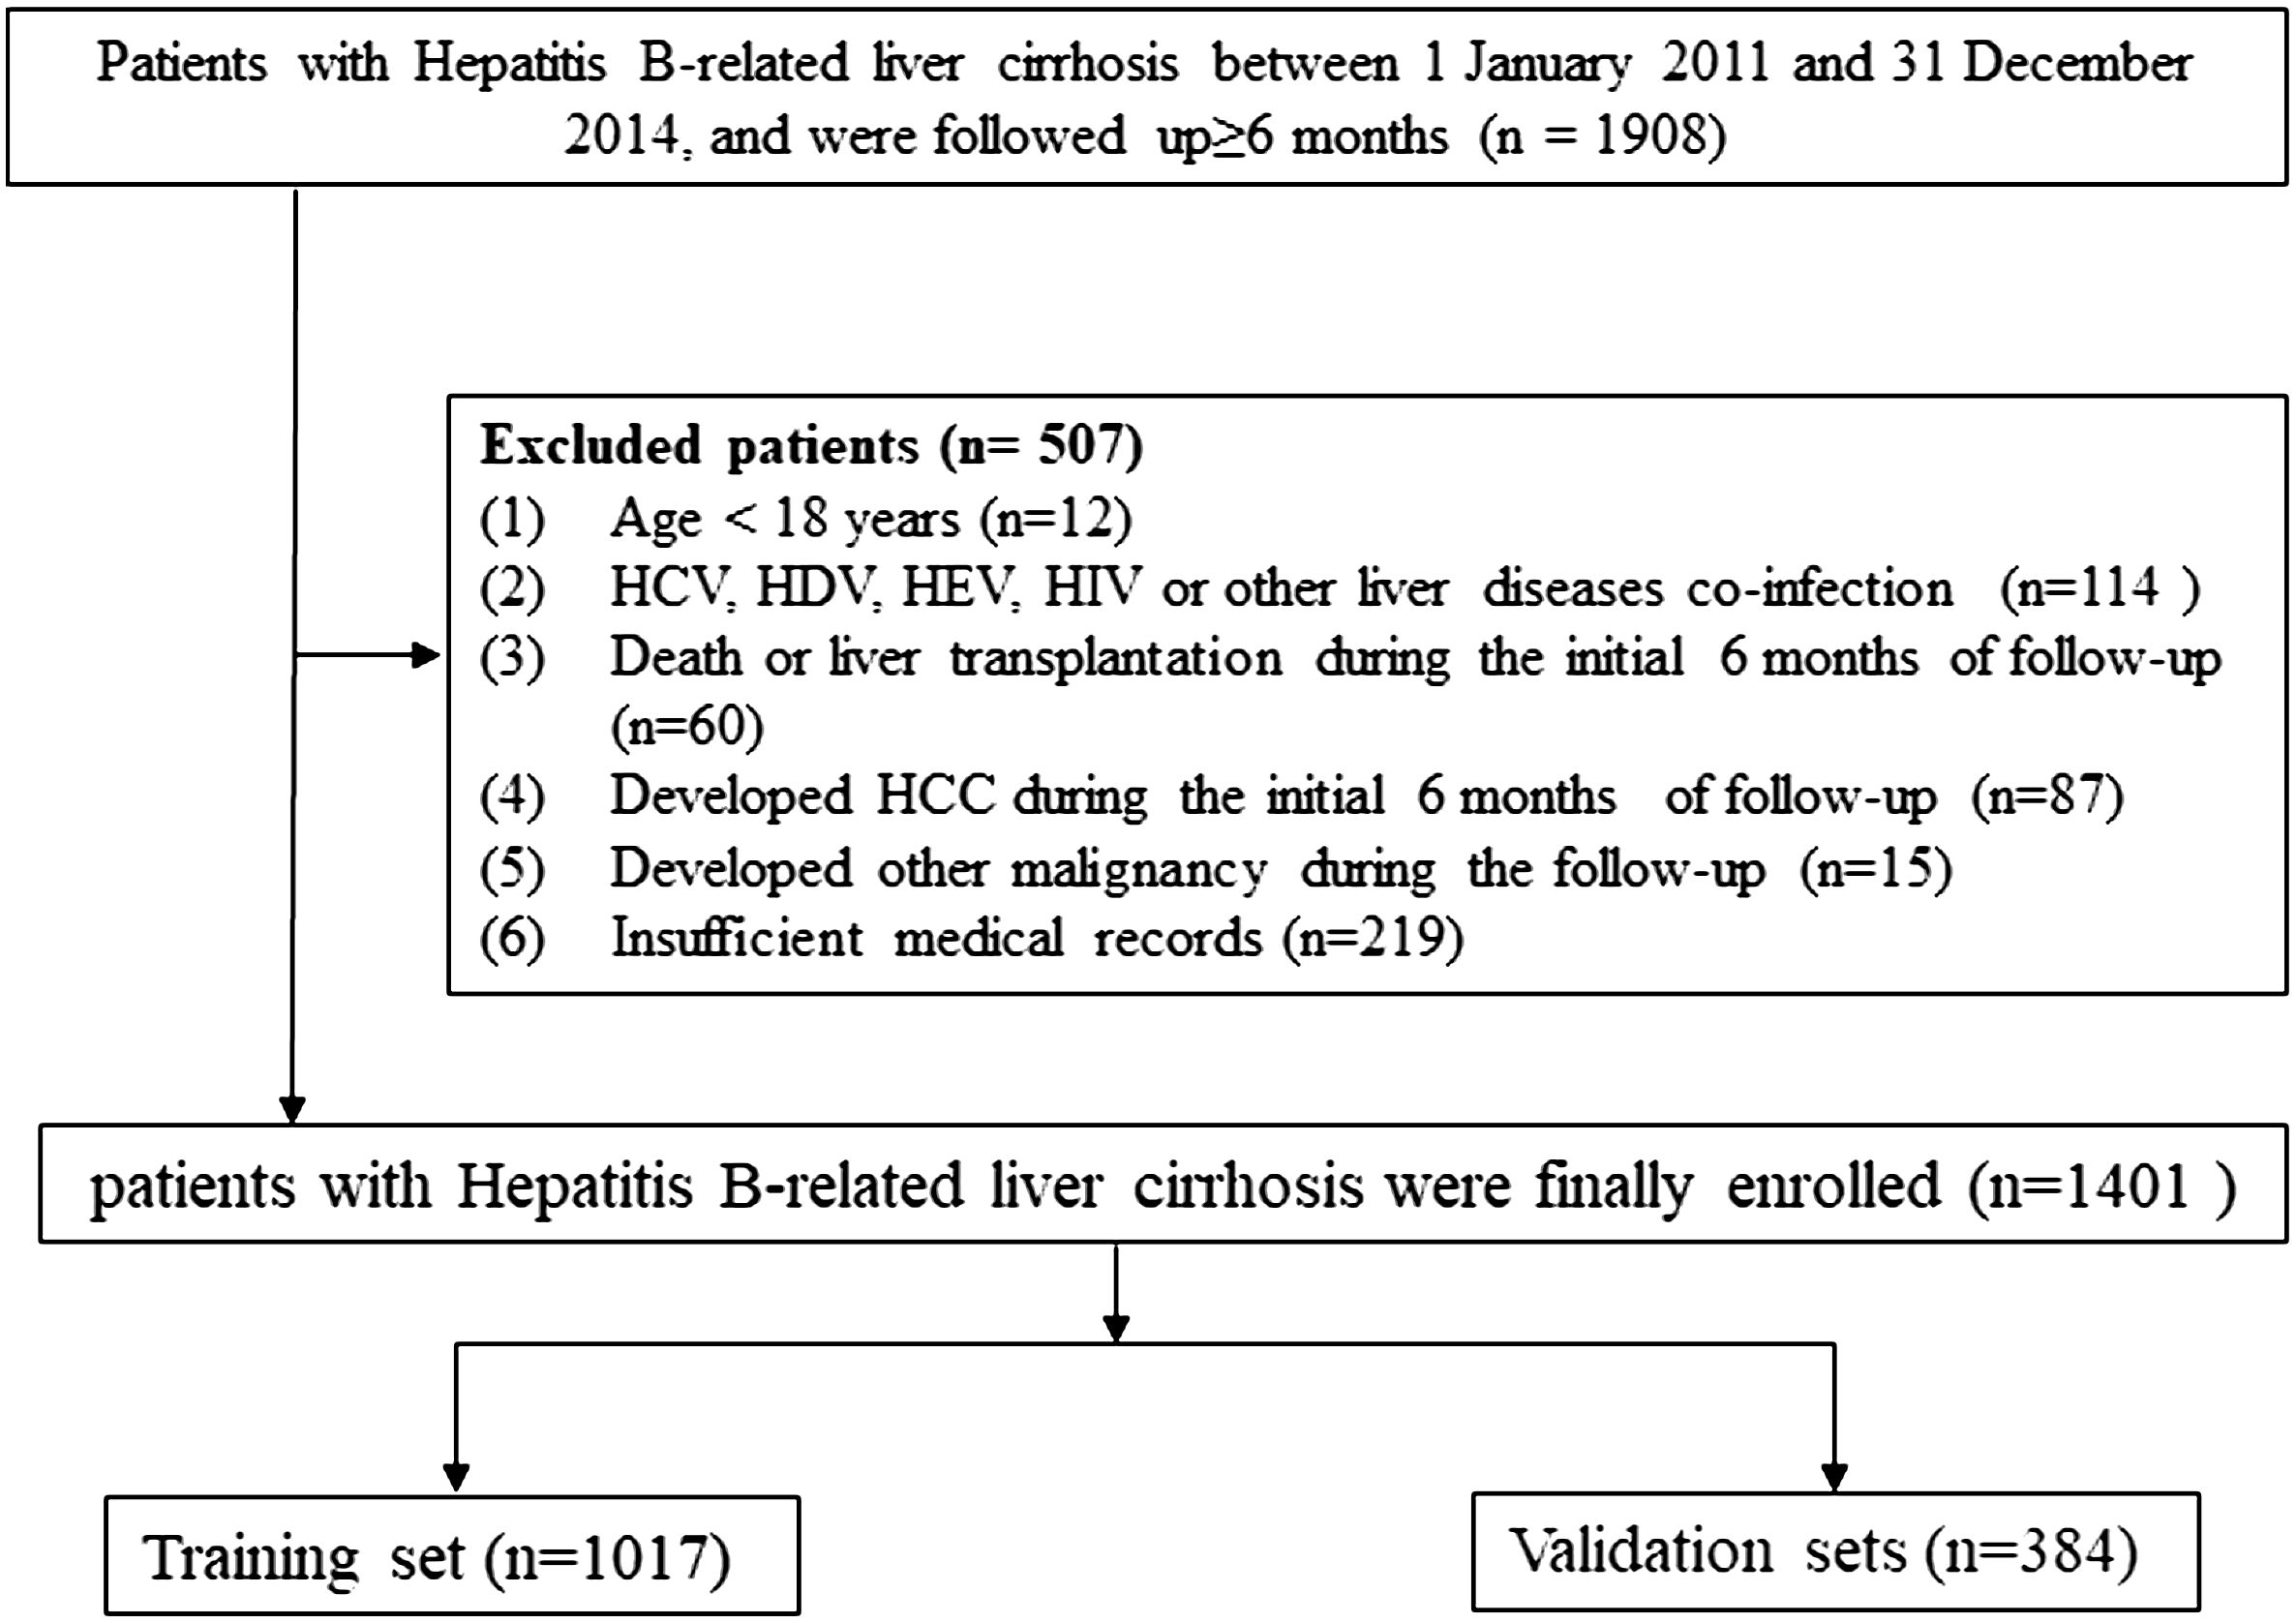
Figure 1 Flow chart of the enrollment in this study.
Outcomes and follow-up periodThe enrolled patients were followed up at the outpatient clinic every 6 months, including medical examinations, laboratory tests, and ultrasound examinations (11). We calculated the follow-up since the date of cirrhosis diagnosis to the date of event occurrence (including HCC diagnosis, HBV cirrhosis-related death, and liver transplantation) or January 1, 2020, whichever occurred first. In this study, the HBV cirrhosis-related death and LT (shown by event 2) would hinder HCC (shown by event 1). Events 1 and 2 can be considered as competing events one for the other.
Statistical analysesMissing data could increase bias and reduce the statistical power, and application of Multiple Imputation by Chained Equations (MICE) for 20 times could reduce this impact (20). Briefly, a simple imputation was first created, and each missing value was replaced with a mean value as a “place holder”. Then, the “place holder” mean imputations of the first variable were set back to missing and then replaced with predictions (imputations) from the regression model when the first variable was the dependent variable and the other variables were independent variables. Fitting models was based on the distribution of variables, logistic regression for binary variables, linear regression for continuous variables, and Poisson model for count variables. These steps of 25 iterations for each variable that had missing values would be repeated 20 times until convergence in this study. Finally, the observed values and the 20 sets of imputed values would then constitute 20 “complete” datasets. Rubin’s rules were used to pool parameter estimates, including mean deviation, regression coefficients, standard error, derive confidence intervals, and p-values. Multivariate imputation by MICE to handle missing values could reduce bias in the feature selection process.
Continuous variables were represented as mean ± standard deviation or median (interquartile range, IQR). The cutoff value of quantitative variables was selected by applying surv_cutpoint function as implemented in “survminer” package. The proportional subdistribution hazard ratios (sHR) were estimated by the Fine and Gray model (21). Univariate and multivariate competing risks regression analysis were performed to select risk factors with p-value <0.05 for constructing the final nomogram. The cumulative incidence function curve (CIF) with Fine and Gray’s test was applied to evaluate the cumulative risk of primary outcome and competing risk events between the groups. A key assumption of CIF is that only one event can occur each time, and the subsequent occurrence of other event types are precluded. The cumulative incidence function for the kth cause is defined as CIFk(t) = Pr(T ≤ t, D = k), which allowed for calculating the respective CIF of events of interest and competing risk events.
The nomogram predicted the 20, 40, 60, 80, and 100 months of HCC probability among cirrhosis patients. Discrimination and predictive accuracy were assessed using the area under the time-dependent receiver operator characteristic (ROC) curve (time-dependent AUC). The consistency was evaluated using a calibration curve with Brier scores and Harrell’s concordance index. Basing on the established model, we predicted high-risk and low-risk groups with HCC cumulative incidence rate. CIF analysis and Fine and Gray’s test were used to compare the cumulative incidence rate curves of the two groups. R (version 4.2.2) software was applied for all statistical testing and visual analysis. Extension packages, including “rms”, “cmprsk,” “riskRegression,” “pec”, and “timeROC,” were also used. A p-value <0.05 was considered statistically significant.
ResultMultiple imputation for missing data in baseline characteristicsA total of 1,401 liver cirrhosis patients, from January 1, 2011 to December 31, 2014, who met the eligibility criteria were retrospectively enrolled. We assessed the demographic, laboratory, and clinical characteristics between the original database and the 20-times-imputation datasets (Table 1). The most missing data in clinical parameters (PT, PTA, INR, fibrinogen, and thrombin time) were 130 (9.3%). The rest of the variables had a missing proportion of less than 1.57%. The negligible difference between the original database and the 20 imputed datasets allowed for the usage of the latter for predicative research of cirrhosis patients’ outcome.
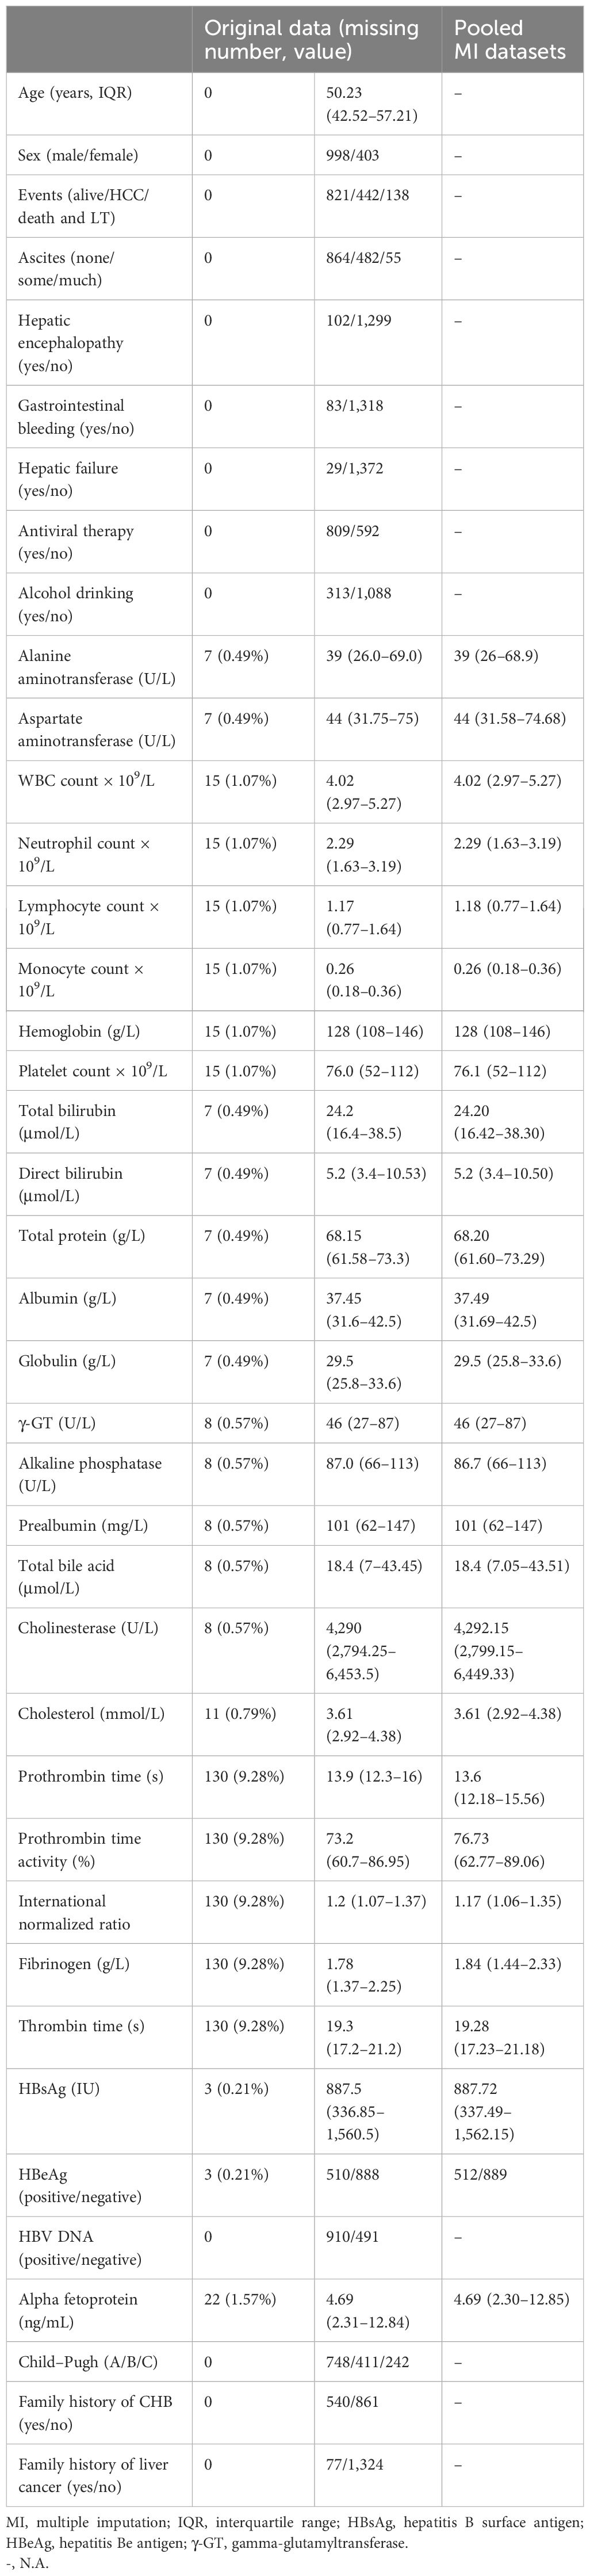
Table 1 Characteristics comparison of participants for the original database and 20 times multiple imputation datasets.
Follow−up and patient outcomesThe median follow-up time was 69.9 months (IQR: 43.8–86.6). By the end of the follow-up, 80 cirrhosis patients died and 58 received LT; therefore, 138 cases were set as competitive risk events (event 2). A total of 442 patients developed HCC and were set as event of interest (event 1). The cumulative HCC incidences of 1, 3, 5, and 7 years were 1.6% (95%CI, 1.1%–2.3%), 13.3% (95%CI, 11.6%–15.2%), 22.9 (95%CI, 20.8%–25.2%), and 32.2% (95%CI, 29.6%–35.0%), respectively. The cumulative incidences of death and LT at 1, 3, 5, and 7 years were 0.3% (95%CI, 0.1%–0.7%), 2.6% (95%CI, 1.9%–3.6%), 5.0 (95%CI, 4.0%–6.3%), and 9.1% (95%CI, 7.5%–10.8%), respectively (Figure 2). The characteristics of HCC diagnosed at the end of the follow-up are summarized in Supplementary Table S1. In the HCC stage, above 60% of patients had single or small tumors or BCLC stage A, and in about 83.2% of patients metastasis did not occur.
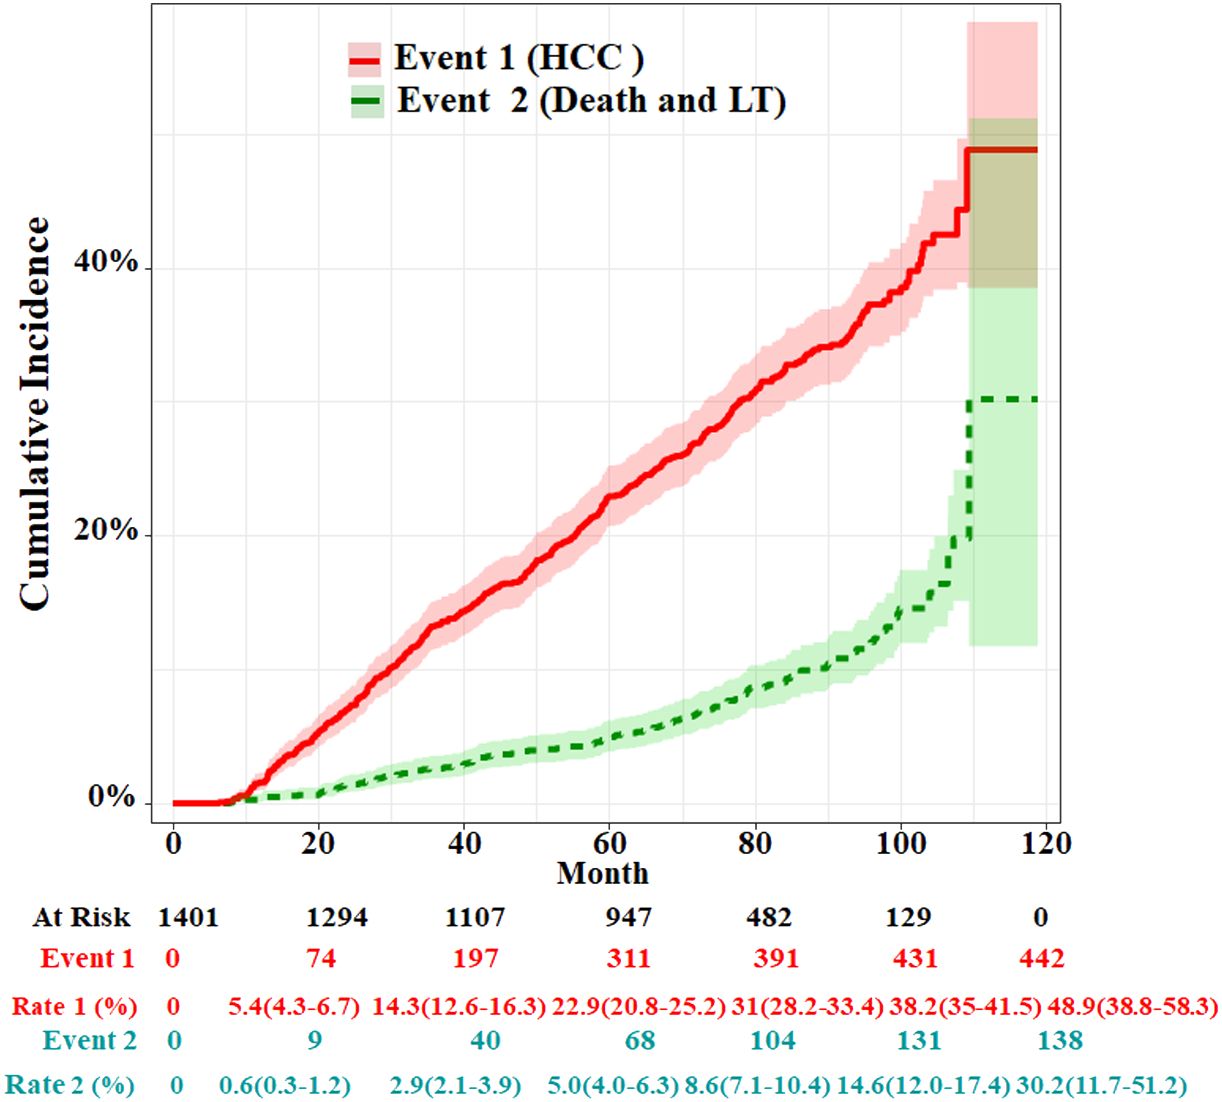
Figure 2 Cumulative incidence functions for HCC and competing risks event in the whole cohort. LT, liver transplantation.
Variable selection for predicting HCCThe univariate and multivariate competing risk regression analyses in 20 training imputed datasets were performed to select the predicting factors of HCC and estimate the respective sHRs (Table 2). Univariate analysis showed that nine variables including age, sex, antiviral therapy, alcohol drinking, family history of CHB, alanine transaminase, hepatitis B e antigen (HBeAg), hepatitis B surface antigen (HBsAg), and alpha fetoprotein (AFP) were associated with the risk of HCC. After multivariate competing risk regression analysis, six independent risk factors including age, sex, antiviral therapy history, alcohol drinking history, HBeAg, and AFP were finally identified and incorporated into the model. Cumulative incidence curve analyses of the six prognostic factors were plotted based on Fine–Gray test (Figure 3). It could be seen that the HCC risk had a statistical increase in the male group, older age (≥51 years) group, positive of HBeAg group, unacceptance of antiviral therapy group, alcohol drinking group, and high AFP level [log10 (AFP) ≥ 0.57) group (all Fine–Gray test, p < 0.05). The sHR of the prognostic factors are outlined in Table 2.
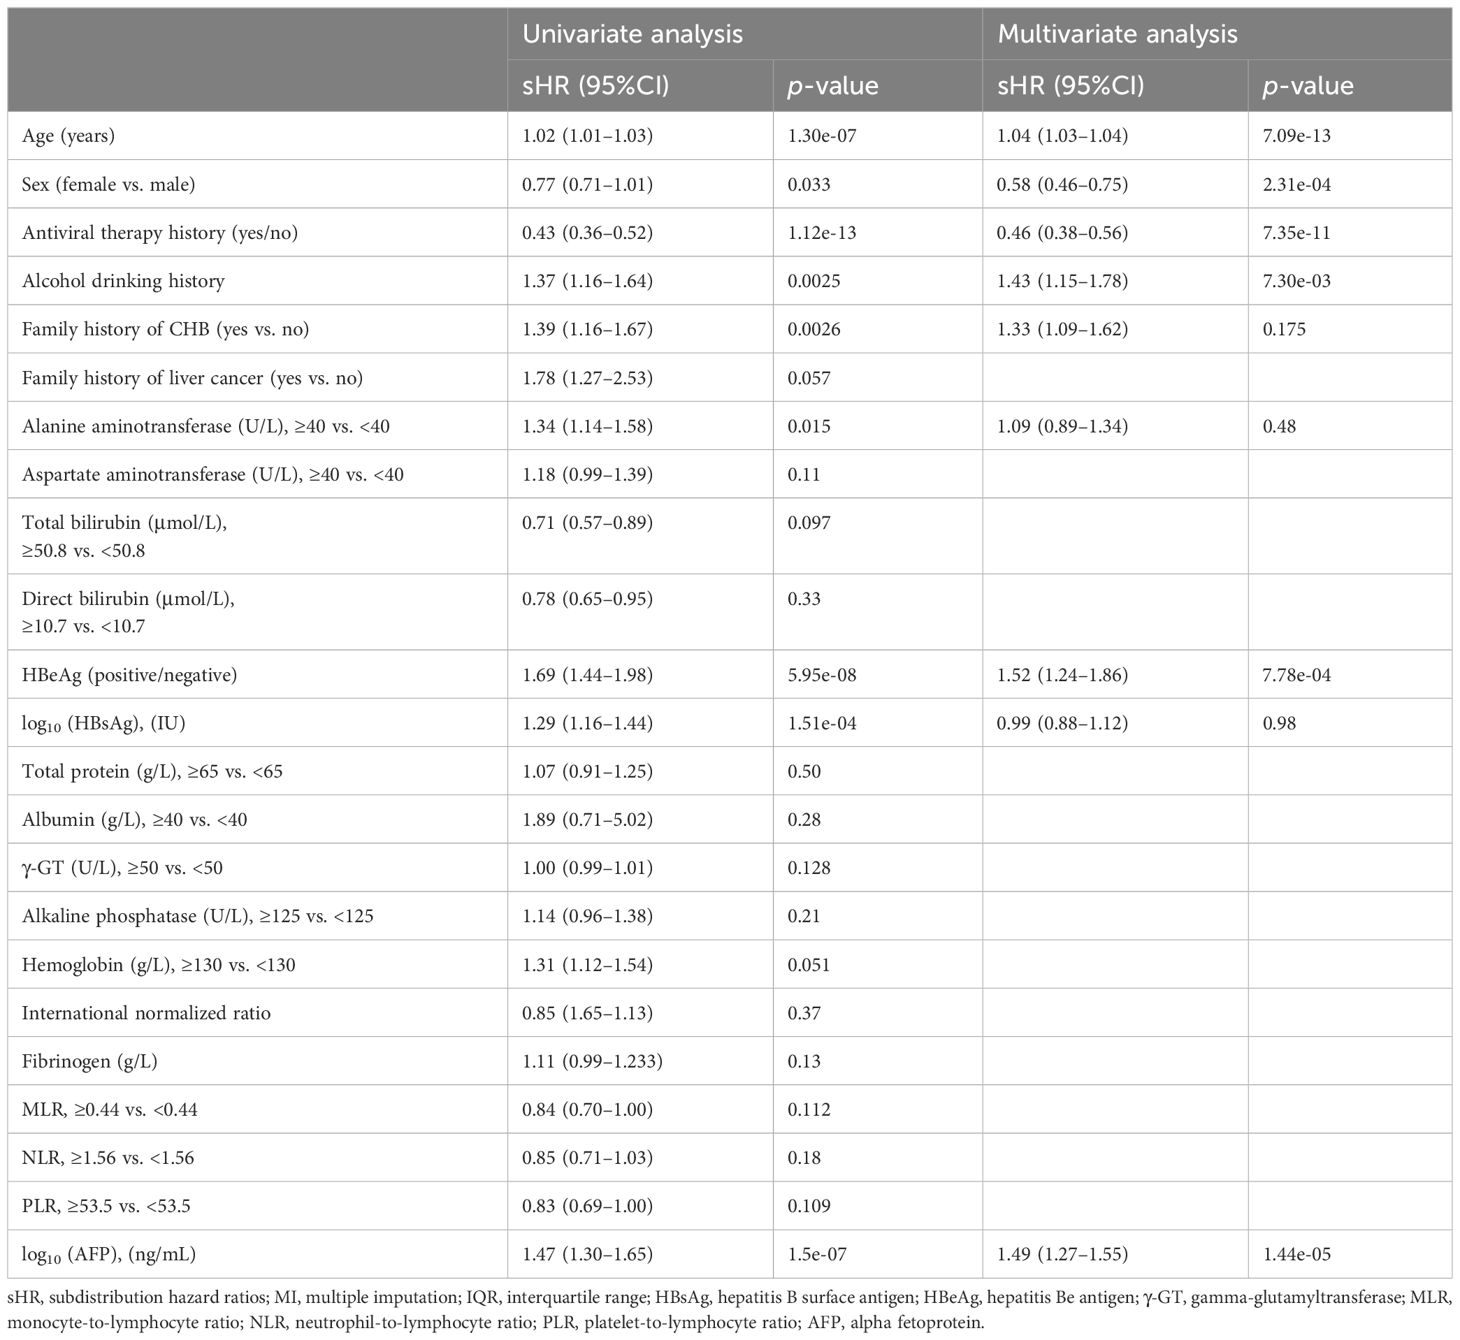
Table 2 Univariate and multivariate Fine–Gray competing risk regression analyses in the training set (pooled MI datasets).
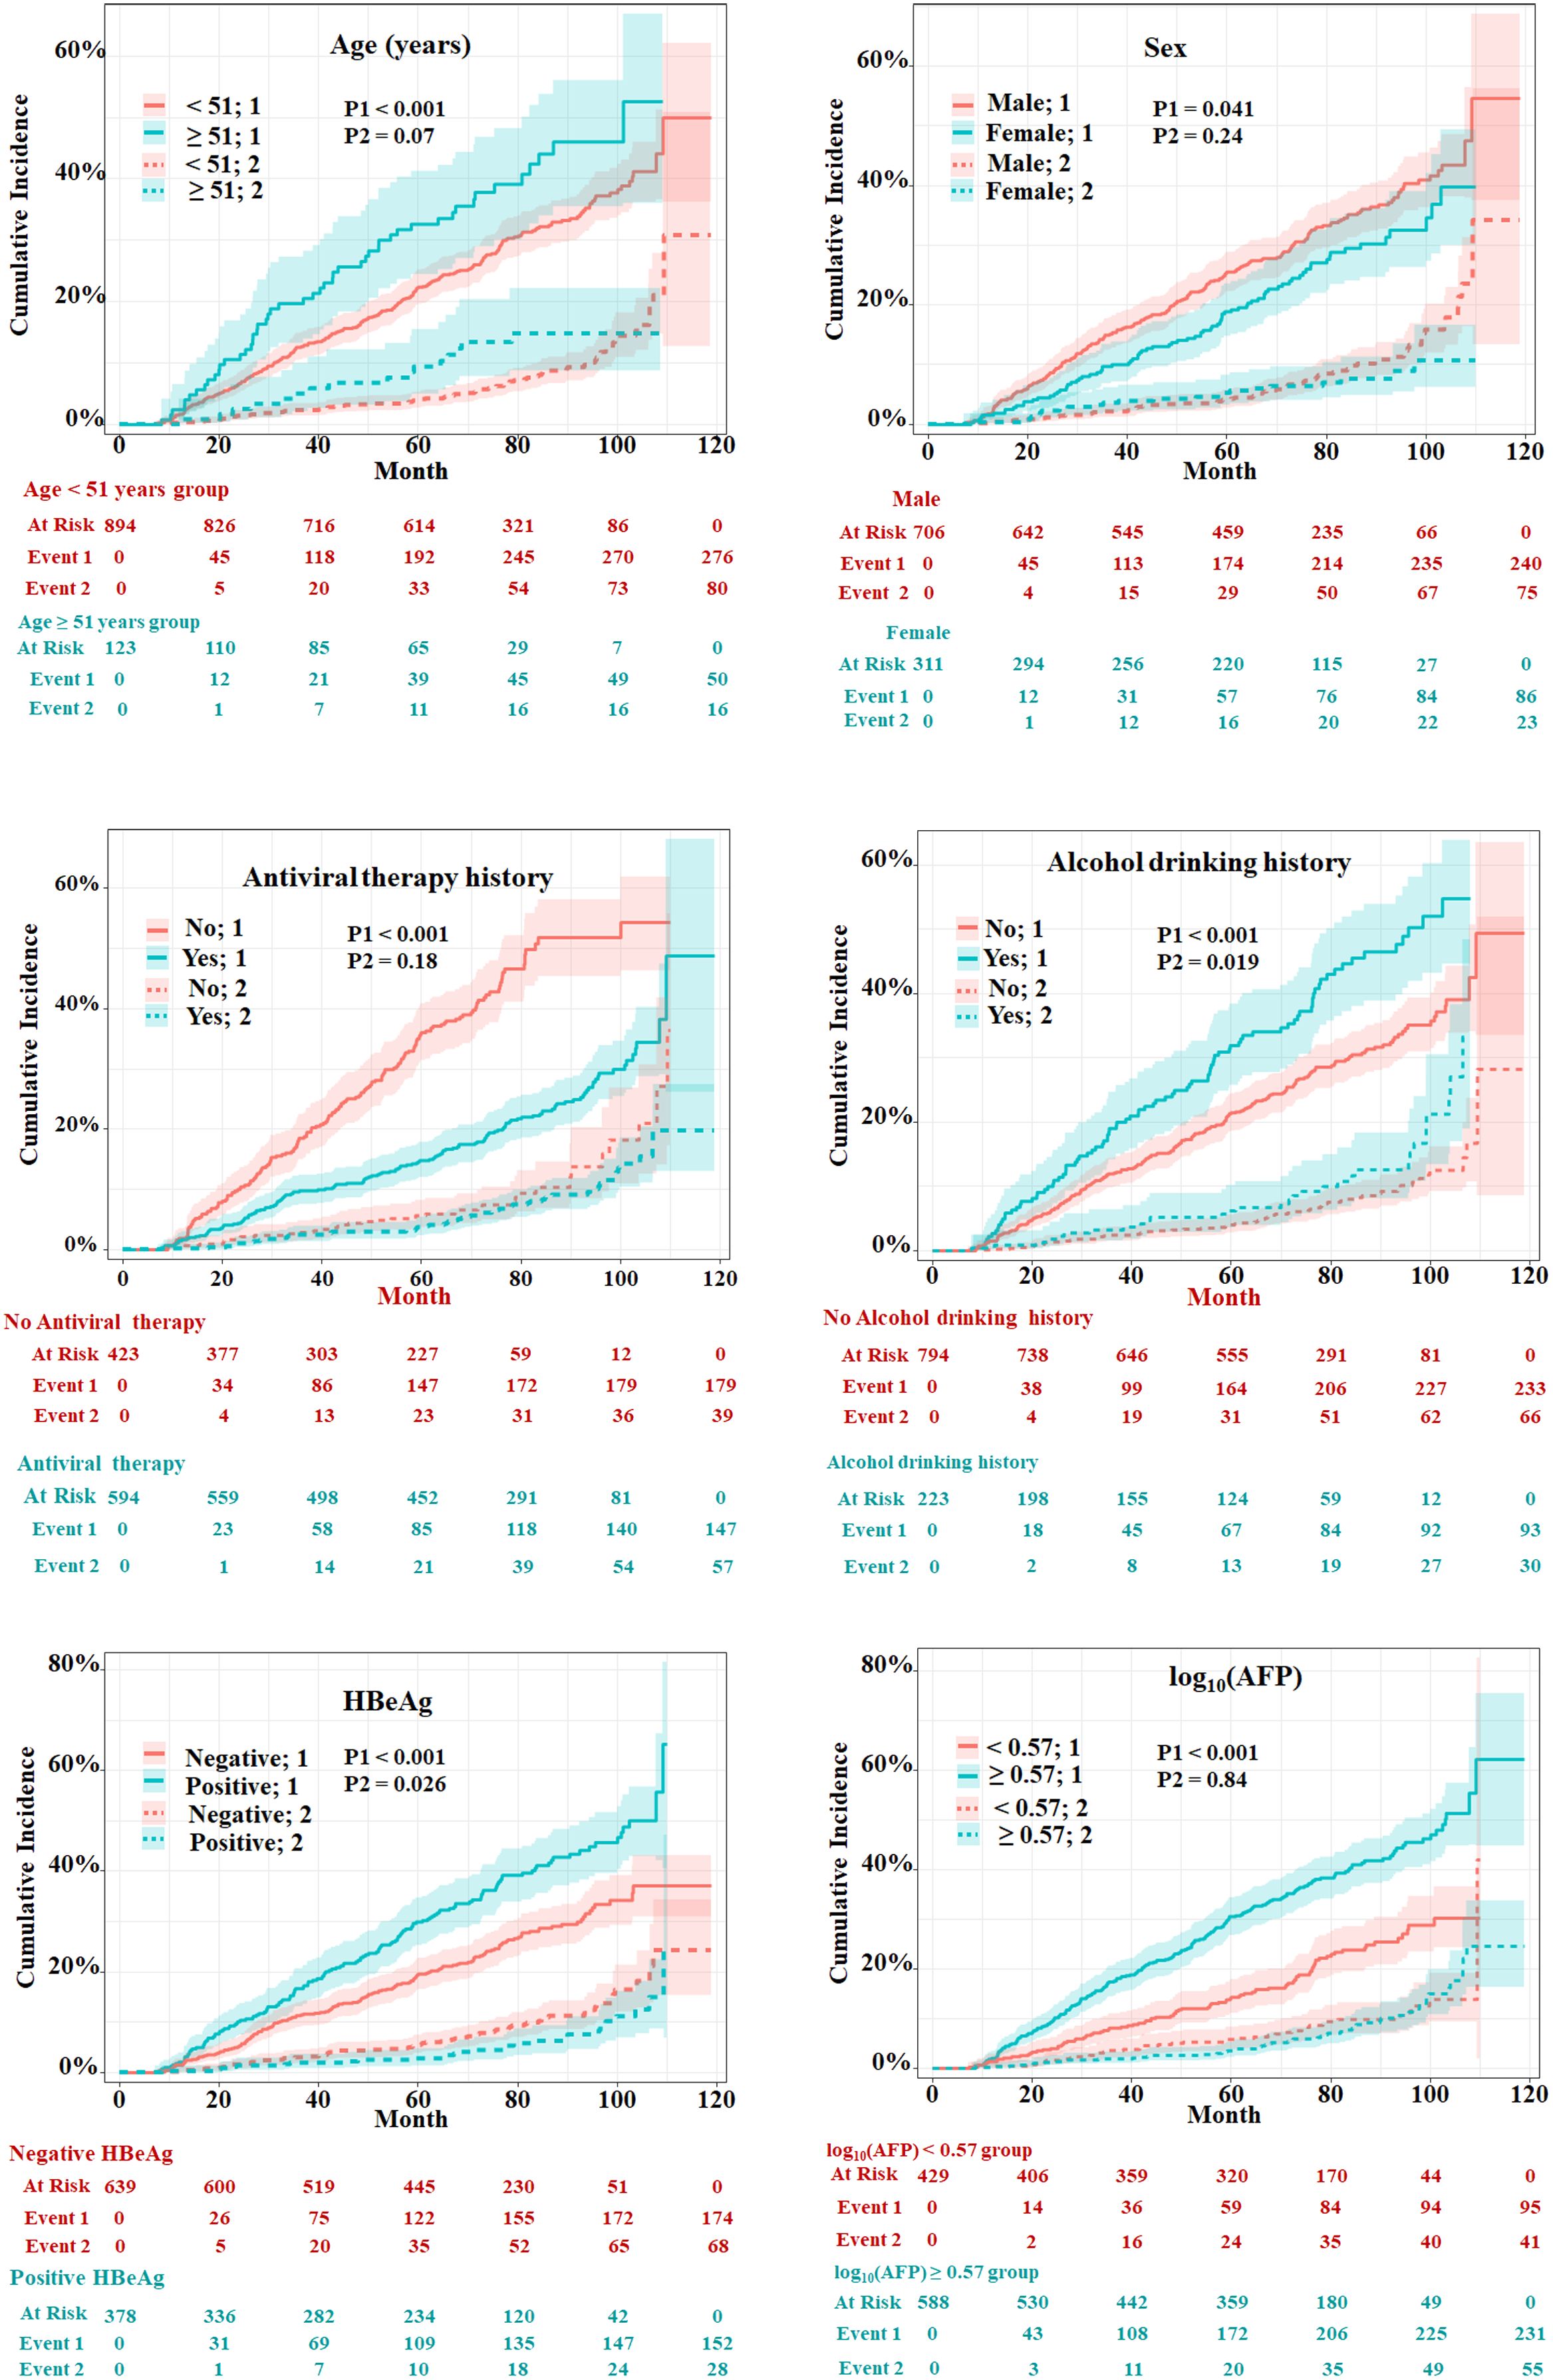
Figure 3 Evaluation of cumulative incidence rate for HCC of predictive risk factors in patients with HBV-related cirrhosis of the training cohort. “1” represents the outcome as HCC; “2” represents the outcome as competing risks (cirrhosis-related death and liver transplantation). The p-values were determined using Fine–Gray test.
Establishment and internal validation of the nomogramThe HCC competing risk nomogram was established in 20 imputed training datasets based on the following six independent predictive factors: age, sex (female or male), antiviral therapy history (yes or no), HBeAg (positive or negative), alcohol drinking history (yes or no), and log10 (AFP). The coefficients of competing risk nomogram are shown in Supplementary Table S2. This model could be used to calculate the probability of HCC occurrence for each cirrhosis patient—for example, a 46.36-year-old and alcohol-drinking male cirrhosis patient with 2.56 ng/mL of AFP, accepting antiviral therapy and HBeAg negative at diagnosis of cirrhosis, had a total score of about 273, and the respective 20-, 40-,60-,80-, and 100-month HCC incidences were about 4.1%, 10.5%, 16.9%, 24.1%, and 32.4% (Figure 4A).
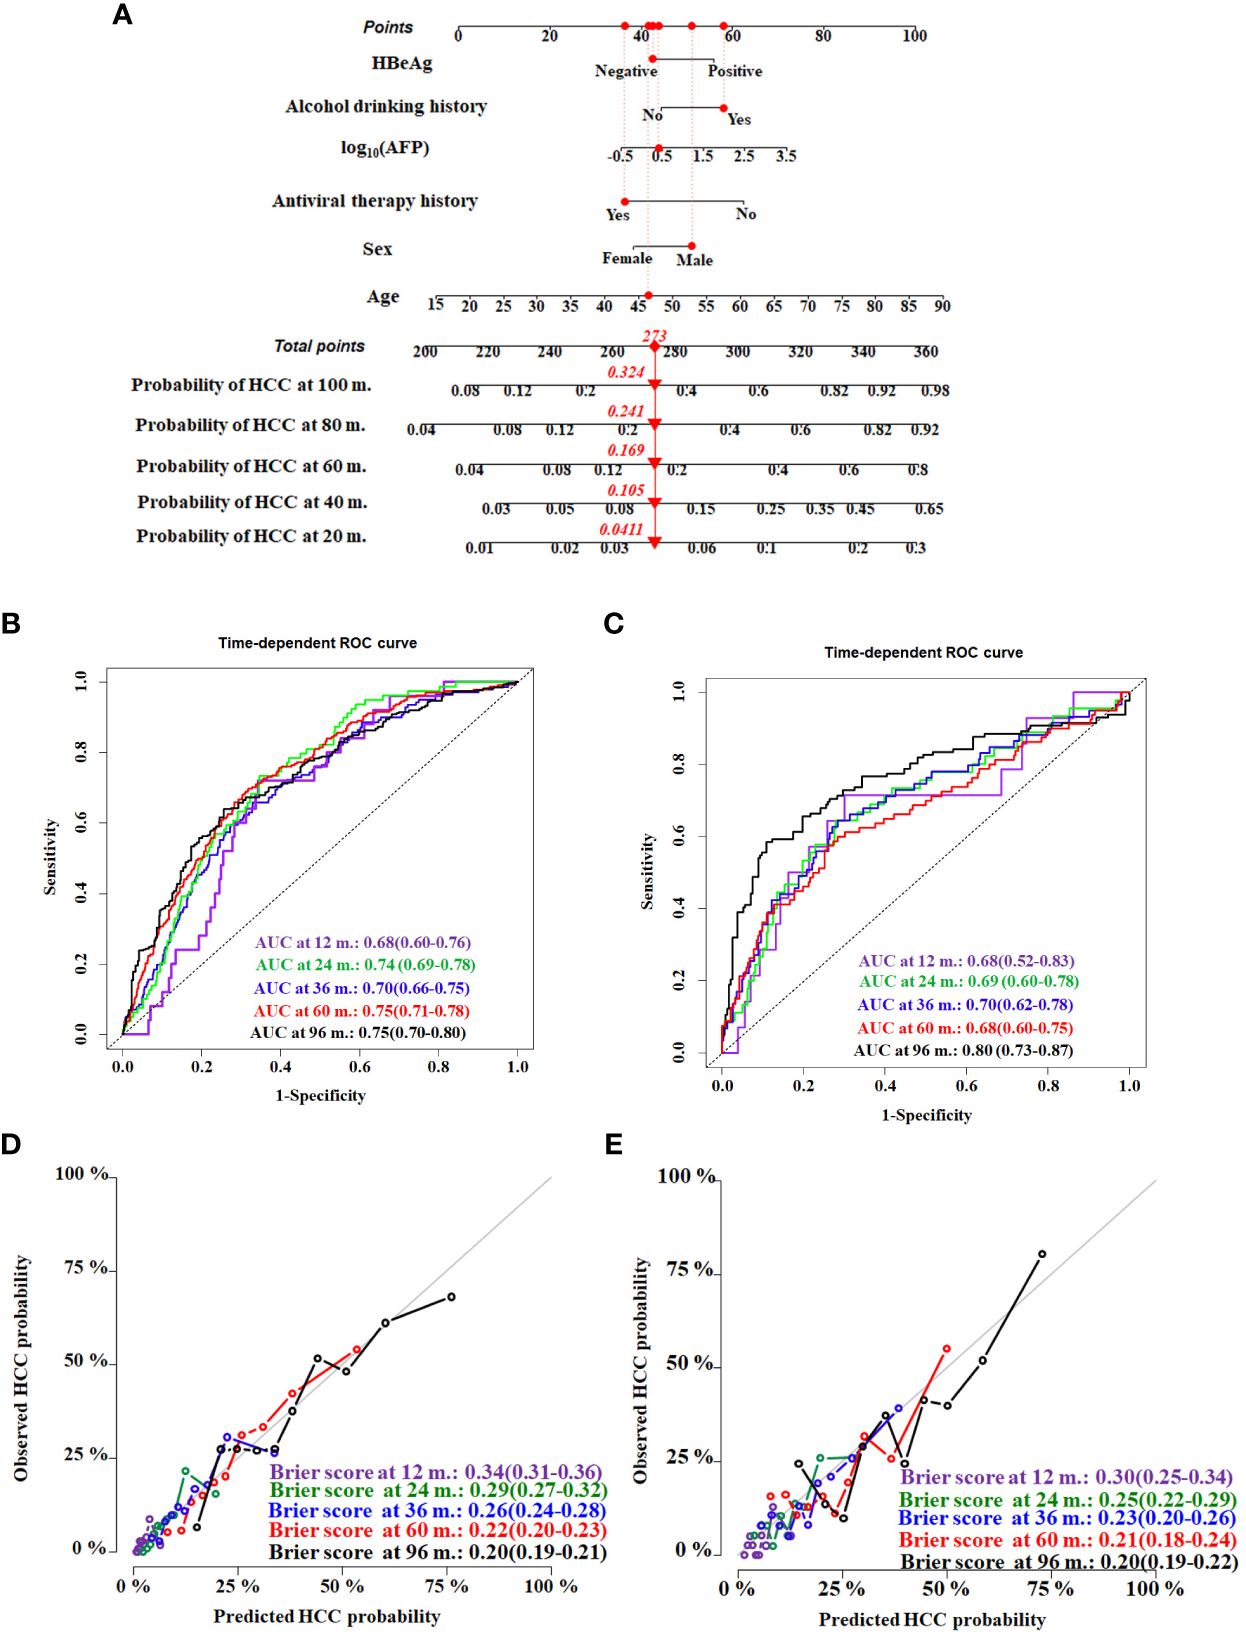
Figure 4 Construction and validation of the HCC competing risk nomogram for predicting the probability in HBV-related cirrhosis patients. (A) HCC competing risk nomogram. Time-dependent ROC curves by nomogram for HCC occurrence probability at 12, 24, 36, 60, and 96 months in the training cohort (B) and the validation cohort (C). Calibration curves of nomogram in terms of agreement between predicted and actual HCC occurrence probability at 12, 24, 36, 60, and 96 months in the training cohort (D) and the validation cohort (E). AUC, area under receiver operating characteristic curve.
Evaluating model overfitting was performed through bootstrap internal validation method. After 1,000 bootstrap cross-validation iterations, the adjusted C-index of the model was 0.75 (95%CI, 0.71–0.79). The time-dependent AUC was used to validate the discriminative ability of the nomogram. The time-dependent AUC values for the prediction of HCC at 12, 24, 36, 60, and 96 months in the training cohort were 0.68 (95%CI, 0.60–0.76), 0.74 (95%CI, 0.69–0.78), 0.70 (95%CI, 0.66–0.75), 0.75 (95%CI, 0.71–0.78), and 0.75 (95%CI, 0.70–0.80), respectively (Figure 4B). The adjusted Brier scores of the calibration curve for the model at 12, 24, 36, 60, and 96 months were 0.34 (95%CI, 0.31–0.36), 0.29 (95%CI, 0.27–0.32), 0.26 (95%CI, 0.24–0.28), 0.22 (95%CI, 0.20–0.23), and 0.20 (95%CI, 0.19–0.21) (Figure 4C), respectively. Similarly, the time-dependent AUC values were assessed in the validation cohort at 12, 24, 36, 60, and 96 months, which were 0.68 (95%CI, 0.52–0.83), 0.69 (95%CI, 0.60–0.78), 0.70 (95%CI, 0.62–0.78), 0.68 (95%CI, 0.60–0.75), and 0.80 (95%CI, 0.73–0.87), respectively (Figure 4D), and the adjusted Brier scores were 0.30 (95%CI, 0.25–0.34), 0.25 (95%CI, 0.22–0.29), 0.23 (95%CI, 0.20–0.26), 0.21 (95%CI, 0.18–0.24), and 0.20 (95%CI, 0.19–0.22) (Figure 4E).
Performance of the competitive risk nomogramIn order to further evaluate the discriminative ability of the HCC competitive risk prediction nomogram, the risk score of each cirrhosis patient was calculated. The low-risk group (score <1.67) and high-risk group (score ≥1.67) were created based on the cutoff value of the risk score, which was selected by applying surv_cutpoint function implemented in “survminer” software. Patients in the training and validation cohorts were stratified based on their risk scores of HCC in the presence of competing events. The cumulative incidence curves of HCC and competitive risk event in the two groups were drawn (Figure 5). The respective incidences had significant differences in the low-risk and high-risk groups both in the two cohorts (p < 0.001). For the training cohort, the cumulative 20-, 40- 60-, 80-, and 100-month incidences of HCC were 11.2 (95%CI, 8.2–13.6), 26.0 (95%CI, 21.6–30.6), 42.1 (95%CI, 36.9–47.1), 53.0 (95%CI, 47.2–58.5), and 63.2 (95%CI, 55.7–69.8) in the high-risk group and 2.4 (95%CI, 1.4–3.8), 7.7 (95%CI, 5.8–10.0), 13.0 (95%CI, 10.5–15.8), 19.4 (95%CI, 16.2–22.90), and 26.3 (95%CI, 22.0–30.8) in the low-risk group (p < 0.001) (Figure 5A). The cumulative 20-, 40- 60-, 80-, and 100-month incidences of HCC were 8.6 (95%CI, 4.8–13.7), 23.2 (95%CI, 16.7–30.62), 32.7 (95%CI, 25.3–40.3), 43.3 (95%CI, 34.5–51.9), and 60.6 (95%CI, 45.0–73.1) in the high-risk group and 2.2 (95%CI, 0.8–4.8), 8.4 (95%CI, 5.3–12.5), 13.8 (95%CI, 9.7–18.7), 20.8 (95%CI, 15.5–26.8), and 26.0 (95%CI, 19.4–33.2) in the validation cohort (Figure 5B). In addition, patients with a higher HCC risk did not have a higher risk of death and LT.
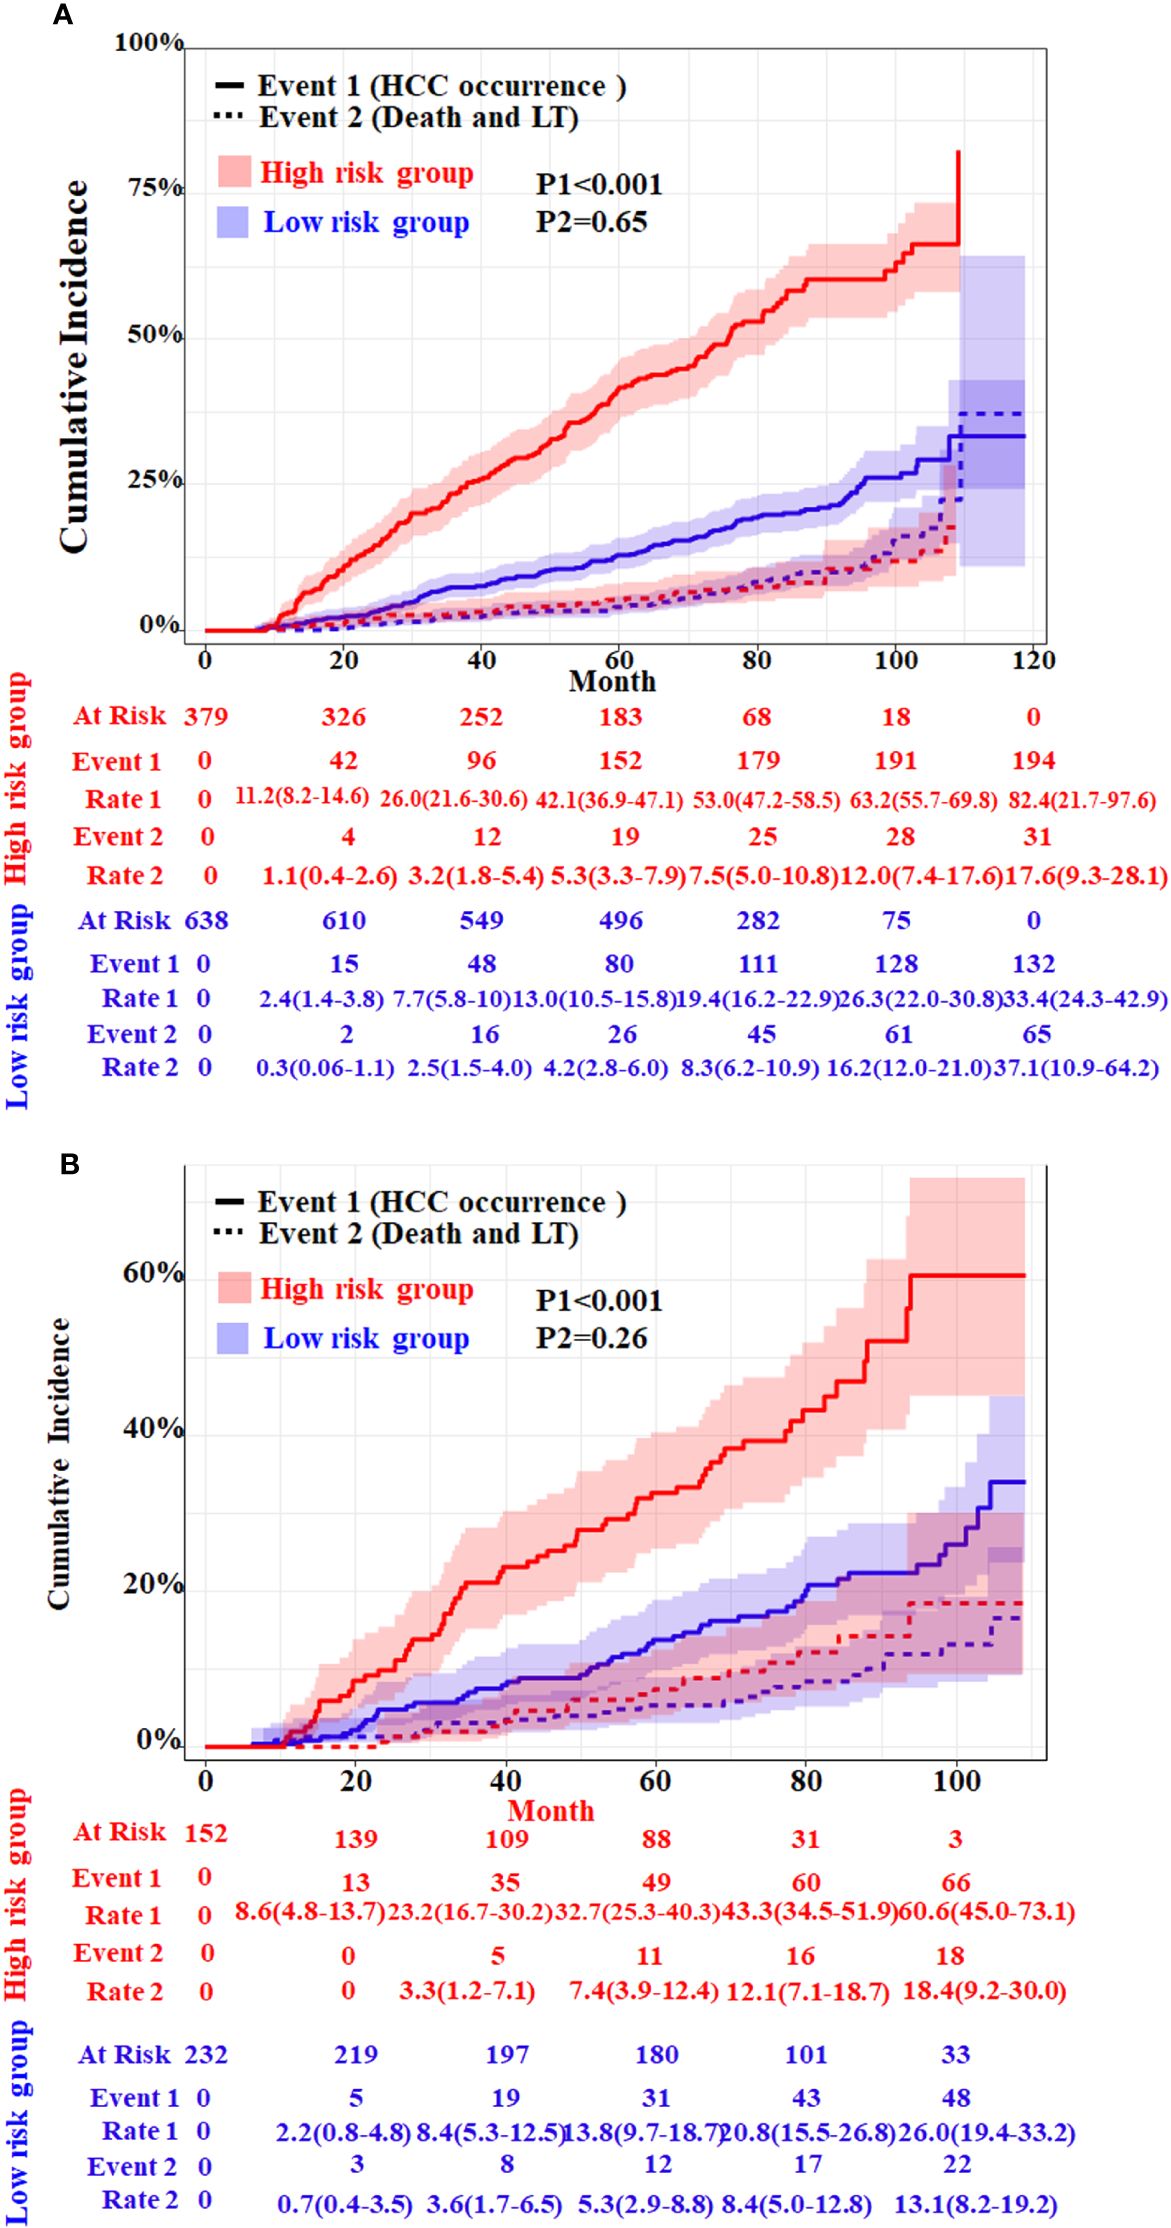
Figure 5 Cumulative incidence with 95%CI of HCC and competing risks event in the low- and high-risk groups of HBV-related cirrhosis patients in the training cohort (A) and the validation cohort (B). LT, liver transplantation. The p-values were determined using Fine–Gray test.
Meanwhile, we compare our model with four other existing risk scores whose parameters all included HBV infection and cirrhosis. Toronto HCC risk index (THRI) scoring system, our previous You’an model (11), the AASL (age, albumin, sex and liver cirrhosis)-HCC scoring system, and real-world risk score for hepatocellular carcinoma (RWS-HCC) were allowed to apply our data. The result of time-dependent AUC of our model and other four models showed that our model has best discriminatory power (Figure 6).
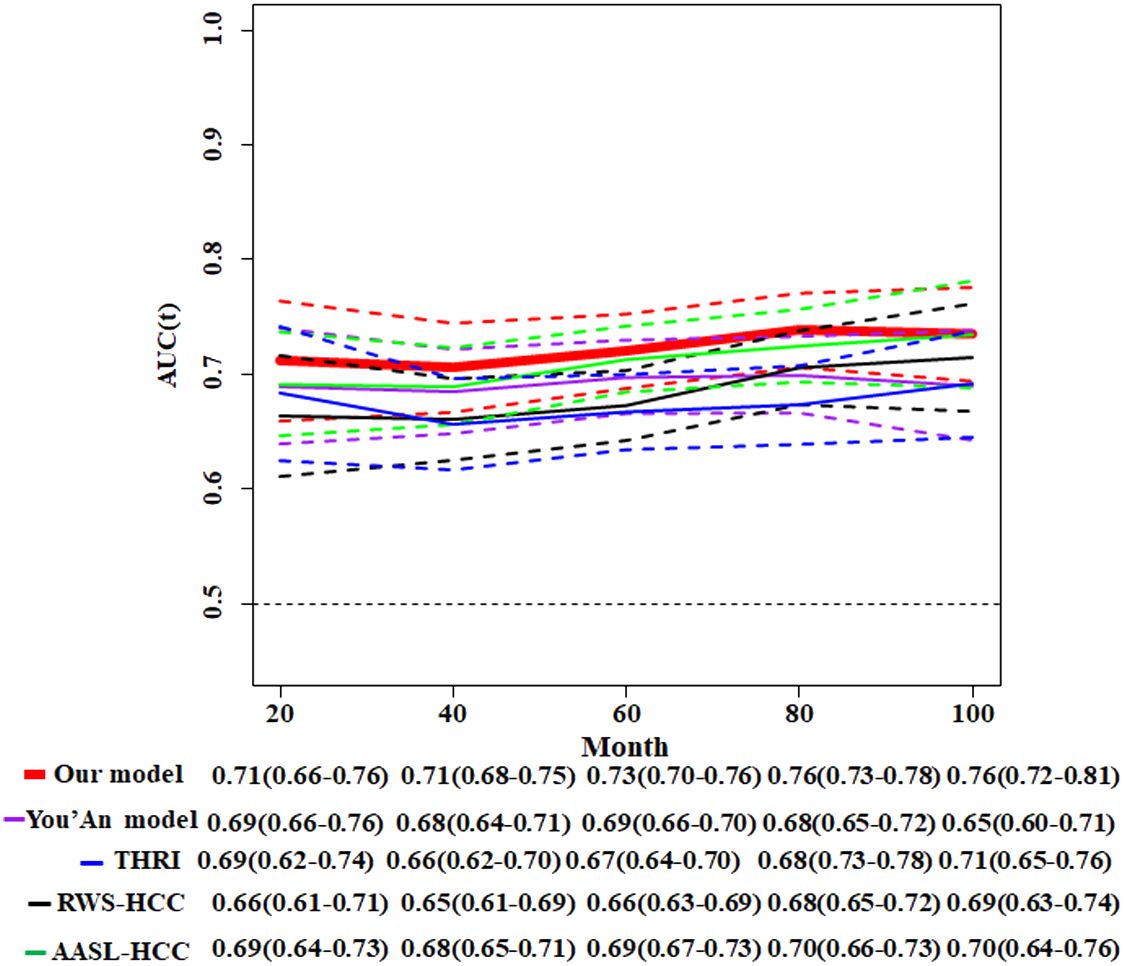
Figure 6 Comparison of time-dependent AUCs with 95%CIs for the competitive risk nomogram and other four HCC models. THRI, Toronto HCC risk index scoring system; You’An model, our previous research (11); AASL-HCC, age, albumin, sex and liver cirrhosis-HCC scoring system; RWS-HCC, real-world risk score for hepatocellular carcinoma.
DiscussionEarly screening of HCC is strongly recommended for HCC surveillance in high-risk HBV cirrhosis patients. The individualized risk of HCC varies with different etiologies of cirrhosis. In this study, we conducted a long-term follow-up (median, 69.9 months) of a large clinical cohort of patients with HBV-related cirrhosis and provided important data on the incidence rate of HCC. The establishment and validation of a competing risk model to predict the 10-year cumulative incidence of HCC in patients with HBV-related cirrhosis were pursued. During the follow-up of 0–10 years, the cumulative incidence rate of HCC in the high-risk group was significantly higher than that in the low-risk group.
The fact that the etiology of liver cirrhosis is a key determinant of HCC risk (10) indicates that there are specific risk factors for HCC in patients with HBV-related cirrhosis. After adjusting for other risk factors, the relative risk of HCC for HBsAg-positive patients alone was 9.6 (95%CI, 6.0–15.2 compared to negative patients, while the relative risk of HCC for HBsAg and HBeAg-positive patients was 60.2 (95%CI, 35.5–102.1). Positive HBeAg usually indicated active replication of HBV in hepatocytes and was an increased risk factor for HCC in CHB patients (22). In fact, liver cirrhosis patients who clear HBeAg and inhibit HBV DNA could significantly reduce the risk of HCC (23). In this study, positive HBeAg is also an increased risk factor for HCC among cirrhosis patients. It is currently clear that antiviral therapy reduces the HCC risk in CHB patients with or without cirrhosis.
Liver cirrhosis is a typical multistate model of disease progression (24); its clinical states mostly include compensated and decompensated cirrhosis and advanced decompensated state (16). The mortality rate varies in different states. In untreated patients with decompensated state, death occur in approximately 30% in 1 to 2 years after the index bleeding. Ascites is associated with a 5-year mortality of about 50% in decompensated patients (25). Overt hepatic encephalopathy and/or jaundice are associated with a 5-year survival of about 20% in advanced cirrhosis (26, 27). Renal function impairment (28), liver dysfunction, and bacterial infections (29) are associated with organ failures and high mortality in advanced cirrhosis. Competing events (cirrhosis related-death and LT) are frequent in liver cirrhosis. Death should always be considered a competing risk for assessing the incidence of HCC event in the course of the disease. If a competing event is treated as considered data, the probability of an event is overestimated using the Kaplan–Meier method (30–33). Competing risk analysis is based on the CIF to predict the probability of any event occurring first, resulting in a desirable total probability from zero to one (or the sum of probabilities for each event) (16). Meantime, because of the occurrence of competing events precluding the occurrence of event of interest, its probability does not necessarily approach unity in the end (34).
In this study, we applied Fine–Gray models and CIF to assess the risk factor and cumulative incidence of HCC in the presence of competing risks. The risk factors, i.e., alcohol drinking (yes or no) and HBeAg (positive or negative) at diagnosis of cirrhosis, were significantly correlated with HCC (both p < 0.001). Meanwhile, they also were slightly associated with competing events (both p < 0.05). The other four predictive factors, log10(AFP), age, sex (female or male), and antiviral therapy (yes or no), were all significantly associated with HCC (both p < 0.05). However, they did not show an association with competing events (both p > 0.05). The cumulative risk incidence of HCC and competing events were both evaluated simultaneously using these variables. Meanwhile, our model was allowed to be used for predicting HCC risk in individual patients with liver cirrhosis, taking into account both the association between risk factors and HCC and the modifying effect of competition events on this association.
This study also had limitations. Firstly, due to the retrospective nature, selection bias is inevitable, and further external validation is needed to increase the extrapolation of the model. Secondly, risk factors from common laboratory tests in hospitals were fully analyzed in this study. Transaldolase and aldolase B regulated the reprogramming of pentose phosphate pathway to have a deep effect on hepatocellular carcinogenesis (35–37). Thus, the novel metabolic markers should be comprehensively evaluated as risk variables that might improve predictive performance. Thirdly, potential interactions between risk factors need to be explored to evaluate the effects on outcomes.
ConclusionsIn the present study, we provided a systematic estimation of HCC in HBV-related liver cirrhosis patients using a retrospective cohort followed up for more than 10 years. Moreover, we established and validated a competing risk nomogram to predict the HCC risk, which might be a convenient and predictive tool for HCC screening.
Data availability statementThe original contributions presented in the study are included in the article/Supplementary Material. Further inquiries can be directed to the corresponding authors.
Ethics statementThe studies involving humans were approved by Ethics Committee of the Beijing You’An Hospital. The studies were conducted in accordance with the local legislation and institutional requirements. The ethics committee/institutional review board waived the requirement of written informed consent for participation from the participants or the participants’ legal guardians/next of kin because this article is a retrospective study. Therefore, the institutional waived the requirement to obtain distinct written informed consent from the patients.
Author contributionsDG: Conceptualization, Data curation, Formal Analysis, Methodology, Supervision, Writing – original draft, Writing – review & editing. JL: Conceptualization, Data curation, Writing – review & editing. PZ: Conceptualization, Data curation, Writing – review & editing. TM: Formal Analysis, Methodology, Writing – review & editing. KL: Conceptualization, Writing – review & editing. YZ: Conceptualization, Data curation, Project administration, Writing – review & editing.
FundingThe author(s) declare financial support was received for the research, authorship, and/or publication of this article. This study was funded by a grant Beijing research center for respiratory infectious diseases project (BJRID2024–007), the Beijing You’An Hospital (BJYAYY-YN2023–10) and Construction of research-oriented wards in Beijing municipality.
Conflict of interestThe authors declare that the research was conducted in the absence of any commercial or financial relationships that could be construed as a potential conflict of interest.
Publisher’s noteAll claims expressed in this article are solely those of the authors and do not necessarily represent those of their affiliated organizations, or those of the publisher, the editors and the reviewers. Any product that may be evaluated in this article, or claim that may be made by its manufacturer, is not guaranteed or endorsed by the publisher.
Supplementary materialThe Supplementary Material for this article can be found online at: https://www.frontiersin.org/articles/10.3389/fonc.2024.1398968/full#supplementary-material
References1. Xie DY, Ren ZG, Zhou J, Fan J, Gao Q. 2019 Chinese clinical guidelines for the management of hepatocellular carcinoma: updates and insights. Hepatobiliary Surg Nutr. (2020) 9:452–63. doi: 10.21037/hbsn
PubMed Abstract | CrossRef Full Text | Google Scholar
2. Man L, Qun WZ, Lu Z, Hao Z, Wu LD, Geng ZM. Burden of cirrhosis and other chronic liver diseases caused by specific etiologies in China, 1990–2016: findings from the global burden of disease study 2016. BioMed Environ Sci. (2020) - 33:1–10. doi: 10.3967/bes2020.001
PubMed Abstract | CrossRef Full Text | Google Scholar
3. Yan YP, Su HX, Ji ZH, Shao ZJ, Pu ZS. Epidemiology of hepatitis B virus infection in China: current status and challenges. J Clin Transl Hepatol. (2014) 2:15–22. doi: 10.14218/JCTH
PubMed Abstract | CrossRef Full Text | Google Scholar
4. Omata M, Cheng AL, Kokudo N, Kudo M, Lee JM, Jia J, et al. Asia-Pacific clinical practice guidelines on the management of hepatocellular carcinoma: a 2017 update. Hepatol Int. (2017) 11:317–70. doi: 10.1007/s12072-017-9799-9
PubMed Abstract | CrossRef Full Text | Google Scholar
6. Marrero JA, Kulik LM, Sirlin CB, Zhu AX, Finn RS, Abecassis MM, et al. Diagnosis, staging, and management of hepatocellular carcinoma: 2018 practice guidance by the american association for the study of liver diseases. Hepatology. (2018) 68:723–50. doi: 10.1002/hep.29913
PubMed Abstract | CrossRef Full Text | Google Scholar
7. Trinchet JC, Chaffaut C, Bourcier V, Degos F, Henrion J, Fontaine H, et al. Ultrasonographic surveillance of hepatocellular carcinoma in cirrhosis: a randomized trial comparing 3- and 6-month periodicities. Hepatology. (2011) 54:1987–97. doi: 10.1002/hep.24545
PubMed Abstract | CrossRef Full Text | Google Scholar
8. Andersson KL, Salomon JA, Goldie SJ, Chung RT. Cost effectiveness of alternative surveillance strategies for hepatocellular carcinoma in patients with cirrhosis. Clin Gastroenterol Hepatol. (2008) 6:1418–24. doi: 10.1016/j.cgh.2008.08.005
PubMed Abstract | CrossRef Full Text | Google Scholar
9. Pocha C, Dieperink E, McMaken KA, Knott A, Thuras P, Ho SB. Surveillance for hepatocellular cancer with ultrasonography vs. computed tomography – a randomised study. Aliment Pharmacol Ther. (2013) 38:303–12. doi: 10.1111/apt.2013.38.issue-3
PubMed Abstract | CrossRef Full Text | Google Scholar
10. Sharma SA, Kowgier M, Hansen BE, Brouwer WP, Maan R, Wong D, et al. Toronto HCC risk index: A validated scoring system to predict 10-year risk of HCC in patients with cirrhosis. J Hepatol. (2018) 68:92–9. doi: 10.1016/j.jhep.2017.07.033
CrossRef Full Text | Google Scholar
11. Wang Q, Guo D, Gao W, Yuan C, Li J, Zhang Y, et al. Individual surveillance by competing risk model for patients with hepatocellular carcinoma occurrence in all-cause cirrhosis. J Cancer Res Clin Oncol. (2023) 149:13403–16. doi: 10.1007/s00432-023-04911-y
PubMed Abstract | CrossRef Full Text | Google Scholar
12. Yu JH, Suh YJ, Jin YJ, Heo NY, Jang JW, You CR, et al. Prediction model for hepatocellular carcinoma risk in treatment-naive chronic hepatitis B patients receiving entecavir/tenofovir. Eur J Gastroenterol Hepatol. (2019) 31:865–72. doi: 10.1097/MEG.0000000000001357
PubMed Abstract | CrossRef Full Text | Google Scholar
13. Poh Z, Shen L, Yang HI, Seto WK, Wong VW, Lin CY, et al. Real-world risk score for hepatocellular carcinoma (RWS-HCC): a clinically practical risk predictor for HCC in chronic hepatitis B. Gut. (2016) 65:887–8. doi: 10.1136/gutjnl-2015-310818
PubMed Abstract | CrossRef Full Text | Google Scholar
14. Wong VW, Chan SL, Mo F, Chan TC, Loong HH, Wong GL, et al. Clinical scoring system to predict hepatocellular carcinoma in chronic hepatitis B carriers. J Clin Oncol. (2010) 28:1660–5. doi: 10.1200/JCO.2009.26.2675
PubMed Abstract | CrossRef Full Text | Google Scholar
15. Heimbach JK, Kulik LM, Finn RS, Sirlin CB, Abecassis MM, Roberts LR, et al. AASLD guidelines for the treatment of hepatocellular carcinoma. Hepatology. (2018) 67(1):358–80. doi: 10.1002/hep.29086
PubMed Abstract | CrossRef Full Text | Google Scholar
16. D’Amico G, Morabito A, D’Amico M, Pasta L, Malizia G, Rebora P, et al. Clinical states of cirrhosis and competing risks. J Hepatol. (2018) 68:563–76. doi: 10.1016/j.jhep.2017.10.020
PubMed Abstract | CrossRef Full Text | Google Scholar
17. Chinese Society of Hepatology. Chinese guidelines on the management of liver cirrhosis. Zhonghua Gan Zang Bing Za Zhi. (2019) 27:846–65. doi: 10.3760/cma.j.issn.1007-3418.2019.11.008
PubMed Abstract | CrossRef Full Text | Google Scholar
18. General Office of National Health Commission. Standard for diagnosis and treatment of primary liver cancer (2022 edition). J Clin Hepatol. (2022) 38:288–303. doi: 10.3969/j.issn.1001-5256.2022.02.009
CrossRef Full Text | Google Scholar
19. Åström H, Ndegwa N, Hagström H. External validation of the Toronto hepatocellular carcinoma risk index in a Swedish population. JHEP Rep. (2021) 3:100343. doi: 10.1016/j.jhepr.2021.100343
PubMed Abstract | CrossRef Full Text | Google Scholar
20. van Buuren S, Groothuis-Oudshoorn K. mice: multivariate imputation by chained equations in R. J Stat Software. (2011) 45:1–67. doi: 10.18637/jss.v045.i03
CrossRef Full Text | Google Scholar
21. Fine JP, Gray RJ. A proportional hazards model for the subdistribution of a competing risk. J Am Stat Assoc. (1999) 94:496–509. doi: 10.1080/01621459.1999.10474144
CrossRef Full Text | Google Scholar
22. Yang H-I, Lu S-N, Liaw Y-F, You S-L, Sun C-A, Wang L-Y, et al. Hepatitis B e antigen and the risk of hepatocellular carcinoma. N Engl J Med. (2002) 347:168–74. doi: 10.1056/NEJMoa013215
PubMed Abstract | CrossRef Full Text | Google Scholar
23. Fattovich G, Stroffolini T, Zagni I, Donato F. Hepatocellular carcinoma in cirrhosis: Incidence and risk factors. Gastroenterology. (2004) 127:S35–50. doi: 10.1053/j.gastro.2004.09.014
PubMed Abstract | CrossRef Full Text | Google Scholar
24. Jepsen P, Vilstrup H, Andersen PK. The clinical course of cirrhosis: The importance of multistate models and competing risks analysis. Hepatology. (2015) 62:292–302. doi: 10.1002/hep.27598
PubMed Abstract | CrossRef Full Text | Google Scholar
25. Planas R, Montoliu S, Ballesté B, Rivera M, Miquel M, Masnou H, et al. Natural history of patients hospitalized for management of cirrhotic ascites. Clin Gastroenterol Hepatol. (2006) 4:1385–94,94.e1. doi: 10.1016/j.cgh.2006.08.007
PubMed Abstract | CrossRef Full Text | Google Scholar
26. D’Amico G, Pasta L, Morabito A, D’Amico M, Caltagirone M, Malizia G, et al. Competing risks and prognostic stages of cirrhosis: a 25-year inception cohort study of 494 patients. Aliment Pharmacol Ther. (2014) 39:1180–93. doi: 10.1111/apt.12721
PubMed Abstract | CrossRef Full Text | Google Scholar
27. Jepsen P, Ott P, Andersen PK, Sørensen HT, Vilstrup H. Clinical course of alcoholic liver cirrhosis: A Danish population-based cohort study. Hepatology. (2010) 51:1675–82. doi: 10.1002/hep.23500
PubMed Abstract | CrossRef Full Text | Google Scholar
28. Fagundes C, Barreto R, Guevara M, Garcia E, Solà E, Rodríguez E, et al. A modified acute kidney injury classification for diagnosis and risk stratification of impairment of kidney function in cirrhosis. J Hepatol. (2013) 59:474–81. doi: 10.1016/j.jhep.2013.04.036
PubMed Abstract | CrossRef Full Text | Google Scholar
29. Wiest R, Lawson M, Geuking M. Pathological bacterial translocation in liver cirrhosis. J Hepatology. (2014) 60:197–209. doi: 10.1016/j.jhep.2013.07.044
留言 (0)