
記住我


Mitochondria, organelles typically associated with energy production, are vital components of nearly all cells. In recent decades new mitochondrial roles have been uncovered, including initiation of cell death (Wang and Youle, 2009), maintenance of calcium (Rizzuto et al., 2012) and redox homeostases (Willems et al., 2015), metabolism of lipids (Houten and Wanders, 2010), and even guiding light in the eye (Ball et al., 2022). They have intricate relationships with the endoplasmic reticulum (Rowland and Voeltz, 2012) that are crucial to the function of neurons and other cells (Wu et al., 2017). Mitochondria are highly dynamic, moving along cytoskeletal networks (Barnhart, 2016), undergoing replication and quality control via fission and fusion (Youle and van der Bliek, 2012; Ni et al., 2015), and sometimes being ejected from cells (Nakajima et al., 2008; Lyamzaev et al., 2022).
Owing to their bacterial symbiont origin, mitochondria possess heterogeneous populations of mitochondrial DNA (mtDNA) that are distinct from genomic DNA (gDNA). The mitochondrial genome is a compact plasmid, with less than 17,000 base pairs encoding 13 critical components of the electron transport chain, plus mitochondrial ribosomal and transfer RNAs needed for translation (Mercer et al., 2011). mtDNA is transcribed into mitochondrial RNA (mtRNA) using a dedicated mtDNA polymerase, and mtRNA is translated into proteins using mitochondrial ribosomes. The remaining >99% of mitochondrial proteins are encoded by gDNA and imported.
Mitochondrial diseases arise from mutations in gDNA that affect mitochondrial proteins, or from mutations to mtDNA itself (Gorman et al., 2016). mtDNA mutations can be difficult to characterize due to the unique maternal inheritance of mitochondria and resulting heteroplasmy (St John et al., 2010). Additionally, certain diseases and aging can lead to aberrant mtDNA levels and mitochondrial dysfunction (Filograna et al., 2021; Sanchez-Contreras and Kennedy, 2022). Despite the importance of mtDNA homeostasis for cells, few tools exist for spatially quantifying mtDNA copy number and/or mtRNA amounts in specific cells of a complex tissue.
We employed in situ hybridization (ISH) using RNAscope™ probes (Wang et al., 2012) designed to report either mtDNA, or mtDNA and mtRNA. The strategy is similar to a published chromogenic assay (Chen et al., 2020), but allows for higher-resolution 3-D imaging and simultaneous protein detection using immunohistochemistry (IHC). As a proof of principle, we used this method to explore mtDNA and mtRNA levels in cone and rod photoreceptors during day and night in zebrafish. At night mtRNA but not mtDNA levels increase in both photoreceptor types, which corresponds to increases in mitochondrial number and activity in cones (Giarmarco et al., 2020). This method is adaptable to many species and tissue types; paired with super-resolution imaging and AI-assisted analysis it can quantitatively report mtDNA and mtRNA in individual cells of a complex tissue.
2 Materials and equipment2.1 Methods2.1.1 AnimalsResearch was authorized by the University of Washington Institutional Animal Care and Use Committee. Wild-type AB Danio rerio were raised under standard conditions in the UW SLU Aquatics facility on a 14h/10 h light/dark cycle, with lights on at 9 a.m. Male and female fish were euthanized over an ice bath, followed by cervical dislocation and enucleation. For the 11 p.m. timepoint euthanasia and dissections were performed under infrared light with night vision goggles.
2.1.2 Tissue preparationFor histology, eyes were collected at 9 a.m. and 11 p.m. (4 animals per timepoint), pierced several times across the cornea with a needle, and the vitreous cavity was flushed with 4% paraformaldehyde fixative in phosphate buffered solution (PBS). Following overnight immersion in fixative at 4°C, eyes were rinsed in PBS, then bleached with 10% H2O2 in PBS overnight at 37°C to clarify the pigmented epithelium. Eyes were cryoprotected in 20% sucrose, the anterior halves dissected away, and eyecups were embedded and frozen in OCT cryomolds. Eyecups were cryosectioned at 20 μm onto slides that contained one section from each timepoint for parallel staining and analysis; slides were stored at −20°C.
For bulk genomic analysis, eyes were collected at 9 a.m. and 11 p.m. (4-5 animals per timepoint), and the retinas were isolated in PBS. Retinas were snap frozen in microfuge tubes over liquid nitrogen and stored at −80°C until DNA extraction.
2.1.3 Probe designThree commercially-available ACD RNAscope™ probes were used. As a positive control, Dr-polr2a-C3 reported mRNA transcripts from a nuclear-encoded zebrafish housekeeping gene. As a negative control, 3-plex DapB reported transcripts from a bacterial gene. To explore mtDNA and mtRNA we used probes against the mitochondrial gene MT-ND5, which encodes a highly-conserved subunit of respiratory complex I and was identified by the manufacturer as a good candidate reporter. The “coding” probe Dr-MT-ND5 contains sequences antisense to the MT-ND5 gene, binding to regions of the noncoding (sense) mtDNA strand, and to MT-ND5 mtRNA transcripts.
To report mtDNA, we employed a strategy similar to one reported for chromogenic RNAscope™ with paraffin-embedded samples (Chen et al., 2020). The “noncoding” probe Dr-MT-ND5-sense-C3 was custom designed to contain sense sequences of the same mitochondrial gene; it binds regions of the coding (antisense) mtDNA strand. Antisense mtRNA transcripts from the noncoding strand of mtDNA are typically degraded (Pietras et al., 2018; Jedynak-Slyvka et al., 2021), so this probe reports primarily mtDNA.
2.1.4 In situ hybridization with RNAscope™Sections were treated with the RNAscope™ Fluorescent Multiplex v2 kit. The standard protocol for fixed frozen sections was used including pretreatment, probe hybridization and fluorescent labelling, with the following modifications: 1) Target retrieval was reduced to 5 min 2) Protease III digestion was reduced to 15 min 3) Probe and dye concentrations were optimized to best visualize single molecules (see Table 2). 4) Following the final wash, sections were not mounted and instead immediately underwent IHC. Incubations were conducted in staining chambers in a standard incubator. MT-ND5 probes were conjugated to the fluorescent dye Opal™ 520 diluted in RNAscope™ TSA buffer. Polr2a (C3) and DapB (C2) control probes were conjugated to Opal™ 520 and Opal™ 570, respectively.
2.1.5 Enzymatic validation of probesTo verify specificity of mtDNA and mtRNA detection with the MT-ND5 probes, an additional incubation in either PBS or RNase A was performed. Following post-protease water washes and just prior to probe hybridization, sections were incubated 30 min at 37°C in either PBS or 50 μg/mL RNase A in PBS, followed by 3 water washes. This was followed by standard probe hybridization, fluorescent labelling, and IHC. Additional validation strategies are outlined in the Section 3.
2.1.6 ImmunohistochemistryFollowing RNAscope™, sections underwent IHC using a primary antibody against MTCO1 (a subunit of respiratory complex IV) to report mitochondrial volume. Sections were washed 3 times with PBS, blocked 1 h at room temperature (RT) with blocking buffer, and incubated overnight at RT with anti-MTCO1 diluted in blocking buffer. They were then washed 3 times with PBS, incubated 2 h at RT with Alexa Fluor™ 633-conjugated secondary antibodies and DAPI counterstain, washed 3 times with PBS, and mounted with Vectashield and a coverslip. Table 1 lists primary antibodies used in this study, along with others the authors have found to be compatible for multiplexing IHC with RNAscope™.
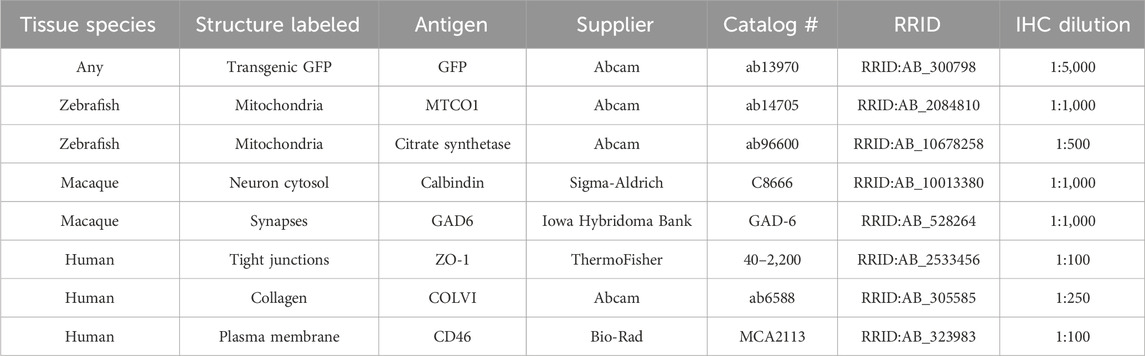
Table 1. Materials and equipment. Primary antibodies suitable for multiplexing IHC with RNAscope™ in cryosections.
2.1.7 Imaging and image processingImaging was conducted using a Leica SP8 confocal microscope with a ×63 oil objective to capture single Z-stacks and Z-stack montages. LAS-X software was used for acquisition, and images were deconvolved using Leica Lightning in adaptive mode. Images were processed in ImageJ, where mitochondrial clusters of individual rods and short-wavelength cones were identified based on morphology and position in the retina (cyan and yellow boxes in Figure 2A). Single clusters were cropped out for quantification using the MTCO1 mitochondrial channel as a mask. Confocal images presented are maximum intensity projections over 12 µm tissue depth.
2.1.8 Quantification of probe signalsMitochondrial clusters of rod photoreceptors were found to have well-resolved individual RNAscope™ MT-ND5 puncta. Single cluster Z-stacks (n = 3 cells per condition) were analyzed using the 3D Objects Counter plugin in ImageJ to report the number of puncta per cluster. MT-ND5 puntca in cone clusters were poorly resolved in areas due to very dense packing of mitochondria. Single cluster Z-stacks (n = 30 cells per standard timepoint, n = 12 cells per timepoint for RNase validation) were analyzed using the 3D Objects Counter plugin in ImageJ to instead report total puncta volume relative to overall mitochondrial volume measured using the MTCO1 channel. For both rods and cones, analysis was conducted blind to sample condition and timepoint. Mann-Whitney statistical tests were performed using Microsoft Excel with the Real Statistics resource pack.
2.1.9 DNA extraction and quantification using qPCRDNA was isolated from frozen retinas (n = 3-4 animals per timepoint, each with three technical replicates) using an AllPrep DNA/RNA Mini Kit, then quality checked via spectrophotometer. mtDNA:gDNA ratios were determined using the qPCR 2−ΔΔCT method (Livak and Schmittgen, 2001) relative to the 9 a.m. timepoint. Mitochondrial-encoded NADH dehydrogenase 1 (mt-nd1) served as the mtDNA target and polg1 was the nuclear-encoded DNA target, a strategy reported previously in zebrafish (Artuso et al., 2012). Primer sequences for these targets are listed in Table 2. qPCR CT values were generated using extracted DNA on the 7500 Fast Real-Time PCR System and SYBR Green Real-Time PCR Master Mix. The number of mtDNA copies per cell was determined according to the following equation (Artuso et al., 2012):
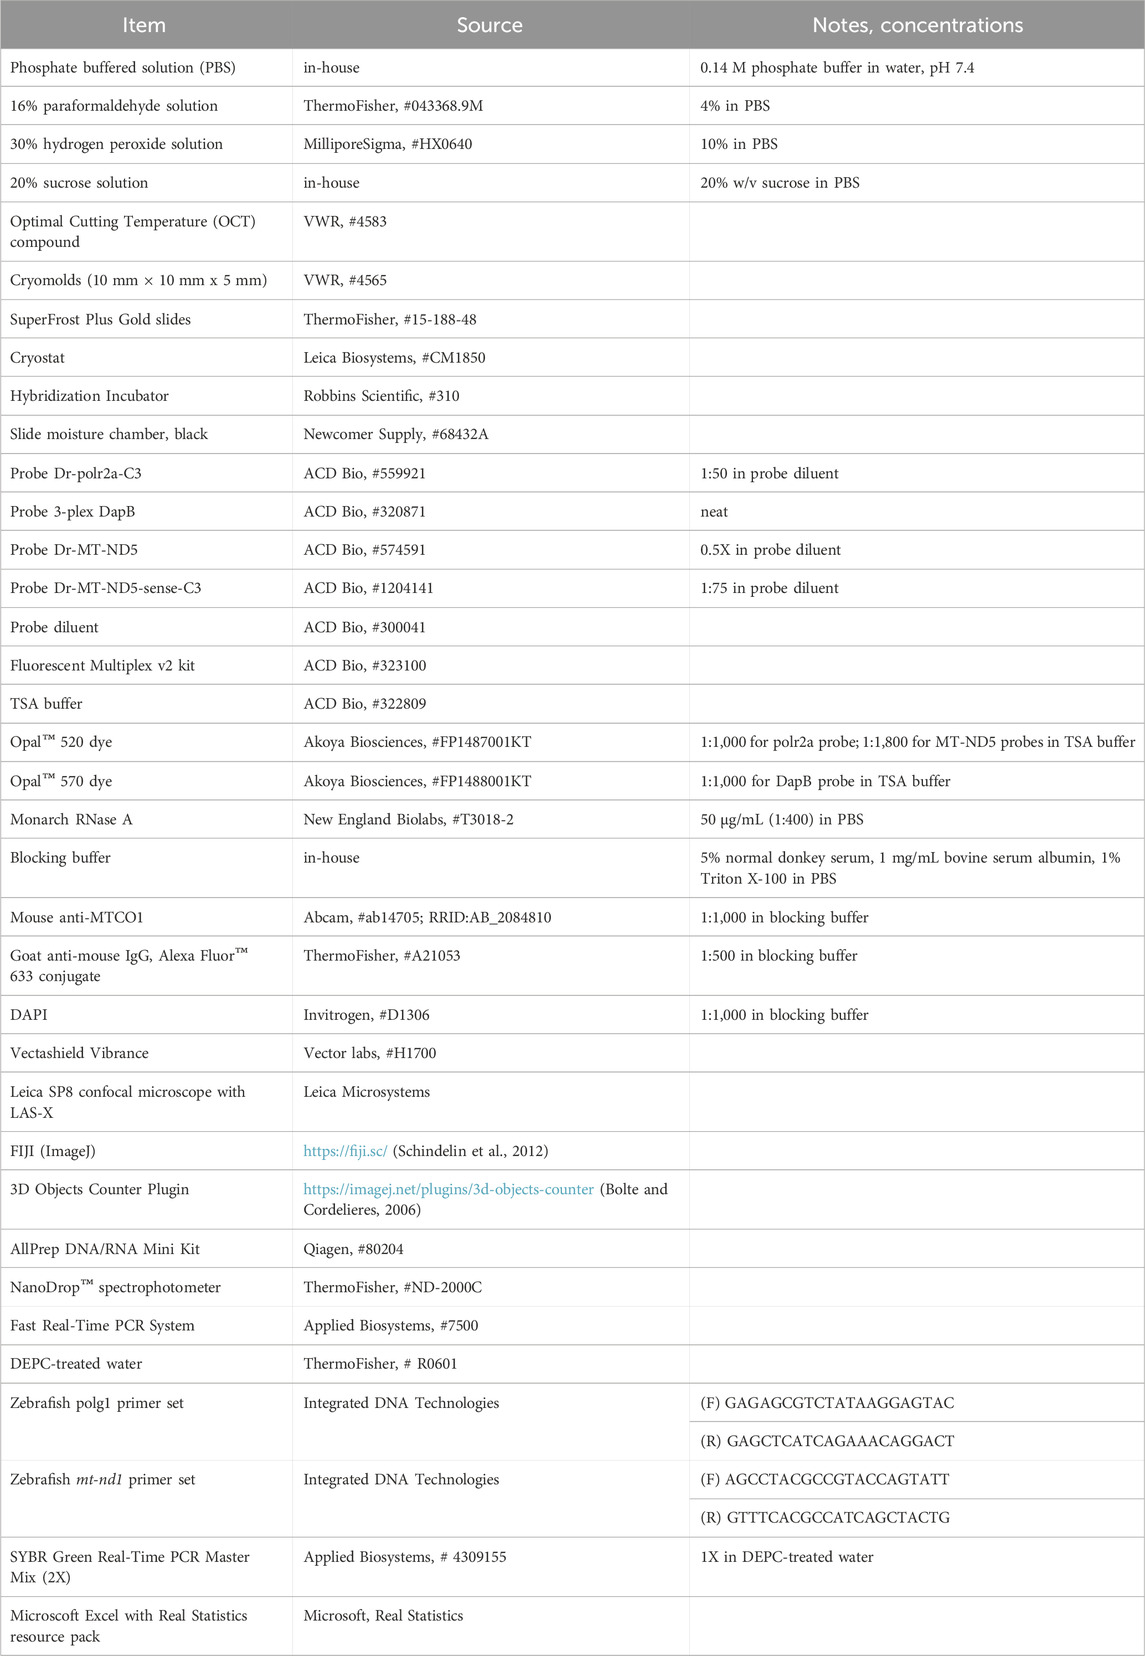
mtDNA copies=number of mtDNA copiesnumber of allele of nDNA2Table 2. Materials and Equipment.
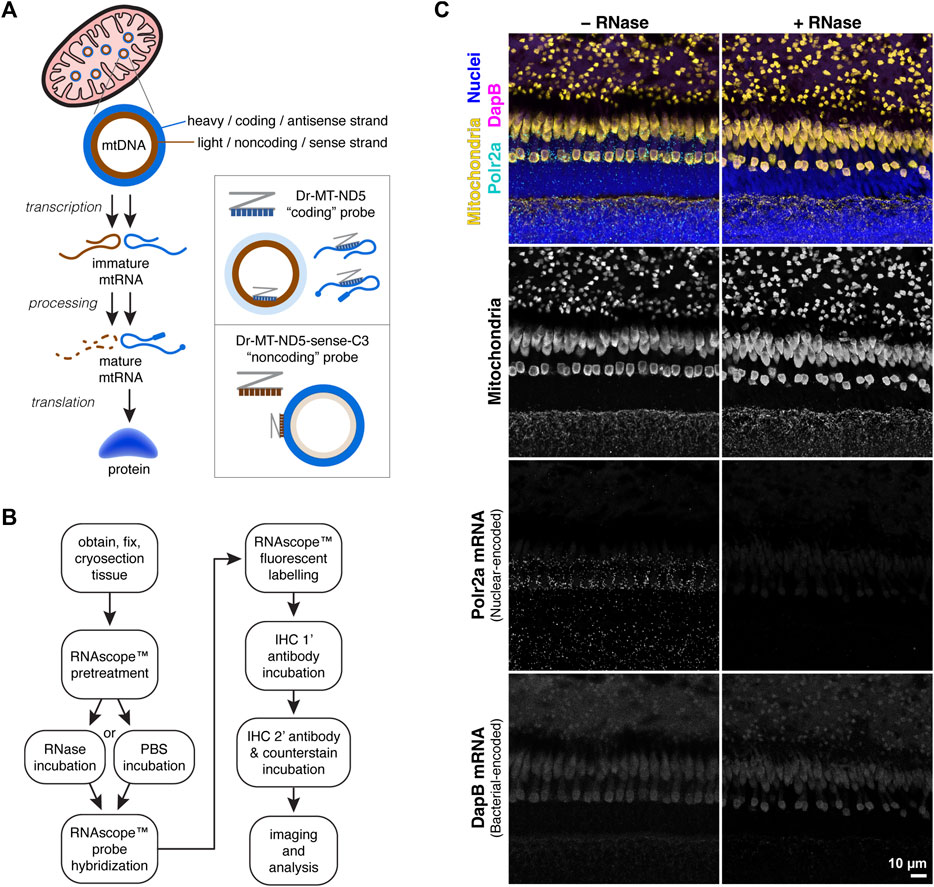
3 Results3.1 Experimental designThe mitochondrial genome consists of a “heavy” coding strand, and a complementary “light” noncoding strand. During transcription mtRNA is generated from both strands; sense transcripts from the coding strand are processed and translated into proteins, transfer RNAs, and ribosomal RNAs (Pietras et al., 2018; Jedynak-Slyvka et al., 2021). mtRNA transcripts from the noncoding strand are typically degraded, except for a few transfer RNAs and one protein (Chomyn et al., 1986; Mercer et al., 2011).
Figure 1A depicts the strategy for separately labelling mtDNA and mtRNA transcripts using two RNAscope™ probes against each strand of the mitochondrial gene MT-ND5. For consistency in this manuscript, the “coding” MT-ND5 probe sequence is antisense, binding both mtRNA transcripts and the mtDNA light strand. The “noncoding” MT-ND5 probe sequence is sense, binding primarily to the mtDNA heavy strand.
Figure 1. (A) Simplified schematic of protein synthesis from mtDNA. mtRNA transcripts from the mtDNA coding strand are processed and translated into protein; transcripts from the noncoding strand are typically degraded. Accordingly, the RNAscope™ Dr-MT-ND5 “coding” probe reports both mtRNA and mtDNA, while the “noncoding” probe reports primarily mtDNA. (B) Workflow for mtDNA and mtRNA detection using RNAscope™ and IHC. RNAscope™ steps were carried out using the manufacturer’s protocol for the Fluorescent Multiplex v2 kit, with modifications listed in the methods section. (C) Images of zebrafish outer retina stained with a control probe against Polr2a nuclear-encoded mRNA, and a control probe against bacterial-encoded DapB mRNA. RNase treatment eliminates Polr2a mRNA signal.
3.2 Probe validation strategies3.2.1 Enzymatic validationTo determine the relative contribution of RNA to probe signals, we employed an optional RNase incubation step prior to probe hybridization (Figure 1B). We used an RNAscope™ positive control probe against messenger RNA (mRNA) transcripts from the nuclear-encoded housekeeping gene Polr2a, and a negative control probe against mRNA transcripts from the bacterial gene DapB. In zebrafish retina sections, the Polr2a probe labeled puncta around nuclei that were absent with RNase pretreatment; no puncta were visible with the DapB probe (Figure 1C).
Further enzymatic validation using DNase to digest mtDNA has been reported for paraffin sections (Chen et al., 2020). We attempted this repeatedly with fixed frozen retina sections but results were difficult to interpret, as DNases removed most of the RNA signal from the positive control mRNA probe. One explanation is that structural damage to the tissue from DNase is more severe in fixed frozen sections, causing RNA to float away before probe hybridization. This is an important control that could be successful in other tissues, but likely necessitates paraffin sections.
3.2.2 ISH and IHC multiplexingTo confirm that MT-ND5 probe signals were localized to mitochondria, we expanded the RNAscope™ procedure to include subsequent immunolabelling (Figure 1B). The pretreatment conditions required for RNAscope™ destroyed antigenicity of some primary antibody targets, while antigenicity was unaffected or improved for others. Table 1 lists primary antibodies we have used to successfully immunolabel various cell structures following ISH in zebrafish, macaque, or human tissue cryosections.
A primary antibody against MTCO1, a subunit of respiratory complex IV, displayed a robust mitochondrial staining pattern (Figure 1C, second row) following ISH that is typical of zebrafish retina stained using conventional IHC (Giarmarco et al., 2020). When ISH against MT-ND5 and IHC against MTCO1 were multiplexed, signals from coding and noncoding probes were confined to mitochondria (Figure 2A), demonstrating that the MT-ND5 probes are not binding off-target nuclear-encoded genes. Mitochondria in zebrafish photoreceptors are tightly packed and do not immunolabel uniformly (see U-shaped structures in Figure 1C, second row), but IHC is still useful for broad morphometrics like cluster size and outline.
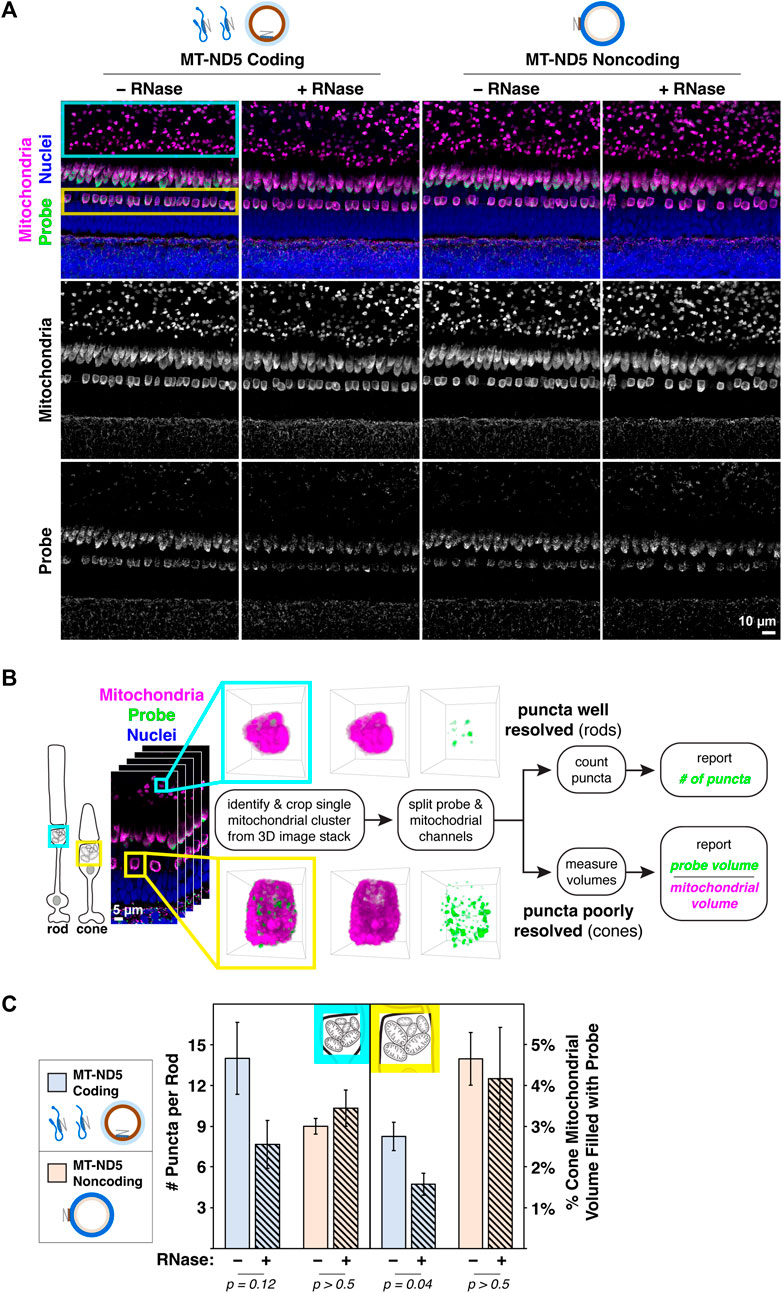
Figure 2. (A) Images of zebrafish outer retina showing signals from RNAscope™ MT-ND5 coding and noncoding probes. Cyan and yellow boxes indicate respective locations of rod and cone mitochondrial clusters used for quantification. RNase was used to determine signal contributions of RNA for each probe. All sections were counterstained for nuclei and mitochondria via IHC. Green–probe (ISH), magenta–mitochondria (IHC), blue–nuclei. (B) Workflow for quantification of MT-ND5 probe signals as either puncta counts or percent of mitochondrial volume. (C) Quantification of signals from coding and noncoding probes, including RNase conditions. Error bars represent standard error of the mean; p values determined using a Mann-Whitney test.
Immunolabelling with antibodies against dsRNA or dsDNA is also useful for validation of mitochondrial probes. We did not employ this method in our samples because IHC quantification is confounded by limitations with antibody penetration. However, dual labeling with RNAscope™ and anti-dsRNA has been reported for cultured primate cells (Liu et al., 2018).
3.2.3 Bulk analysisGiven the difficulty using DNase as a control for RNAscope TM superscript on cryosections, bulk analysis using quantitative PCR (qPCR) can be used to confirm findings about mtDNA. By comparing the number of mitochondrial and nuclear genomes in a sample, mtDNA copy number per cell can be calculated (Artuso et al., 2012). While cell-specific information is lost, patterns in mtDNA copy numbers found using RNAscope TM superscript should be consistent with observations made using qPCR. We demonstrate validation using qPCR in a proof-of-principle experiment below (Figure 3C).
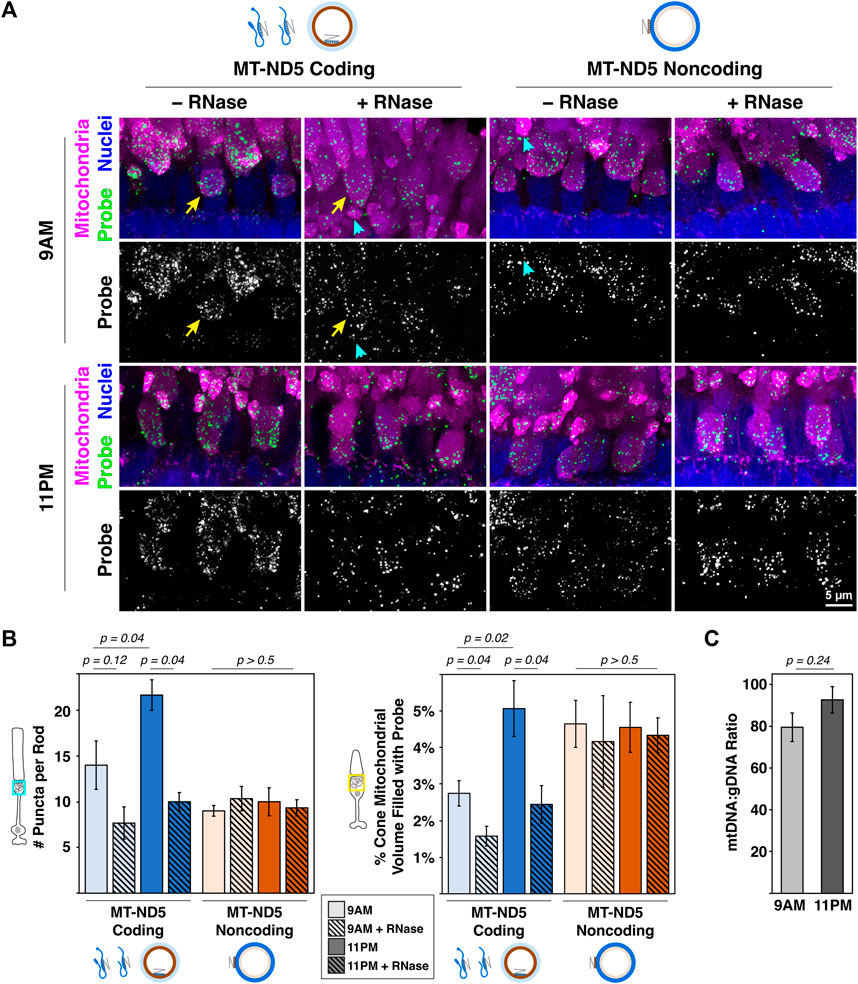
Figure 3. (A) Sample images of zebrafish photoreceptor mitochondrial clusters from 9 a.m. to 11 p.m. labeled with RNAscope™ MT-ND5 coding or noncoding probes. RNase was used to determine signal contributions of RNA for each probe. All sections were counterstained for nuclei and mitochondria via IHC. Cyan arrowheads and yellow arrows indicate examples of single rod and cone mitochondrial clusters used for quantification, respectively. Green–probe (ISH), magenta–mitochondria (IHC), blue–nuclei. (B) Quantification of signals from coding and noncoding probes at 9 a.m. and 11 p.m., including RNase conditions. (C) Ratios of mtDNA to gDNA measured using RT-qPCR from whole zebrafish retinas at 9 a.m. and 11 p.m.. For all graphs, error bars represent standard error of the mean; p values determined using a Mann-Whitney test.
3.3 Quantification of mtDNA and mtRNAAs a demonstration of the multiplex labeling strategy, we sought to quantify mitochondrial RNAscope™ signals in photoreceptors of zebrafish retina, where mitochondria are concentrated in a dense cluster. We employed two strategies for quantification, outlined in Figure 2B.
For rods, quantification of MT-ND5 signals was straightforward. Individual puncta within a cluster were well resolved, and we used the 3D Object Counter plugin for ImageJ to report the number of puncta per cluster. For cones, quantification was limited by the dense packing of cone mitochondria, and the resolution of our microscope. Despite careful titration of MT-ND5 probes and their conjugated dyes, we could not reliably resolve individual puncta in all areas of a cluster. Instead, we used the 3D Objects Counter plugin for ImageJ to report probe volume as a percentage of overall cluster volume determined from IHC.
RNase pretreatment modestly reduced signal from the coding probe but not the noncoding probe (Figure 2C). Insensitivity of the noncoding probe to RNase confirms that it does not appreciably bind mtRNA.
3.4 Demonstration quantifying mtDNA and mtRNA in photoreceptorsMitochondrial dynamics in rod photoreceptors are not well characterized, but cone clusters undergo daily remodeling. Their mitochondria are smaller and more numerous at night (Giarmarco et al., 2020) when energy demands are highest (Okawa et al., 2008), and it is not known how mtDNA and mtRNA change. In retina samples collected during the day (9 a.m.) and at night (11 p.m.), both MT-ND5 probes yielded robust signal in rod and cone mitochondrial clusters (Figure 3A). A subset of these samples was pretreated with RNase to determine the relative contribution of mtRNA to MT-ND5 signals.
Figure 3B summarizes the analyses of MT-ND5 coding and noncoding probe signals. Only the coding probe was significantly sensitive to RNase pretreatment (solid v. hashed bars), confirmation that the noncoding probe primarily reports mtDNA. In rods, the number of coding probe puncta increased 35% between 9 a.m. and 11 p.m., and noncoding puncta were not significantly different. A similar pattern was observed in cones, where volume of the coding probe increased 45% between 9 a.m. and 11 p.m., but noncoding probe volumes were unchanged.
Given the increase in mitochondrial number previously reported at night, we were surprised to find no change in mtDNA levels using the MT-ND5 noncoding probe. We further validated this finding by performing qPCR to report relative mtDNA copy number in whole retinal homogenates collected at 9 a.m. and 11 p.m.. Ratios of mtDNA:gDNA determined via qPCR were not significantly different between 9 a.m. and 11 p.m. (Figure 3C), consistent with observations made using RNAscope™.
Together this suggests that a burst of mitochondrial transcription, evidenced by increases in coding probe signal, could support a larger population of mitochondria at night in cones. Overall mtDNA levels remain unchanged, indicating that either existing mitochondrial genomes are simply divided among the growing population, and/or that some amount of mtDNA turnover is occurring. Alternately, it is possible that mtDNA levels rise at a timepoint that was not measured in this study.
4 DiscussionWe present a method for spatial quantification of mtDNA and mtRNA in fixed frozen tissue sections. It employs a dual-probe strategy for RNAscope™ ISH similar to a published method in paraffin sections (Chen et al., 2020), coupled with IHC for unambiguous labeling of mitochondria. The protocol uses commercially-available reagents, can be carried out over 2–3 days, and is broadly adaptable to many species and tissues. It will enable researchers to characterize mitochondrial gene expression in single cells, and understand the mitochondrial adaptations that occur during disease, stress and aging.
Conventional methods for measuring mtDNA and mtRNA such as RT-qPCR often require tissue homogenization, which presents challenges to studying specific cells. In the example of the retina, photoreceptors are just part of a tissue comprised of around 100 cell types, making it difficult to discern their contribution to changes in mitochondrial gene expression above the retinal milieu. Recent advances in single-cell RNA sequencing have enabled the study of mtDNA in retinal cell subpopulations (Liu et al., 2022), but some neuron types are not represented. Further, tissue digestion and cell sorting conditions can induce stress-related changes to gene expression (Denisenko et al., 2020).
This method has several advantages over chromogenic ISH and bulk nucleotide analyses. In addition to preserving cells morphologically in their native microenvironment, rapid fixation of tissue for histology reduces risk of stress-related gene expression changes that occur during tissue dissociation. Multiplexing ISH with IHC enables counterstaining of mitochondria or other cell-identifying markers, making for unambiguous quantification of ISH signals. We found several primary antibodies suitable for ISH and IHC multiplexing (Table 1). Lastly, the high resolution afforded by confocal microscopy allows for visualization of single mtDNA or mtRNA molecules in 3-D, and subsequent quantification.
RNAscope™ is a versatile platform amenable to many species and tissue types, and the design of double Z probe sets enables accurate target labelling with virtually no off-target binding (Wang et al., 2012). We present a simple RNAscope™ application, but depending on the kit and sample, it can be used to visualize up to 48 targets. Its application in the study of mtDNA and mtRNA is somewhat recent but gaining popularity (Blumental-Perry et al., 2020; Lee et al., 2023; Sriram et al., 2024).
Following careful biostatistics-aided probe selection, additional validation steps are critical. Antibodies detecting mitochondrial proteins and dsDNA are useful to this end, and probes targeting several mitochondrial genes would also help validate results. In the case of the zebrafish MT-ND5 probes, RNase pretreatment confirmed that the coding probe reports mtDNA and mtRNA, while the noncoding probe reports primarily mtDNA. We attempted pretreatment with DNase as additional enzymatic validation, but it was not compatible with RNAscope™ on fixed frozen sections. We relied on qPCR comparing total amounts of gDNA and mtDNA as confirmation of our results.
In an example analysis of mtDNA and mtRNA in zebrafish photoreceptors, mtRNA levels increased 35%–45% between 9 a.m. and 11 p.m., a finding consistent with cone mitochondrial proliferation (Giarmarco et al., 2020) and increased photoreceptor energy consumption at night (Okawa et al., 2008). Interestingly mtDNA levels remained stable, highlighting the complicated nature of mitochondrial gene expression. It is possible that daily turnover of mitochondrial genomes keeps mtDNA levels stable, as cycles of mtRNA expression and degradation support changes to the mitochondrial population. This supports the idea that increases in cone mitochondrial number are driven primarily by increased gene expression, rather than a net increase in mtDNA copy number.
While our example analysis uncovered significant differences in mtRNA levels, there are limitations to quantification depending on the cell type and mitochondrial organization. In zebrafish rods, mitochondria are large and reside in a small cluster. mtDNA and mtRNA molecules were clearly resolved within rod clusters, making quantification straightforward. In contrast, cones have hundreds of smaller mitochondria concentrated in a dense cluster, and mtDNA and mtRNA molecules are very crowded. In such cases, it is important to titrate the concentrations of probe and fluorescent dye to best achieve individual puncta; even then we were unable to resolve individual puncta across the entire cone cluster. Reporting volume fractions was an effective strategy for demonstration of the method, however counts of individual puncta are most accurate. This could be achieved by utilizing super-resolution imaging (Liu and Rask-Andersen, 2022), and/or deploying machine learning analysis tools (Burkert et al., 2023).
Probe selection is an important consideration when using RNAscope™ to report mtDNA and mtRNA. We selected the MT-ND5 gene based on success with the commercially available MT-ND5 coding probe for zebrafish, and had the MT-ND5 noncoding probe custom designed by the manufacturer and their bioinformatics team. Because both probes target the same gene, they likely contain complementary sequences that would bind each other in solution when attempting to duplex both probes. Indeed, our attempts at duplexing coding and noncoding probes were difficult to interpret, despite tandem hybridization steps and labelling with spectrally separate dyes. To successfully duplex coding and noncoding probes on the same section, two different mitochondrial genes would need to be targeted.
Another factor to keep in mind when interpreting results from this method is probe affinity. In our example of zebrafish cones, 3-D electron microscopy in a previous study found ∼180 mitochondria per cluster at 9 a.m. In a few instances where RNAscope™ mtDNA puncta in a cluster were resolved well enough for counting using 3-D segmentation and manual counting, we found roughly half that number of mtDNA molecules. While it is possible that some mitochondria in this system lack a genome, another explanation is that the probe did not bind every mitochondrial genome. Coding and noncoding probes may not have the same affinity for their target sequences, so it is important to include enzymatic validation, use several probes, and exercise caution when making direct numerical comparisons.
In conclusion, we have optimized a method of multiplexed ISH and IHC that can detect mtDNA and mtRNA at single molecule resolution. Using machine learning and super resolution imaging strategies, this method holds promise for precisely quantifying determinants of mitochondrial health, such as mtDNA copy number and gene expression. This spatial information can address new questions about mitochondrial biology at the level of an individual mitochondrion, in different locations within a cell or tissue, or in particular stages of the mitochondrial life cycle.
Data availability statementThe original contributions presented in the study are included in the article/Supplementary Material, further inquiries can be directed to the corresponding author.
Ethics statementThe animal study was approved by University of Washington Institutional Animal Care and Use Committee. The study was conducted in accordance with the local legislation and institutional requirements.
Author contributionsMG: Writing–original draft, Visualization, Validation, Supervision, Resources, Project administration, Methodology, Investigation, Formal Analysis, Data curation, Conceptualization. JS: Writing–review and editing, Visualization, Validation, Methodology, Investigation, Formal Analysis, Data curation. DB: Data curation, Formal analysis, Investigation, Validation, Writing–review and editing. SB: Writing–review and editing, Supervision, Resources, Project administration, Methodology, Funding acquisition, Conceptualization.
FundingThe author(s) declare financial support was received for the research, authorship, and/or publication of this article. This work was supported by NIH NEI Grants P30EY001730 to Maureen Neitz, and R01EY026020 to SB.
Conflict of interestThe authors declare that the research was conducted in the absence of any commercial or financial relationships that could be construed as a potential conflict of interest.
Publisher’s noteAll claims expressed in this article are solely those of the authors and do not necessarily represent those of their affiliated organizations, or those of the publisher, the editors and the reviewers. Any product that may be evaluated in this article, or claim that may be made by its manufacturer, is not guaranteed or endorsed by the publisher.
ReferencesArtuso, L., Romano, A., Verri, T., Domenichini, A., Argenton, F., Santorelli, F. M., et al. (2012). Mitochondrial DNA metabolism in early development of zebrafish (Danio rerio). Biochim. Biophys. Acta 1817, 1002–1011. doi:10.1016/j.bbabio.2012.03.019
PubMed Abstract | CrossRef Full Text | Google Scholar
Ball, J. M., Chen, S., and Li, W. (2022). Mitochondria in cone photoreceptors act as microlenses to enhance photon delivery and confer directional sensitivity to light. Sci. Adv. 8 (9), eabn2070. doi:10.1126/sciadv.abn2070
PubMed Abstract | CrossRef Full Text | Google Scholar
Blumental-Perry, A., Jobava, R., Bederman, I., Degar, A. J., Kenche, H., Guan, B. J., et al. (2020). Retrograde signaling by a mtDNA-encoded non-coding RNA preserves mitochondrial bioenergetics. Commun. Biol. 3 (1), 626. doi:10.1038/s42003-020-01322-4
PubMed Abstract | CrossRef Full Text | Google Scholar
Bolte, S., and Cordelieres, F. P. (2006). A guided tour into subcellular colocalization analysis in light microscopy. J. Microsc. 224 (Pt 3), 213–232. doi:10.1111/j.1365-2818.2006.01706.x
PubMed Abstract | CrossRef Full Text | Google Scholar
Burkert, N., Roy, S., Häusler, M., Wuttke, D., Müller, S., Wiemer, J., et al. (2023). Deep learning-based image analysis identifies a DAT-negative subpopulation of dopaminergic neurons in the lateral Substantia nigra. Commun. Biol. 6 (1), 1146. doi:10.1038/s42003-023-05441-6
PubMed Abstract | CrossRef Full Text | Google Scholar
Chen, J., Zheng, Q., Peiffer, L. B., Hicks, J. L., Haffner, M. C., Rosenberg, A. Z., et al. (2020). An in situ atlas of mitochondrial DNA in mammalian tissues reveals high content in stem and proliferative compartments. Am. J. Pathol. 190 (7), 1565–1579. doi:10.1016/j.ajpath.2020.03.018
PubMed Abstract | CrossRef Full Text | Google Scholar
Chomyn, A., Cleeter, M. W., Ragan, C. I., Riley, M., Doolittle, R. F., and Attardi, G. (1986). URF6, last unidentified reading frame of human mtDNA, codes for an NADH dehydrogenase subunit. Science 234 (4776), 614–618. doi:10.1126/science.3764430
PubMed Abstract | CrossRef Full Text | Google Scholar
Denisenko, E., Guo, B. B., Jones, M., Hou, R., de Kock, L., Lassmann, T., et al. (2020). Systematic assessment of tissue dissociation and storage biases in single-cell and single-nucleus RNA-seq workflows. Genome Biol. 21 (1), 130. doi:10.1186/s13059-020-02048-6
PubMed Abstract | CrossRef Full Text | Google Scholar
Filograna, R., Mennuni, M., Alsina, D., and Larsson, N. G. (2021). Mitochondrial DNA copy number in human disease: the more the better? FEBS Lett. 595 (8), 976–1002. doi:10.1002/1873-3468.14021
PubMed Abstract | CrossRef Full Text | Google Scholar
Giarmarco, M. M., Brock, D. C., Robbings, B. M., Cleghorn, W. M., Tsantilas, K. A., Kuch, K. C., et al. (2020). Daily mitochondrial dynamics in cone photoreceptors. Proc. Natl. Acad. Sci. U. S. A. 117 (46), 28816–28827. doi:10.1073/pnas.2007827117
PubMed Abstract | CrossRef Full Text | Google Scholar
Gorman, G. S., Chinnery, P. F., DiMauro, S., Hirano, M., Koga, Y., McFarland, R., et al. (2016). Mitochondrial diseases. Nat. Rev. Dis. Prim. 2, 16080. doi:10.1038/nrdp.2016.80
PubMed Abstract | CrossRef Full Text | Google Scholar
Houten, S. M., and Wanders, R. J. (2010). A general introduction to the biochemistry of mitochondrial fatty acid β-oxidation. J. Inherit. Metab. Dis. 33 (5), 469–477. doi:10.1007/s10545-010-9061-2
PubMed Abstract | CrossRef Full Text | Google Scholar
Jedynak-Slyvka, M., Jabczynska, A., and Szczesny, R. J. (2021). Human mitochondrial RNA processing and modifications: overview. Int. J. Mol. Sci. 22 (15), 7999. doi:10.3390/ijms22157999
PubMed Abstract | CrossRef Full Text | Google Scholar
Lee, W., Zamudio-Ochoa, A., Buchel, G., Podlesniy, P., Marti Gutierrez, N., Puigròs, M., et al. (2023). Molecular basis for maternal inheritance of human mitochondrial DNA. Nat. Genet. 55 (10), 1632–1639. doi:10.1038/s41588-023-01505-9
PubMed Abstract | CrossRef Full Text | Google Scholar
Liu, B., He, J., Zhong, L., Huang, L., Gong, B., Hu, J., et al. (2022). Single-cell transcriptome reveals diversity of Müller cells with different metabolic-mitochondrial signatures in normal and degenerated macula. Front. Neurosci. 16, 1079498. doi:10.3389/fnins.2022.1079498
PubMed Abstract | CrossRef Full Text | Google Scholar
Liu, J., Kline, B. A., Kenny, T. A., Smith, D. R., Soloveva, V., Beitzel, B., et al. (2018). A novel sheet-like virus particle array is a hallmark of Zika virus infection. Emerg. Microbes Infect. 7 (1), 69–11. doi:10.1038/s41426-018-0071-8
PubMed Abstract | CrossRef Full Text | Google Scholar
Liu, W., and Rask-Andersen, H. (2022). GJB2 and GJB6 gene transcripts in the human cochlea: a study using RNAscope, confocal, and super-resolution structured illumination microscopy. Front. Mol. Neurosci. 15, 973646. doi:10.3389/fnmol.2022.973646
PubMed Abstract | CrossRef Full Text | Google Scholar
Livak, K. J., and Schmittgen, T. D. (2001). Analysis of relative gene expression data using real-time quantitative PCR and the 2(-Delta Delta C(T)) Method. Methods 25, 402–408. doi:10.1006/meth.2001.1262
PubMed Abstract | CrossRef Full Text | Google Scholar
Lyamzaev, K. G., Zinovkin, R. A., and Chernyak, B. V. (2022). Extrusion of mitochondria: garbage clearance or cell-cell communication signals? J. Cell Physiol. 237 (5), 2345–2356. doi:10.1002/jcp.30711
PubMed Abstract | CrossRef Full Text | Google Scholar
Mercer, T. R., Neph, S., Dinger, M. E., Crawford, J., Smith, M. A., Shearwood, A. M., et al. (2011). The human mitochondrial transcriptome. Cell 146 (4), 645–658. doi:10.1016/j.cell.2011.06.051
PubMed Abstract | CrossRef Full Text | Google Scholar
Nakajima, A., Kurihara, H., Yagita, H., Okumura, K., and Nakano, H. (2008). Mitochondrial Extrusion through the cytoplasmic vacuoles during cell death. J. Biol. Chem. 283 (35), 24128–24135. doi:10.1074/jbc.M802996200
PubMed Abstract | CrossRef Full Text | Google Scholar
Okawa, H., Sampath, A. P., Laughlin, S. B., and Fain, G. L. (2008). ATP consumption by mammalian rod photoreceptors in darkness and in light. Curr. Biol. 18 (24), 1917–1921. doi:10.1016/j.cub.2008.10.029
PubMed Abstract | CrossRef Full Text | Google Scholar
Pietras, Z., Wojcik, M. A., Borowski, L. S., Szewczyk, M., Kulinski, T. M., Cysewski, D., et al. (2018). Dedicated surveillance mechanism controls G-quadruplex forming non-coding RNAs in human mitochondria. Nat. Commun. 9 (1), 2558. doi:10.1038/s41467-018-05007-9
PubMed Abstract | CrossRef Full Text | Google Scholar
Rizzuto, R., De Stefani, D., Raffaello, A., and Mammucari, C. (2012). Mitochondria as sensors and regulators of calcium signalling. Nat. Rev. Mol. Cell Biol. 13 (9), 566–578. doi:10.1038/nrm3412
PubMed Abstract | CrossRef Full Text | Google Scholar
Schindelin, J., Arganda-Carreras, I., Frise, E., Kaynig, V., Longair, M., Pietzsch, T., et al. (2012). Fiji: an open-source platform for biological-image analysis. Nat. Methods 9 (7), 676–682. doi:10.1038/nmeth.2019
PubMed Abstract | CrossRef Full Text | Google Scholar
Sriram, K., Qi, Z., Yuan, D., Malhi, N. K., Liu, X., Calandrelli, R., et al. (2024). Regulation of nuclear transcription by mitochondrial RNA in endothelial cells. Elife 13, e86204. doi:10.7554/eLife.86204
PubMed Abstract | CrossRef Full Text | Google Scholar
St John, J. C., Facucho-Oliveira, J., Jiang, Y., Kelly, R., and Salah, R. (2010). Mitochondrial DNA transmission, replication and inheritance: a journey from the gamete through the embryo and into offspring and embryonic stem cells. Hum. Reprod. Update 16 (5), 488–509. doi:10.1093/humupd/dmq002
PubMed Abstract | CrossRef Full Text | Google Scholar
Wang, F., Flanagan, J., Su, N., Wang, L. C., Bui, S., Nielson, A., et al. (2012). RNAscope: a novel in situ RNA analysis platform for formalin-fixed, paraffin-embedded tissues. J. Mol. Diagn 14 (1), 22–29. doi:10.1016/j.jmoldx.2011.08.002
PubMed Abstract | CrossRef Full Text | Google Scholar
Willems, P. H., Rossignol, R., Dieteren, C. E., Murphy, M. P., and Koopman, W. J. (2015). Redox homeostasis and mitochondrial dynamics. Cell Metab. 22 (2), 207–218. doi:10.1016/j.cmet.2015.06.006
PubMed Abstract | CrossRef Full Text | Google Scholar
Wu, Y., Whiteus, C., Xu, C. S., Hayworth, K. J., Weinberg, R. J., Hess, H. F., et al. (2017). Contacts between the endoplasmic reticulum and other membranes in neurons. Proc. Natl. Acad. Sci. U. S. A. 114 (24), E4859–E4867. doi:10.1073/pnas.1701078114
留言 (0)