
記住我


Animals employed in this study were 6–8-week-old C57BL/6 female mice, obtained from Charles-River (Milan, Italy). Mice were housed under constant conditions in an animal facility with a regular 12 h light/dark cycle. Food and water were supplied ad libitum. All the efforts were made to minimize the number of animals used and their suffering. In particular, when animals experienced hindlimb weakness, moistened food and water were made easily accessible to the animals on the cage floor. Mice with hindlimb paresis received glucose solution by subcutaneous injection or food by gavage during the entire procedure. In the rare presence of a tetraparalyzed animal, mice were sacrificed. Minipump-implanted mice were housed in individual cages endowed with special bedding (TEK-Fresch, Envigo, Casatenovo (LC), Italy) in order to avoid skin infections around the surgical scar. Animal experiments were performed according to the Internal Institutional Review Committee, the European Directive 2010/63/EU and the European Recommendations 526/2007, and the Italian D.Lgs 26/2014.
EAE modelChronic-progressive EAE was induced as previously described [23]. Six-eight weeks old C57BL/6 female mice were active immunized with an emulsion of mouse myelin oligodendrocyte glycoprotein peptide 35–55 (MOG35–55, 85% purity; 0,66 mg/ml; Espikem, Prato, Italy) in Complete Freund’s Adjuvant (CFA; Difco, Los Altos, CA, USA), followed by intravenous administration of pertussis toxin (500 ng; Merck, Milan, Italy) on the day of immunization and two days post immunization (dpi). Control mice, hereafter referred to as CFA, received the same treatment as EAE mice without the MOG peptide, including complete CFA and Pertussis toxin. Animals were daily scored for clinical symptoms of EAE according to the following scale: 0 no clinical signs; 1 flaccid tail; 2 hindlimb weakness; 3 hindlimb paresis; 4 tetraparalysis; and 5 death due to EAE; intermediate clinical signs were scored by adding 0.5. The body weight (g) of each mouse was measured over the course of the disease course and compared with body weight value at 0 dpi.
Grip strength testAll mice were tested for grip strength performance using the Grip Strength Meter (Ugo Basile, Italy), as in [24] at 2,7,14 and 21 dpi. The Grip Strength Meter consisted of a steel wire grid (8 × 8 cm) connected to an isometric force transducer. Mice were lifted by their tail so that they grasp the grid with their paws. Mice from the two experimental groups were then gently pulled backward until they released the grid and the maximal force in newtons (N) exerted by the mouse before losing the grip was measured. The mean of three consecutive measurements for each animal was calculated and values were normalized by mouse body weight.
BV2 immortalized murine microglial cell lineThe BV2 immortalized murine microglial cell line was constructed by infecting primary microglia with a v-raf/v-myc oncogene-carrying retrovirus (J2). The murine BV2 microglia were cultured in DMEM supplemented with 10% FBS, 100 U/ml penicillin and 100 µg/ml streptomycin, and were maintained in a humidified incubator with 5% CO2. BV2 cells were in vitro activated for 6 h, 18 h and 24 h with a Mix of Th1-specific proinflammatory cytokines: 100 U/mL IL-1β (Euroclone, Milan, Italy), 200 U/mL tumor necrosis factor (TNF, Miltenyi Biotec, Bologna, Italy), and 500 U/mL interferon γ (IFNγ, Becton Dickinson, Milan, Italy). Only the 24 h activated BV2 cells were afterwards treated with IL-9 (100 μm) for 6 h. Then, 5 × 10^5 to 1 × 10^6 cells were put on single striatal slices (for 60 min) and whole-cell patch-clamp recordings were made as above. For biochemical evaluation, following IL-9 treatment, activated cells were cultured for 3 h in a non-activated medium. Cell medium was used for ELISA experiment (see after).
Western blotWhole striata dissected from EAE mice (i.p. treatment starting from 0 dpi) in the acute phase of the disease (24 dpi) were homogenized in RIPA buffer plus protease inhibitor mixture (Sigma) and sonicated. After sonication, the homogenates were centrifuged at 13,000 ×g for 20 min and the supernatant was collected. Protein content was quantified according to the Bradford Assay method (Thermofisher). 20 µg of striatal extract were loaded onto a sodium dodecyl-sulfate polyacrylamide gel. Gel was blotted onto Nitrocellulose membrane (Millipore). WB experiments were performed as previously described [24] and the following primary antibodies were used: o/n mouse anti-TREM2 (1:1000,R&D system); mouse anti- β-actin (1:20000, Sigma) for 1 h room temperature (RT). Membranes were incubated with a secondary HRP-conjugated IgG anti-mouse (1:10000 for β-actin and 1:2000 for TREM2, 1 h RT, Abcam). Results were presented as data normalized to β-actin and EAE-VHL or CTRL values. N = 4–5 per group for EAE mice.
TNF ELISA measurementConditioned medium from BV2 cells non-activated (control), Th1 activated and Th1 activated in the presence of IL-9 (see above) was harvested and centrifuged at 1,200 rpm in microfuge in order to remove any dead or detached cells. TNF ELISA was performed according to manifacturer’s guide (Biotechne). The medium (n = 4–5 samples for each condition) were run in the same assay. Quantification of cytokine content was made according to standard curve in the linear range (from 10 to 700 pg/ml).
ElectrophysiologyMice were killed by cervical dislocation, and corticostriatal coronal slices (200 μm) were prepared from fresh tissue blocks of the brain with the use of a vibratome. A single slice was then transferred to a recording chamber and submerged in a continuously flowing ACSF (34 °C, 2–3 mL/min) gassed with 95% O2–5% CO2. The composition of the control ACSF was (in mM): 126 NaCl, 2.5 KCl, 1.2 MgCl2, 1.2 NaH2PO4, 2.4 CaCl2, 11 glucose, 25 NaHCO3. To study spontaneous glutamate-mediated excitatory postsynaptic currents (sEPSCs), the recording pipettes were filled with internal solution of the following composition (mM): K+-gluconate (125), NaCl (10), CaCl2 (1.0), MgCl2 (2.0), 1,2-bis (2-aminophenoxy) ethane-N, N,N, N-tetra acetic acid (BAPTA; 0.5), HEPES (19), GTP; (0.3), Mg-ATP; (1.0), adjusted to pH 7.3 with KOH. Bicuculline (10 µM) was added to the external solution to block GABAA-mediated transmission.
To study GABA-mediated spontaneous inhibitory postsynaptic currents (sIPSCs), the recording pipettes were filled with internal solution of the following composition (mM): 110 CsCl, 30 K + − gluconate, 1.1 EGTA, 10 HEPES, 0.1 CaCl2, 4 Mg-ATP, 0.3 Na-GTP. MK-801 and CNQX were added to the external solution to block, respectively, NMDA and non-NMDA glutamate receptors.
The detection threshold of spontaneous currents was set at twice the baseline noise. Offline analysis was performed on spontaneous synaptic events recorded during fixed time epochs (1–2 min, three to five samplings), sampled every 5–10 min. Only cells that exhibited stable frequencies in control (less than 20% changes during the control samplings) were used for analysis. For kinetic analysis, events with peak amplitude between 10 and 50 pA were grouped, aligned by half-rise time, normalized by peak amplitude, and averaged to obtain rise times and decay times.
Real time PCR (qPCR)Total RNA was extracted from treated BV2 cells according to the standard miRNeasy Micro kit protocol (Qiagen). The RNA quantity and purity were analyzed with the Nanodrop 1000 spectrophotometer (Thermo Scientific). The quality of RNA was assessed by visual inspection of the agarose gel electrophoresis images. Next, 900 ng of total RNA was reverse-transcribed using high-capacity cDNA reverse transcription kit (Applied Biosystem) according to the manufacturer’s instructions and 27 ng of cDNA were amplified and each reaction of amplification was performed in triplicates with SensiMix II Probe Kit in triplicate using the Applied Biosystem 7900HT Fast Real Time PCR system. The expression of IL-9R (Mm00434313_m1) and TNF (Mm00443258_m1) mRNAs were evaluated by using TaqMan technology and data were represented as 2-ΔΔCt. β-actin (Mm00607939_s1) was used as endogenous control for mRNA normalization.
Immunofluorescence and confocal microscopyMice were deeply anesthetized and intracardially perfused with ice-cold 4% paraformaldehyde (PFA) at 21–25 dpi (N = 3 per group). Collected brains were post-fixed in 4% PFA for 2 h and equilibrated with 30% sucrose for at least one night. Thirty-micrometer-thick coronal sections were serially cut on a frozen microtome including the whole striatum to perform immunofluorescence experiments as previously described (20). Brain regions were identified using a mouse brain atlas, and for each animal, at least five serial sections were used for immunofluorescence as described above. The following primary antibodies were used overnight at 4 °C in Triton X-100 0.25%: rabbit anti-Iba1 (1:750, Wako), rabbit anti-GFAP (1:500, Dako), goat anti-DARPP-32 (1:1000, R&D systems), mouse anti-IL-9 receptor (1:200, Santa Cruz Biotechnology) and rat anti-CD3 (1:300, Biorad). After being washed, sections were incubated with the secondary antibody: Alexa-488 conjugated donkey anti-Rabbit, anti-Gt or anti-Rat (1:200, Invitrogen); Alexa-647 conjugated donkey anti-Rabbit (1:200, Invitrogen); Cy3-conjugated donkey anti-mouse (1:200, Jackson) for 2 h at RT. Nuclei were counterstained with DAPI (1 µl/ml; Sigma Aldrich). Images were acquired using a Nikon Eclipse TI2 confocal laser-scanner microscope with 20x and 40x objectives and were processed using ImageJ software. All images acquired by the confocal laser-scanner microscope had a pixel resolution of 1024 × 1024. Z-stack acquisitions (20x objective, zoom 1x with 2 μm interval for a total of 17 steps) were made applying the same intensity and exposure time. A large image function that generates a single high-magnification image (capturing 2 images) was made to detect IBA1+ and GFAP+ cells. In the z-projections, to evaluate microglia and astroglia density the number of IBA1+ and GFAP+ cells, respectively, were automatically determined and divided by the area covered by the Roi. Data were expressed as the number of cells per mm2. All images were processed using ImageJ software and were adjusted for reducing noise by applying smooth and background subtraction as required by the NIH ImageJ. ImageJ software was used to generate intensity threshold images (binary images), setting equal intensity thresholds between groups. A 40x objective (zoom 2x with 1 μm interval for a total of 30 steps) was used to detect IL-9 receptor expression in DARPP-32+, IBA1+, GFAP+ or CD3+ cells. A 40x objective zoom 1x with 2 μm interval for a total of 21 steps (with a large image function that generates a single high-magnification image capturing 4 images) was used to detect IBA1 and TNF. Binary images of IBA1 ImageJ software were used to quantify the microglial total area (IBA1+ surface %) in z-projected images and the measure of microglial surface was calculated by the software. Binary images on single steps of IBA1 and TNF were used to generate a colocalization mask to visualize IBA1 and TNF colocalization. Then single images were z-projected (Mk, TNF/IBA1) and merged on the binary images of IBA-1. Mk total area (TNF/IBA-1 surface %) was calculated by the software.
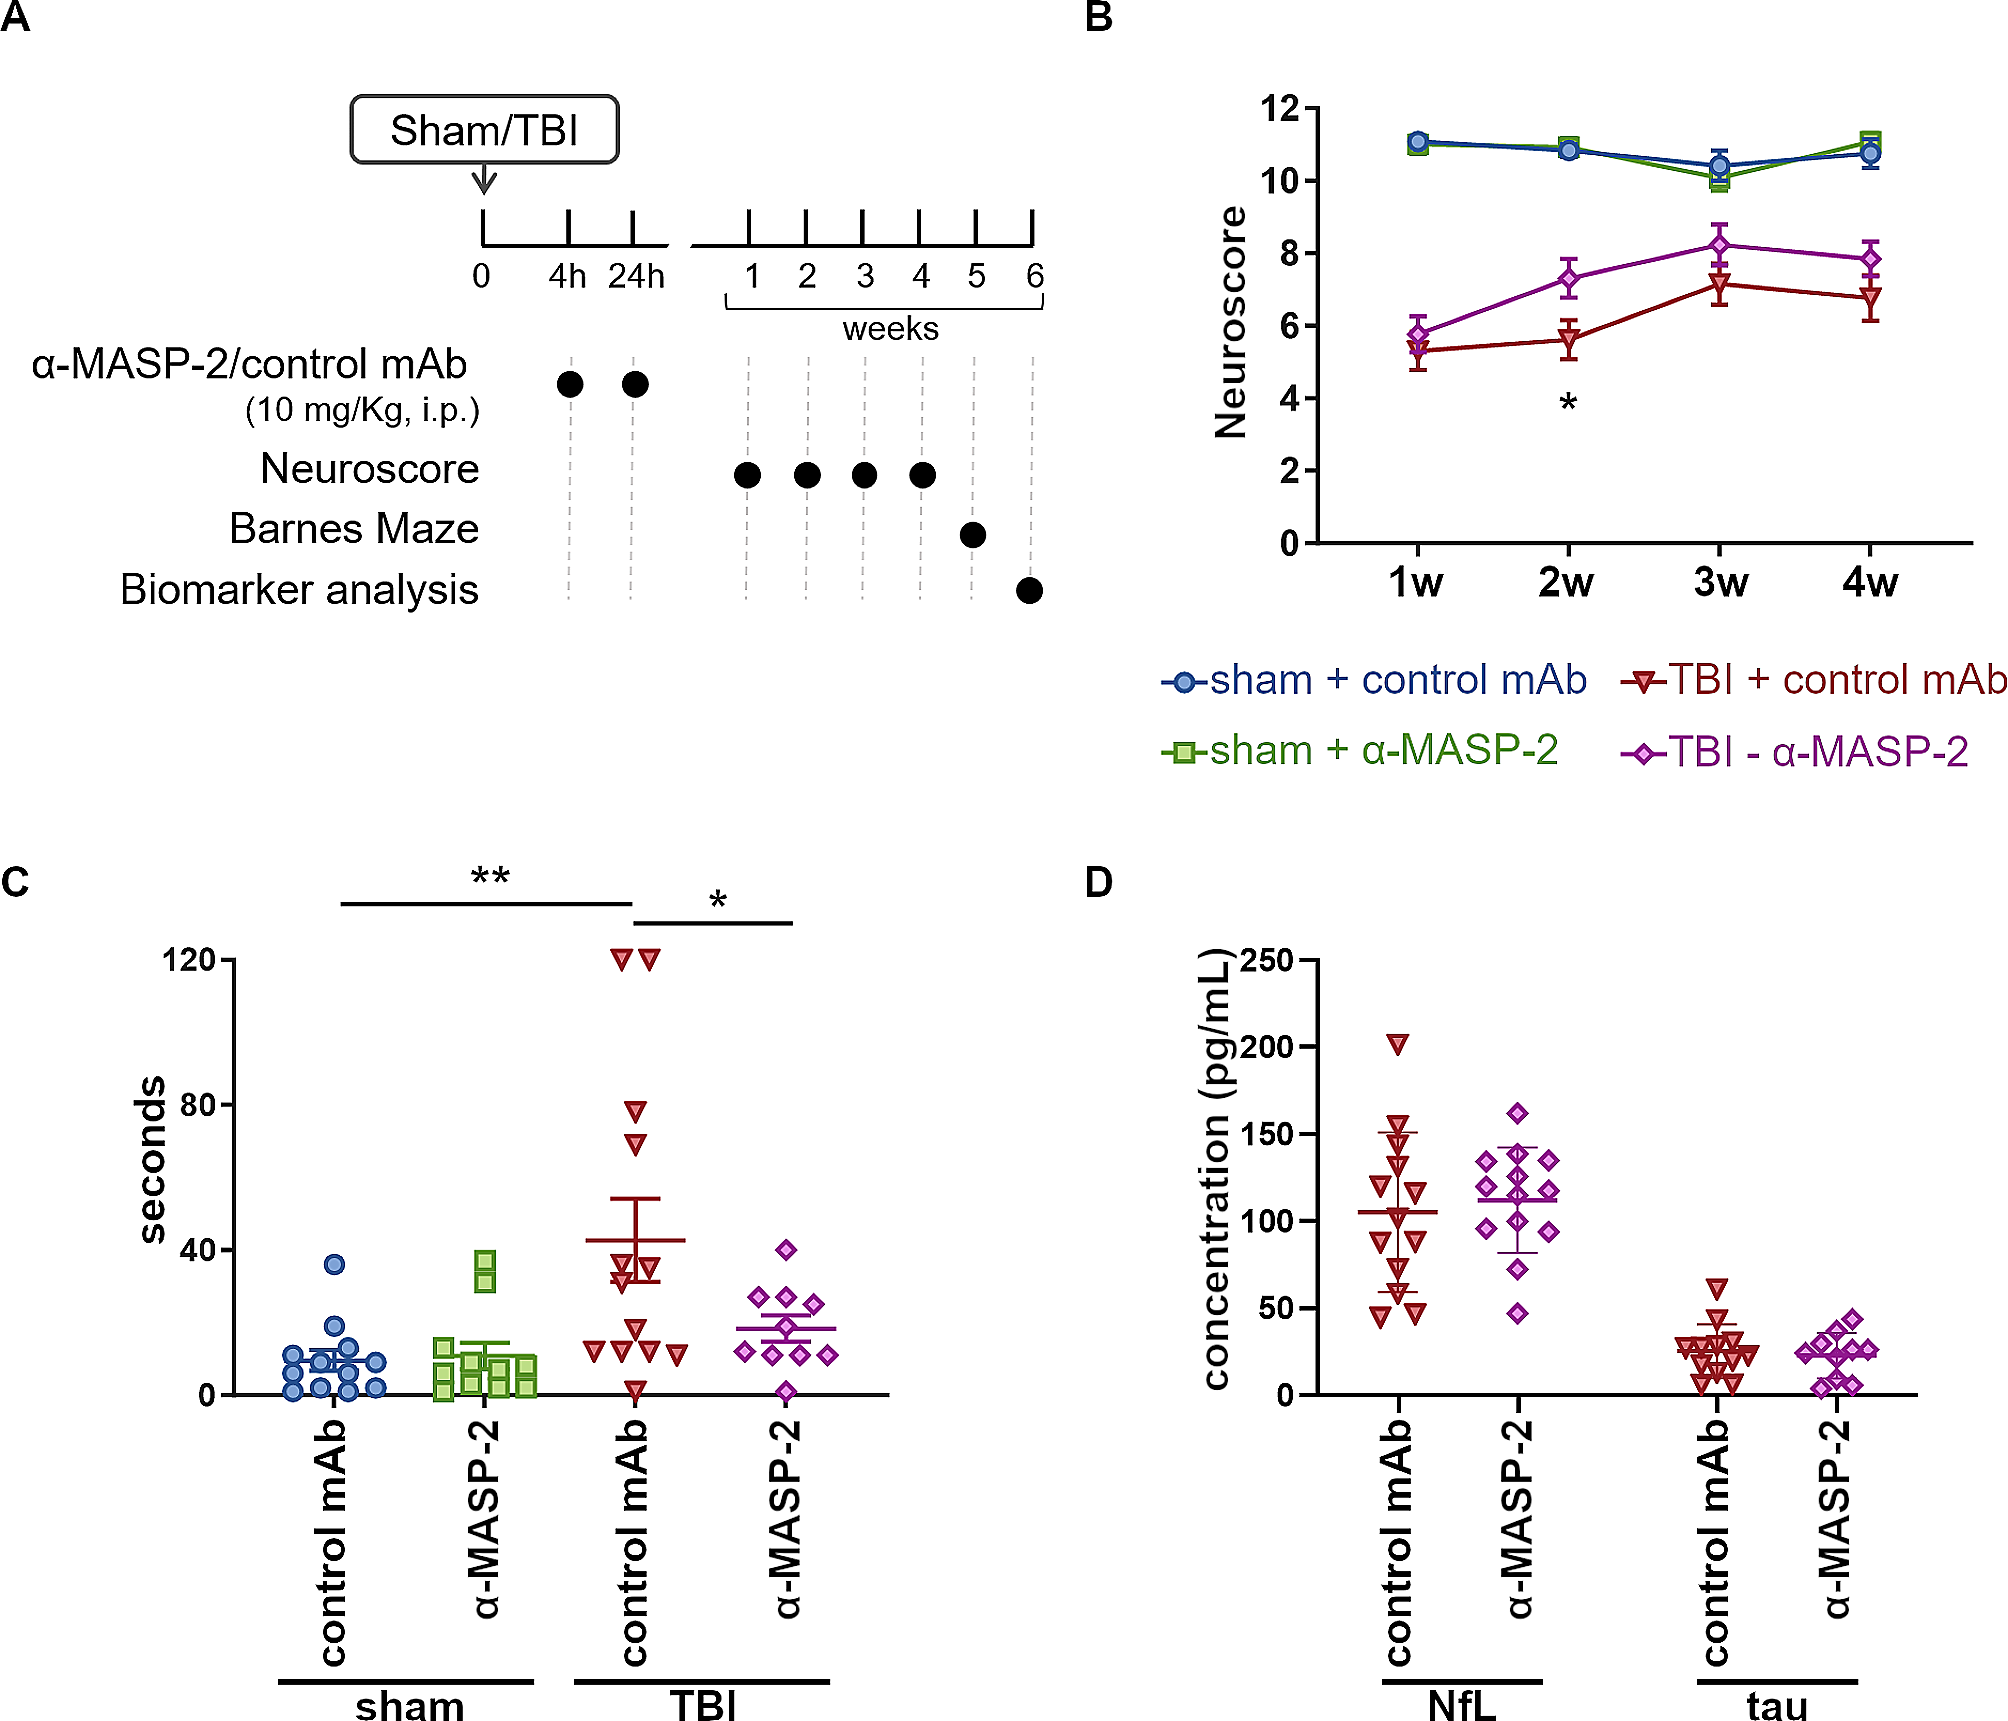
IL-9 treatmentAs schematized in experimental design (Fig. 1A-A’) three different in vivo treatments were performed at different times of EAE disease. The following intraperitoneal (ip) treatments were performed: peripheral treatment with IL-9 (200ng/mouse/day; Peproteck) and PBS as vehicle starting at 0 dpi (preventative treatment) and at onset of EAE (around 12–14 dpi, therapeutic treatment). Central treatment was performed by implanting, one week before immunization, a subcutaneous osmotic minipumps allowing continuous intracerebroventricular (icv) infusion of either IL-9 (30ng/mouse/day) or vehicle, for 4 weeks. Alzet osmotic minipumps (model 1004; Durect) connected via catheter tube to an intracranial cannula (Brain Infusion Kit 3; Alzet), delivered vehicle or IL-9 into the right lateral ventricle at a continuous rate of 0.11 µl/h. The coordinates used for icv minipump implantation were as follows: anteroposterior = − 0.4 mm from bregma; lateral = − 1 mm; depth: 2.5 mm from the skull.
Fig. 1
IL-9 effects on EAE disease and striatal synaptic transmission. A-A’) Schematic representation of the experimental design. A)In vivo experiments. Three in vivo treatments were performed at different times of EAE disease: peripheral intraperitoneal (i.p.) injections of IL-9 or vehicle (VHL) was carried out starting both from the day of EAE induction (preventative treatment, in yellow) and from the day of disease onset (therapeutic treatment, in purple). Central intracerebroventricular infusion of IL-9 or VHL was performed starting one week before immunization for four weeks (in blue). A’)In vitro experiments. BV2 immortalized murine microglial cells were activated with a Th1 Mix and treated with IL-9. B) The graph shows the clinical course of EAE mice treated with IL-9 (200 ng/mouse/day) or VHL (PBS) starting from the day of EAE induction (one of two different experimental sets). IL-9 treatment significantly ameliorated EAE disease progression. EAE VHL N = 9, EAE IL-9 N = 8; Mann-Whitney test from day 18 to 30 dpi, ***p < 0.001. c) Plasma levels of IL-9 in EAE mice following i.p. injections of IL-9 or VHL. EAE VHL N = 3, EAE IL-9 N = 3 unpaired T-test *p < 0.05. D-F) Electrophysiological properties recorded by whole-cell patch clamp technics from MSNs of EAE mice after ip injections from 0 dpi. Rise time, decay time and half width of glutamatergic currents, were increased in EAE striatum and were completely rescued in EAE IL-9 mice (D), CTR n = 7, EAE VHL n = 15, EAE IL-9 n = 18; one-way ANOVA followed by Tukey’s post hoc, *p < 0.05, ***p < 0.001; The frequency of the glutamatergic currents was unaffected by IL-9 treatment in EAE mice (D) CTR n = 9, EAE VHL n = 12, EAE IL-9 n = 12. Frequency and amplitude of GABAergic transmission were comparable between IL-9 and vehicle EAE-treated mice (E) EAE VHL n = 15, EAE IL-9 n = 9; Unpaired T-test p > 0.05. Ex vivo treatment of corticostriatal slices from control mice with IL-9 (100 μm, 1 h) didn’t impact on glutamatergic synaptic transmission (F), Frequency: CTR n = 14, CTR IL-9 n = 17; kinetic parameters: CTR n = 10, CTR IL-9 n = 24; unpaired T-test p > 0.05. Example of electrophysiological traces on the bottom
For the ex vivo electrophysiological experiments, fresh striatal slices were incubated with IL-9 (100 μm), for 1 h. For BV2 experiments, 24 h activated BV2 cells were treated with IL-9 (100 μm) for 6 h.
Statistical analysisStatistical analysis was performed with Prism GraphPad version 9.0. Data distribution was tested for normality by using Kolmogorov–Smirnov test. Non-normally distributed data were analyzed through non-parametric tests. Differences between two groups were analysed using two-tailed Unpaired Student’s t test or Mann Whitney test, as appropriate. Multiple comparisons were performed by ANOVA followed by Tukey’s HSD. The two-way ANOVA for repeated measures was used to assess the interaction between time and treatment. Data were presented as the mean ± S.E.M, unless otherwise specified. The significance level was established at p < 0.05. Throughout the text “N” refers to the number of animals. For electrophysiological experiments, quantitative immunofluorescence, and biochemical analysis “n” refers to the number of slices or BV2/BV2 medium samples.
留言 (0)