Patient and informed consent
The patient was admitted to Xinhua Hospital, Shanghai Jiao Tong University School of Medicine in June 2023. The study was conducted with the consent of the patient’s guardian. All studies were done in agreement with the protocol of the ethics committee of Xinhua Hospital, Shanghai Jiao Tong University School of Medicine.
Whole exome sequencing and mitochondrial genomic sequencing
Whole exome sequencing (WES) sequencing and mitochondrial genomic sequencing were performed using Illumina HiSeq 2000 sequencer (Illumina, USA) [12, 13]. DNA was obtained from peripheral blood of the patient and his parents, and qualitative analysis was performed by agarose gel electrophoresis. After constructing the DNA library, the sequence was captured, and high-throughput sequencing was performed using Illumina HiSeq 2000 sequencer. Quality control was then performed on the original sequencing results, including removing low-quality sequence fragments, filtering out low-quality bases and low-coverage sequencing fragments. The sequence data were aligned to the human reference genome (GRCh38/hg38). Germline short variants (SNPs, insertions or deletions) were analyzed by the genome analysis toolkit (GATK). The pathogenicity of the variant was assessed by the filters such as allele frequency, and its effect on protein function, consistent with the pathogenesis of the recessive model.
Variants analysis
To verify the variant site and detect the mtDNA mutation loads, 1 mL of venous blood was collected from the patient and his parents. Oral epithelial cells were collected using a disposable throat swab. DNA was extracted using a small amount of genomic DNA extraction kit (Beyotime, China). Amplification primers were as follows: forward: 5′- CATACCCCCGATTCCGCTAC-3′; reverse: 5′-TGTGATGAGTGTGCCTGCAA-3′. The DNA was amplified using Taq Plus Polymerase (Vazyme, China) and then sent for Sanger sequencing.
Pathogenicity prediction
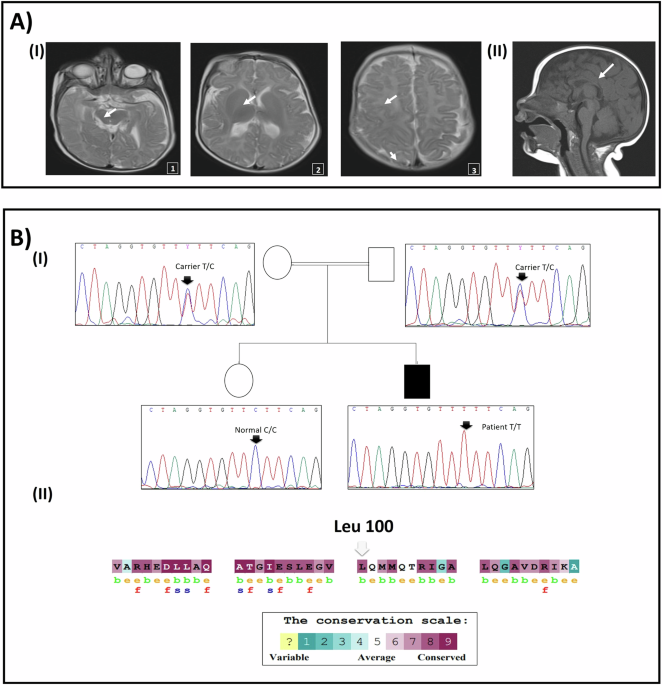
To analyze the pathogenicity of m.4344T>C, we used ClustalW program to predict the conservation of sequences among different species [14]. The MT-TQ sequences of 14 vertebrate species from GenBank were analyzed. Human nucleotide sequences were compared with those of other animals to calculate CI [15]. The CI represents conservation between species, which is the percentage of species with wild-type nucleotides at the corresponding location. CI ≥ 75% is considered functionally important [16]. We further used trRosettaRNA website (http://yanglab.qd.sdu.edu.cn/trRosettaRNA/) to predict the effect of mutation on the tertiary structure of tRNA [17].
Cells generation and culture
Platelets were isolated from the patient’s venous blood and fused with mtDNA-less ρ0 human osteosarcoma 143B cells, as described previously [18, 19]. Single cybrid clones were selected by culturing the fusion mixtures in a medium without uridine and sodium pyruvate. Mutant cells were selected by Sanger sequencing. In addition to the difference in heterogeneity, the clones have the same nDNA and mtDNA background, which can be used to explain the changes in cell function due to the presence of m.4344T>C. The cybrid cells were maintained in high-glucose Dulbecco’s modified Eagle’s medium (Gibco, USA), supplement with 10% cosmic calf serum (Gibco, USA), 1% (v/v) penicillin-streptomycin (Beyotime, China) and 0.25 μg/mL amphotericin B (Beyotime, China). The cybrid cells were cultured in an atmosphere of 5% CO2 at 37 °C.
Blue native PAGE (BN-PAGE)
BN-PAGE was conducted as described before [20]. The cells were lysed with 20% TritonX-100 (Sigma, USA) for 20 min, followed by centrifugation at 20,000 × g for 20 min. The supernatant was absorbed to determine the concentration, and 6× loading was added to prepare the required sample at 4 °C. Next, the samples were separated using a 3.5%-16% gradient polyacrylamide gel. Subsequently, the proteins were transferred to a 0.22 μm PVDF membrane (Bio-Rad, USA). The membrane was incubated with 5% non-fat milk at room temperature for 1–2 h, and then incubated with the primary antibody overnight at 4 °C. Finally, the membrane was incubated with the secondary antibody at room temperature for 2 h. Protein signals were detected using the Super Signal West Pico chemiluminescent substrate (Thermo, USA). The following are the antibodies used: anti-GRIM19 (1:1000, Abcam, USA), anti-SDHA (1:3000, Abcam), anti-UQCRC2 (1:2000, Abcam); anti-MTCO1 (1:2000, Abcam); anti-ATP5A (1:3000, Abcam).
Oxygen consumption rate
The oxygen consumption in intact cells was measured using the oxygraphy-2k detector (Oroboros, Austria) as described before [21]. In brief, about 4 × 10⁶ cells were collected during machine calibration and added to the machine after suspension in 200 μL 1 × TD buffer (25 mM Tris-Base, 137 mM NaCl, 10 mM KCl, 0.7 mM Na2HPO4, pH 7.4). After the basic respiratory value was stabilized, oligomycin (0.1 mg/mL, Sigma-Aldrich) was added to determine ATP-linked respiration. Finally, Cell numbers were used for calibration. To examine the activity of respiratory chain complexes, using 2% (w/v) digitonin to permeabilize cells [22]. The concentration was optimized to ensure mitochondrial viability prior to the experiment. Permeabilize good cells were collected and added to the machine after being rehung using 200 μL working buffer (20 mM HEPES, 250 mM Sucrose, 10 mM MgCl2, 1 mM ADP, 2 mM KH2PO4, pH 7.1). Add the appropriate substrate and inhibitor when breathing is stable. After the basic respiratory value was stabilized, Glutamate (1 M, Sigma-Aldrich) and malate (1 M, Sigma-Aldrich) was added to measure complex I respiration. Complex I was inhibited with rotenone (100 µM, Sigma-Aldrich) before glycerol-3-phosphate (10 mM, Sigma-Aldrich) was added to support complex III respiration. After add antimycin A (10 mM, Sigma-Aldrich) to inhibit complex III, use TMPD (4 mM, Sigma-Aldrich) and ascorbate (1 M, Sigma-Aldrich) to stimulate the complex IV. Complex IV was inhibited with NaN3 (4 M, Sigma-Aldrich). Finally, the number of cells was also used for calibration. Finally, we exported the O2 Flux per V [pmol/(s*ml)] data from chambers A and B of the O2K instrument, with a value recorded every 0.04 min. After reaching equilibrium, we calculated the average of 25 values within each 1-min interval and plotted a line chart based on these average values.
Mitochondrial ATP contents
Mitochondrial ATP contents were detected using ATP Determination Kit (Thermo, USA) according to the manufacturer’s instructions. Briefly, cells were seeded in 6-well plates to approximately 80% confluence. The cells were then incubated in the incubator for 2 h with a recording buffer (156 mM NaCl, 3 mM KCl, 2 mM MgSO4, 1.25 mM KH2PO4, 2 mM CaCl2, 20 mM HEPES, pH 7.35) containing 2-DG and sodium pyruvate. After incubation, the cells were collected and resuspended in ATP extraction solution (100 mM Tris-base, 4 mM EDTA-Na2, pH 7.75) and subjected to a 100 °C water bath for 90 s. The supernatant was mixed with the working solution and added to a 96-well white plate to detect self-luminescence at 560 nm. The final results were calibrated with protein concentration.
Mitochondrial ROS levels
Mitochondrial ROS levels were measured using MitoSOX red reagent (Thermo, USA) according to the manufacturer’s instructions. Briefly, when the cell density in the six-well plate reached 80%, the cells were collected and resuspended in a working solution containing 5 μM MitoSOX reagent. They were then incubated at 37 °C for 30 minutes in the dark and washed three times with PBS. Finally, the fluorescence with excitation at 510 nm and emission at 580 nm was analyzed using flow cytometry.
Mitochondrial membrane potential
Mitochondrial membrane potential (MMP) was measured using tetramethylrhodamine (Thermo, USA), following the manufacturer’s instructions. The stock solution of TMRM was diluted 1000 times with PBS, and then the working solution of 30 nM was configured with DMEM. When the cell density reached approximately 80%, the cells were collected and resuspended in a working solution. They were then incubated at 37 °C for 30 min in the dark and washed three times with PBS. Finally, the fluorescence with excitation at 488 nm and emission at 570 nm was analyzed using flow cytometry.
Mitochondrial tRNA levels
Dot-Blot was used to analysis mitochondrial tRNA level by using DIG Northern Starter Kit (Roche12039672910, Switzerland) [23, 24]. Total mitochondrial RNAs were obtained from mitochondria isolated from cybrid cell lines, 2 μL of the same amount of total mitochondrial RNAs were add to nylon membranes and dried at room temperature. The RNA spots were crosslinked to the nylon membranes using a UV Stratalinker with an energy of 1200 J/min. Subsequently, the membranes were hybridized with a specifically DIG-labeled probe. Following hybridization, membrane washing, sealing, incubation, color development, and exposure were conducted according to the kit protocol. After exposure, the probe on the membrane was stripped, and the next probe hybridization was carried out. The hybridization and quantification of density in each band were performed as detailed previously. DIG-labeled oligodeoxynucleotides specific for mitochondrial tRNAGln, tRNAIle, tRNAHis, and 5S rRNA were synthesized by Tsingke Biotechnology Company (Hangzhou, China) with the following sequences: 5’-AGGACTATGAGAATCGAACCCATCCCTGAG-3’ (tRNAGln), 5’-AGAAATAAGGGGGTTTAAGCTCCTATTATT-3’ (tRNAIle), 5’-AAATAAGGGGTCGTAAGCCTCTGTTGTCAG-3’ (tRNAHis) and 5’-CTAATTAATTATAAGGCCAGGACCAAACCT-3′ (5S rRNA).
Statistical analysis
All experiments had at least three independent replicates, and the data were shown as mean ± standard error of mean (SEM). P values were calculated using independent Student’s t test. The P < 0.05 was considered to have a significant difference.

留言 (0)