
記住我


Since 1975, the prevalence of obesity has more than tripled and reached epidemic proportions.1 By 2030, the prevalence is estimated to reach 20% of people worldwide, and the cost of obesity-related care represents over 20% of all health care expenses.2,3 Obesity is associated with a range of negative outcomes including increased comorbidities, reduced life expectancy, increased economic burden due to increased medical treatments, and productivity loss.4 In addition, people living with morbid obesity experience lower health-related quality of life (HRQL) than people who do not experience obesity.5,6
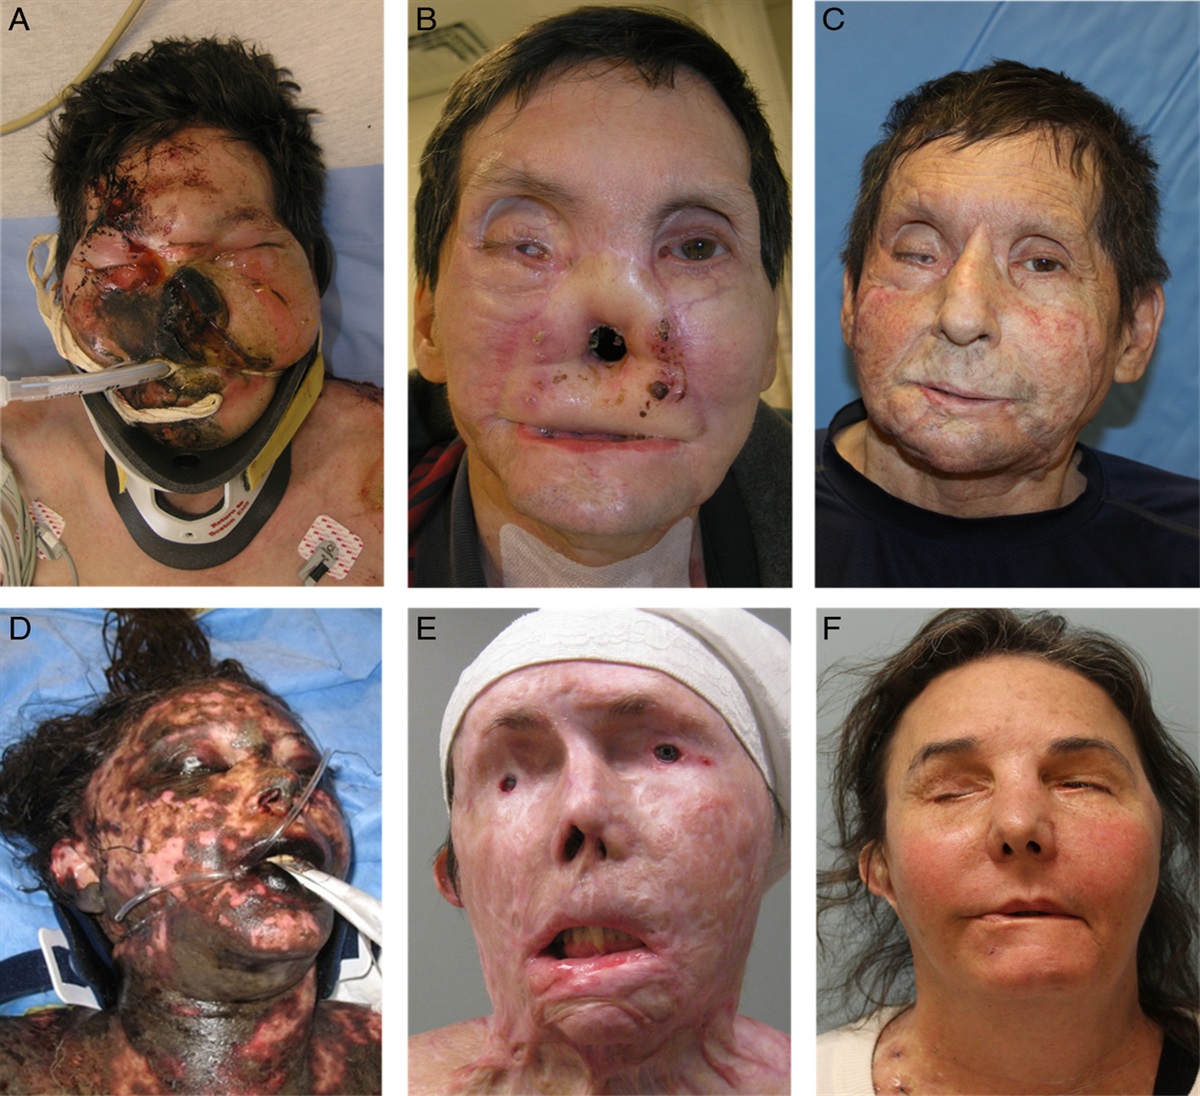
Bariatric surgery (BS) is the most effective weight loss treatment, resulting in sustained weight loss, remission of obesity-related medical problems, and improvement of HRQL in the short term.7 However, the massive weight loss (MWL) that can be achieved with BS leaves 70% to 90 percent of patients with varying degrees of excess skin, which may decrease HRQL and satisfaction with appearance in an otherwise successful weight loss trajectory.8,9 Excess skin is associated with infections, ulcerations, pain, impairments in physical activities, social isolation, and concerns regarding the patient’s body image.10 Therefore, MWL after BS has led to a new population of patients seeking body contouring surgery (BCS) in the United States and Europe.11,12Figure 1 shows the change in appearance after BCS. In the short term (<5 years of follow-up), BCS has been shown to positively impact HRQL.13–15 However, the long-term effects of BS with and without BCS on postoperative patient outcomes are unknown.15
 FIGURE 1:
 Clinical pictures from 2 patients before and after body contouring surgery. The figure shows 2 patients before (the 2 left pictures) and after body contouring surgery (the 2 right pictures).
HRQL and patients’ satisfaction with outcomes after surgery are best measured using patient-reported outcome measures (PROMs).16 Prior research has indicated that the BODY-Q emerged as the PROM, meeting the highest number of criteria for psychometric rigor, particularly suitable for patients undergoing BS and BCS.10,17 The BODY-Q has been increasingly used in cross-sectional and short-term prospective studies.13–15 However, the weight loss trajectory from pre-BS to post BCS has not been established longitudinally, nor has comparisons been made with the general population normative scores of the BODY-Q.18 This represents a current gap in the existing literature, as no previous studies have employed population norms for the BODY-Q as a reference point for comparison with the patient’s level of satisfaction with appearance and HRQL. Long-term studies evaluating patient-reported outcomes (PROs) of BS alone and BS followed by BCS are urgently needed to understand the impact of these treatments on patients’ HRQL and satisfaction with appearance. The PRO data could be employed to establish realistic patient expectations post BS and post BCS and for preoperative patient counseling, resulting in enhanced shared decision-making.19 This study aimed to explore the long-term changes in HRQL and appearance throughout the weight loss trajectory from pre-BS to post BCS in a large European sample of patients. In addition, we aimed to compare BODY-Q scores for patients with normative values in the general population.
METHODS Study DesignFigure 2 shows the data collection time points. This study was designed as a multicenter, international cohort study to assess HRQL and satisfaction with appearance through the weight loss trajectory from pre-BS to post BCS. Data were collected from patients aged 18 years or older. Patients who were unable to communicate in the language of data collection or with cognitive impairments were excluded. The study was registered at ClinicalTrials.gov (NCT05272215), and reported according to the STROBE Guidelines.20
 FIGURE 2:
 Data collection time points. (A) Prospective BODY-Q administration for patients undergoing bariatric surgery (BS), (B) prospective BODY-Q administration for patients undergoing body contouring (BCS), and (C) study design, using the BS date to compute a 10-year follow-up period since the BS date, representing 3 groups: BS without BCS (blue line), BS with BCS (black line), and the general normative population (orange line). Patient characteristics were captured throughout the follow-up period in Denmark and the Netherlands, and at baseline in Germany, Italy, Finland, and Poland.
Patient CharacteristicsThe following patient characteristics were collected: age, current weight, preoperative weight, height, marital status, education level, obesity-related comorbidities (ie, diabetes, hypertension, hyperlipidemia, obstructive sleep apnea, osteoarthritic disease, and cardiovascular/coagulation disease), BS type, BS date, previous BCS, area of BCS, and BCS dates. In Denmark and the Netherlands, patient characteristics were captured throughout the follow-up period, while only baseline characteristics were collected in the remaining countries.
Data Collection and BODY-Q Administration Bariatric SurgeryPatients seeking BS treatment from the following hospital units were invited to participate in the study: Denmark: Odense University Hospital, Odense, and Hospital of Southwest Jutland, Esbjerg. The Netherlands: OLVG West Hospital, Amsterdam, and St. Antonius Hospital, Nieuwegein. Participants from Denmark were recruited between June 2015 and November 2021, and participants from the Netherlands were recruited between February 2019 and November 2021. The BODY-Q was administered at the following time points: before BS and after BS (<6-, 6–12-, 24-, 36-, 48-, and 60 months postoperatively).
Body Contouring SurgeryPatients seeking BCS treatment from the following hospital units were invited to this study: Denmark: Odense University Hospital, Odense; Hospital of Southwest Jutland, Esbjerg; Herlev and Gentofte Hospital, Herlev; and Printzlau Private Hospital, Virum (from June 2015 to November 2021), the Netherlands: OLVG West Hospital, Amsterdam; Catharina Hospital, Eindhoven; and St. Antonius Hospital, Nieuwegein (from December 2017 to November 2021), Finland: Tampere University Hospital, Tampere (from February 2019 to November 2021), Germany: Johanniter-Krankenhaus und Waldkrankenhaus, Bonn (from June 2018 to May 2021), Italy: Universita Campus Bio-Medico Hospital, Rome (from February 2019 to November 2021), and Poland: Marciniak Specialized Hospital, Wroclaw (from February 2019 to November 2021). The BODY-Q was administered at 6 time points: before BCS and after BCS (<6-, 6–12-, 24-, 36-, 48 months postoperatively). In Germany, the BODY-Q was administered at 2 time points before BCS and 1 year after BCS.
Data AdministrationParticipants from Denmark received a direct link to complete the study survey in the Research Electronic Data Capture (REDCap) hosted by the Open Patient data Explorative Network (OPEN), University of Southern Denmark. The participants were contacted using a secure electronic mailbox. Patients who did not respond were sent up to 3 weekly reminders. The option to complete the survey at the point of care using an iPad was also provided. Participants from the Netherlands, Finland, Italy, and Poland were invited to participate via an e-mail invitation and were recruited via a URL link directly in Castor EDC (Amsterdam, the Netherlands). A weekly reminder was sent up to 2 times to nonresponders. In Germany, patients were invited to participate and complete the survey at the point of care. Data were entered manually into Microsoft Excel (2018).
Outcome MeasuresThe BODY-Q is a comprehensive PROM designed to measure HRQL, appearance, eating-related concerns, and experience of care in patients undergoing weight loss and/or BCS after MWL.21 It consists of 32 independently functioning scales that assess 4 key domains: appearance, HRQL, eating concerns, and experience of care. Supplemental 1, Supplemental Digital Content 1, https://links.lww.com/SLA/F21 presents the BODY-Q framework, illustrating how these scales align with the overarching domains. The variety of scales provides the flexibility to select the subset of scales most appropriate for measuring the desired outcomes in research or clinical settings.21–24
The BODY-Q was rigorously developed to measure changes over the entire weight loss trajectory. The psychometric validation of the BODY-Q, the translation, and linguistic validation in the used languages have been published elsewhere.22,23,25–28 In this study, the following BODY-Q HRQL (ie, body image, physical function, psychologic, sexual, and social) and appearance (ie, abdomen and body) scales were included. Each of the BODY-Q scales has between 4 and 10 items scored on a Likert scale from 1 (ie, very dissatisfied) to 4 (ie, very satisfied). The summed raw scores of all items in a scale were transformed using Rasch Conversion Tables for each scale to generate a score between 0 (worst) and 100 (best).
Normative BODY-Q ScoresGeneral population normative BODY-Q scores were established as a reference value for the general population BODY-Q scores using an international sample of 4051 participants from 12 countries in North America and Europe. The participants were recruited through the crowdsourcing platforms Prolific Academic and Amazon Mechanical Turk. The normative values presented as means of the total population, continent-specific, and country-specific,18 as well as the psychometric properties of the normative values and evidence to support the use of a common scoring algorithm, have been published elsewhere.29
Missing DataTo reduce the percentage of missing data in the questionnaires, e-mail reminders were sent to all patients. In Castor EDC, patients are required to complete all items on a scale, whereas the REDCap survey permitted missing values. If at least 50% of the scale’s items were completed, the mean of the completed item was used to score the scale in compliance with the BODY-Q User Guide.
Statistical AnalysisStatistical analyses were performed using Stata Version 17. Descriptive statistics including mean, SD, and 95% CI were computed for continuous variables, and percentages were computed for categorical variables. The BODY-Q was administered prospectively both preoperatively and at intervals up to 4 to 5 years postoperatively. To analyze the impact of BCS after BS, we used the date of the BS to compute “time elapsed after BS.” This approach established multiple time points for a 10-year follow-up period (see Table 1 for specific time points). Figure 2 provides an overview of these follow-up periods and the overall study design. To examine the longitudinal data with repeated measures over time and to evaluate the impact of relevant covariates, we employed a mixed-effects linear regression model. The covariates included were age, gender, Body Mass Index (BMI), comorbidities, educational level, marital status, and country of origin. This model simulates individual-specific changes in responses, handles missing data and time-varying covariates, and accounts for the correlation among repeated measures by including a random intercept for each patient.
TABLE 1 - Number of Assessments at Each Time Point After Bariatric Surgery Date Time Point Denmark (n) Netherlands (n) Finland (n) Germany (n) Italy (n) Poland (n) Pre-BS 1556 2209 — — — — 6 mo post BS 334 3806 — — — — 1 yr post BS 575 1404 — 192 6 — 2 yr post BS 929 2028 62 — 15 43 3 yr post BS 816 781 63 — 21 142 4 yr post BS 370 535 68 — 12 125 5 yr post BS 238 284 — 18 102 6 yr post BS 182 144 21 — — 25 7 yr post BS 145 117 9 — 9 14 8 yr post BS 108 60 14 — — — 9 yr post BS 95 61 6 — — 7 10 yr post BS 295 105 9 — 30 9n indicates number; Post BS, after bariatric surgery; Pre-BS, before bariatric surgery.
The sample consisted of 24,604 assessments from 5620 patients: 3451 patients from Denmark, 1426 from the Netherlands, 63 from Finland, 192 from Germany, 420 from Italy, and 68 from Poland. Figure 3 presents the number of assessments from each country, Table 1 presents the number of assessments at each time point after the BS date, Supplemental 2, Supplemental Digital Content 2, https://links.lww.com/SLA/F22 presents the participant characteristics, and Table 2 presents the mean BMI. The cohort consisted of 82.3% females and 17.7% males, with a mean age of 43 years and a baseline BMI of 45.2±7.5 kg/m2 before BS and 28.7±4.7 kg/m2 before BCS. Table 2 shows the mean BMI of the Danish and Dutch patients from baseline to 5 years postoperatively. Only baseline BMI data were available in Poland, Finland, Germany, and Italy. The mean follow-up was 37 months in total with a mean follow-up of 30.6 months in Denmark, 16.7 months in the Netherlands, 49.0 months in Finland, 12 months in Germany, 64.9 months in Italy, and 49.4 months in Poland.
 FIGURE 3:
 Flowchart of countries and number of assessments from each time point. The figure shows the total number of assessments and patients in the cohort as well as the respective number of assessments prospectively collected from each country.
TABLE 2 - Mean BMI (kg/m2) From Baseline to 5 Years Postoperatively Total DK The Netherlands BMI BS N Mean SD N Mean SD N Mean SD BMI BS Baseline 2075 45.17 7.49 1492 46.44 7.07 583 43.90 7.91 6 mo 966 33.69 5.47 547 33.95 6.36 419 33.43 4.57 1 yr 964 29.67 5.07 593 31.00 5.58 371 28.33 4.55 2 yr 879 29.53 5.52 511 30.94 6.28 368 28.11 4.75 3 yr 717 30.37 7.59 435 32.18 9.64 282 28.55 5.53 4 yr 466 31.33 7.93 253 33.29 10.32 213 29.37 5.54 5 yr 105 32.53 7.29 60 34.24 9.88 45 30.82 4.70 BMI BCS Baseline 3257 28.57 5.17 1782 27.54 3.68 1475 29.59 6.66 6 mo 1003 27.34 4.10 689 26.23 3.39 314 28.45 4.80 1 yr 811 27.61 4.44 405 26.81 4.09 406 28.40 4.78 2 yr 781 27.74 4.09 408 27.03 3.31 373 28.44 4.87 3 yr 518 27.58 4.26 389 26.99 2.99 129 28.16 5.53 4 yr 246 26.79 3.04 246 26.79 3.04 — — — 5 yr 75 26.95 3.42 75 26.95 3.42 — — —N indicates number of patients.
Time points: 6 mo=6 months postoperatively, 1 yr=1 year postoperatively, 2 yr=2 years postoperatively, 3 yr=3 years postoperatively, 4 yr=4 years postoperatively, 5 yr=5 years postoperatively.
Baseline BCS=all included countries. Country-specific baseline BMI for BCS, Italy: 25.6 (2.81) kg/m2, Germany: 32.6 (7.50) kg/m2, Poland: 27.6 (4.11) kg/m2, and Finland: 29.0 (3.72) kg/m2.
Figure 4 shows the change in HRQL and appearance scales across the 10-year follow-up of patients who only underwent BS compared to patients who underwent BCS post BS. Table 3 shows the impact of BCS on BS scores. Initial improvements were seen in all scales post BS, with psychologic, physical, social, body image, and body scales peaking at 12 months, whereas sexual and abdomen scores peaked at 3 months. A decline in all the BODY-Q scores was noted in patients with BS only with no rebound, notably with the 10-year sexual score dropping below preoperative levels. Participants treated with BCS after BS demonstrated significantly higher scores (P<0.001) at 2 years post BCS, sustaining or improving scores over the follow-up period in all scales, with a minor decline observed in psychologic, social, body image, abdomen, and body scales 8 to 10 years post BCS. However, a statistically significant improvement was observed. The largest improvement was found in the abdomen scale after 3 years, showing a 48.2-point difference between BS only and subsequent BCS (P<0.001).
 FIGURE 4:
 Change in BODY-Q scores over the weight loss trajectory. Change in health-related quality of life and appearance over the course of 10 years for each scale and the normative values (orange line). The figure shows the Rasch-converted BODY-Q scores (y axis) and time since BS (x axis) for all included patients. The blue line shows the scores of patients who only had BS (±SD), and the red line shows the scores of patients who had BS and subsequent BCS (±SD)*. *The following covariates were included in the mixed-effects linear regression model: age, gender, BMI, comorbidities, educational level, marital status, and country of origin.
TABLE 3 - The Impact of Body Contouring Surgery on Bariatric Surgery BODY-Q Psychologic Social Sexual Physical BS vs BCS n Coef. 95% CI P n Coef. 95% CI P n Coef. 95% CI P n Coef. 95% CI P Baseline 2038 0 — — 2030 0 — — 1984 0 — — 2034 0 — — Time point 6 M 1064 −13.4 −31.5; 4.72 NS 1054 −2.48 −19.7; 14.8 NS 865 −4.80 −26.3; 16.7 NS 1073 −3.21 −21.6; 15.2 NS Time point 1 Y 882 −6.74 −32.9; 19.5 NS 873 −1.41 −25.4; 22.6 NS 757 12.3 −18.2; 42.8 NS 889 13.7 −13.7; 41.2 NS Time point 2 Y 1157 6.78 2.05; 11.5 0.005 1155 6.41 2.16; 10.7 0.003 1068 10.5 4.93; 16.1 <0.001 1156 4.01 −1.06; 9.08 NS Time point 3 Y 947 10.3 7.92; 12.7 <0.001 941 7.89 5.72; 10.0 <0.001 941 18.4 15.7; 21.2 <0.001 949 8.48 5.90; 11.0 <0.001 Time point 4 Y 451 9.76 6.63; 12.9 <0.001 449 7.65 4.84; 10.5 <0.001 446 19.6 16.0; 23.3 <0.001 450 11.4 8.07; 14.8 <0.001 Time point 5 Y 290 12.1 8.12; 16.1 <0.001 287 8.74 5.15; 12.3 <0.001 285 20.7 16.1; 25.3 <0.001 286 8.58 4.33; 12.8 <0.001 Time point 6 Y 162 13.1 7.71; 18.4 <0.001 162 7.94 3.08; 12.8 0.001 160 16.7 10.4; 22.9 <0.001 160 12.0 6.20; 17.8 <0.001 Time point 7 Y 152 11.1 5.51; 16.6 <0.001 151 3.52 −1.54; 8.58 NS 151 18.9 12.5; 25.4 <0.001 152 8.16 2.26; 14.1 0.007 Time point 8 Y 93 16.3 8.87; 23.7 <0.001 93 10.5 3.73; 17.2 0.002 92 19.5 10.8; 28.2 <0.001 91 7.71 −0.27; 15.7 NS Time point 9 Y 85 6.74 −1.00; 14.5 <0.001 84 8.74 1.69; 15.8 0.02 82 20.6 11.5; 29.8 <0.001 83 5.03 −3.22; 13.3 NS Time point 10 Y 244 12.5 8.16; 16.9 <0.001 244
留言 (0)