
記住我


Breast cancer is the most common cancer and the leading cause of tumor-related mortality in female patients worldwide (1). Though about 98.6% of breast cancer patients could survive for 5 years after the diagnosis, this rate would decrease to 84.4% in the presence of axillary lymph node metastasis (ALNM) (2, 3). Axillary lymph node (ALN) status is an independent prognostic indicator for disease-free survival and overall survival in early-stage patients with breast cancer (4). The correct preoperative staging of ALN status is of important clinical significance for the optimization of clinical decision.
Currently, axillary lymph node dissection (ALND) is the widely recognized method for identifying metastatic ALNs, which is invasive and associated with a series of complications including lymphedema, nerve injury, abnormal function (5, 6). To minimize unnecessary body damage, the sentinel lymph node biopsy (SLNB) has become the preferred approach for evaluating ALN status. However, SLNB is also accompanied with a series of side effects such as infection, allergies to tracer agents, skin staining, longer surgical times and higher surgical trauma (7–9).
Conventional ultrasound imaging (CUS) is a commonly recommended method for preoperative assessment of the ALN status, owing to its convenience, radiation-free and non-invasive advantages. However, the value of CUS in identifying ALNM is limited, with a sensitivity ranging from 48% to 87% and a specificity ranging from 55% to 97% (10). For the ALN involved with micro-metastasis, it will become imperceptible on CUS images. To tackle this issue, recent studies have attempted to exploit the ultrasonic features of primary breast lesions to predict ALNM (11–13). These ultrasonic features encompassed both the morphological information derived from CUS and the functional information derived from CEUS (11–13). However, the predictive performances based on these features are not excellent. The development of more effective assessment methods for noninvasive prediction of ALNM is imperative.
Radiomics is a widely applied technique for extracting high-throughput features from medical images. A great amount of high-dimensional features including shape, intensity and texture information that were unable to observe with the naked eye can be obtained and objectively analyzed using radiomics method (14, 15). Based on CUS images of primary breast tumor, ultrasound radiomics has been applied to establish prediction model for ALN status in several studies (16–18).
However, there is currently no study reporting the utility of radiomics features derived from CEUS in predicting ALN status in patients diagnosed with breast cancer. On the basis of routine CUS screening among breast cancer patients, it is convenient to perform CEUS and obtain the perfusion information regarding the primary breast lesions. In this study, we aimed to investigate whether quantitative radiomics features derived from both CUS and CEUS could help improve the predictive performance of ALNM.
2 Materials and methodsThis was a single-center prospective study approved by the ethics committee of the cancer hospital of the Chinese Academy of Medical Sciences. The enrolled patients had given their informed consent to participate this study.
2.1 Patient selection and sample size estimationFrom March 2019 to January 2022, a total of 111 breast lesions from 111 female patients were enrolled in this study based on the following inclusion criteria: (1) patients who were aged ≥ 18 and diagnosed with breast malignant cancers by postoperative pathology results. (2) with the presence of measurable lesions (≥1) proven by conventional ultrasound (CUS) and contrast enhanced ultrasound (CEUS) performed before any interventional treatment, including core needle biopsy, neoadjuvant chemotherapy, or surgery. (3) with complete baseline CUS images of breast lesions and ipsilateral axillary lymph node (ALN) assessment based on CUS features. (4) with complete baseline CEUS videos of breast lesions. (5) with clearly verified ALN status by pathology after sentinel lymph node biopsy (SLNB) or axillary lymph node dissection (ALND). The exclusion criteria were as follows: (1) currently has or had a history of malignant tumors besides breast cancer. (2) allergic to ultrasound contrast agents or other contraindication for ultrasound contrast agent application. The enrolled patients were assigned numbers and subjected to stratified random sampling based on the pathological status of ALNs in order to create a training set and an external validation set at a ratio of 7:3 (Figure 1).
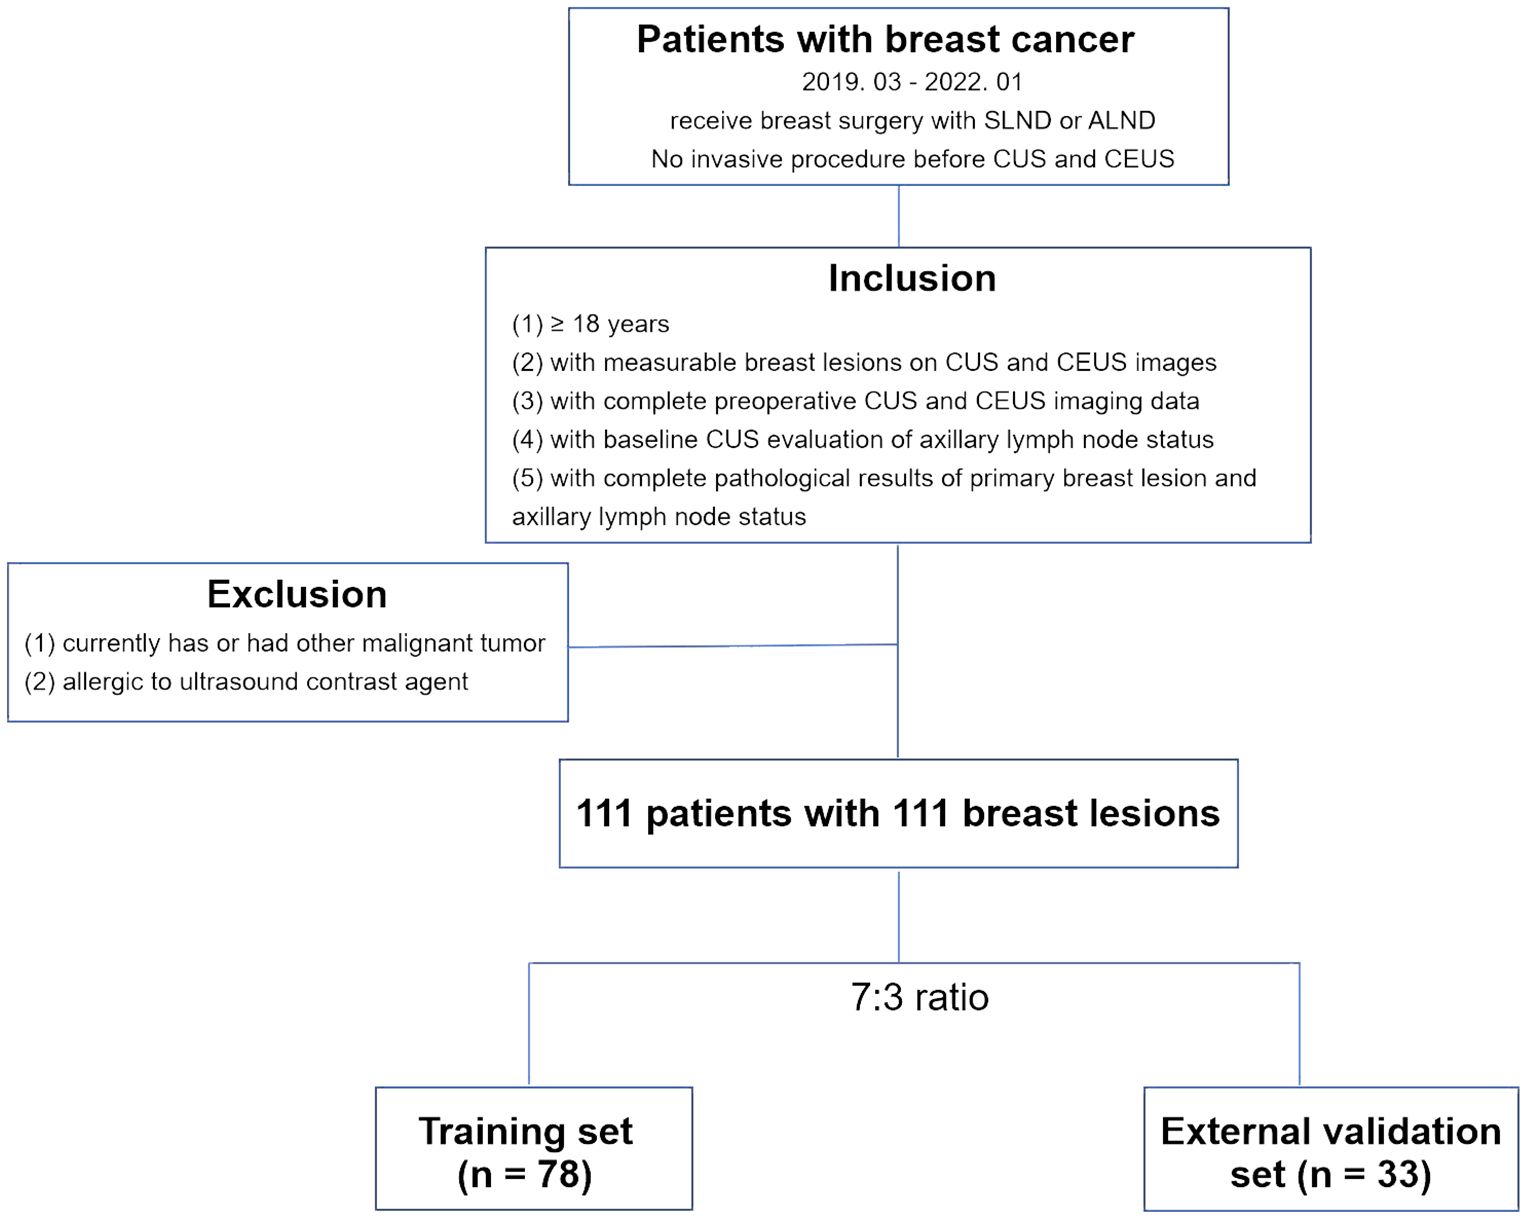
Figure 1 Flowchart for the patient selection criteria. CUS, conventional ultrasound; CEUS, contrast-enhanced ultrasound. SLNB, sentinel lymph node biopsy; ALND, axillary lymph node dissection.
The sample size estimation was based on the reported axillary lymph node metastasis (ALNM) incidence in breast cancer patients and the principle of 10 outcome events per variable (19–21). Using an estimated ALNM incidence of 0.45 in the study population and for three predictors, we aimed to enroll 67 breast cancer patients but actually enrolled 70 in the training set.
2.2 Clinical and pathological information collectionThe clinical and pathological characteristics of the enrolled patients, including age, breast tumor size (measured by CUS), breast tumor histological type, pathological ALN status, breast tumor receptor (estrogen receptor, ER; progesterone receptor, PR; human epidermal growth factor receptor, Her-2) status, were collected from the medical records system. All the breast lesions were surgically removed, following by ALND. The breast tumor histology and pathological ALN status were documented according to the postoperative pathological results.
2.3 CUS examination procedure and CUS-reported ALN statusThe CUS was performed by two senior sonographers (5 years’ experience in CUS diagnosis of breast tumor) using Philips EPIQ5 ultrasonic diagnostic equipment (Philips, Bothell, WA) with high frequency linear array probes to choose the target breast lesion and best sonographic sections for the observation. The whole breast underwent CUS screening and the identified breast lesions were graded based on the second edition of the American College of Radiology Breast Imaging Reporting and Data System for US (22). The breast lesion with BI-RADS grade 4C or BI-RADS grade 5 was considered as suspiciously malignant. The lesion size was measured on CUS images. If multiple breast lesions were suspiciously malignant in a patient, the biggest one was selected as the target lesion. The maximum transverse and longitudinal sections of each target lesion were respectively captured and stored, eventually obtaining two CUS images per target lesion. The ALN status was also evaluated by CUS. An ALN was defined as CUS-reported positive ALN when it presented one of the following features: irregular cortical thickness of greater than 3 mm, longest-to-shortest axis ratio less than 2, or absence of a fatty hilum (23). CUS images of target lesions and ALNs were initially stored in a Digital Imaging and Communications in Medicine (DICOM) format and subsequently converted to a Joint Photographic Experts Group (JPEG) format for further analysis.
2.4 CEUS examination procedureThe CEUS was also performed by two senior sonographers (5 years’ experience in CEUS diagnosis) using the same ultrasonic diagnostic equipment mentioned in CUS examination. First, the lyophilized powder of contrast agent (Sono Vue, Bracco SpA, Milan, Italy) was reconstituted by adding 5 mL of 0.9% saline and shaking to form a homogeneous microbubble suspension. Second, the real-time imaging of double-frame CEUS mode was activated after the proper ultrasonic section of the target lesion was displayed by CUS. Then, a bolus of 4.8-mL suspension of the contrast agent was administered via antecubital vein. The continuous storage of CEUS imaging and chronograph were initiated immediately following the injection of the contrast agent, lasting for a duration of 3 minutes. The CEUS imaging data was initially stored as a dynamic video with a DICOM format and subsequently converted to an Audio Video Interleaved (AVI) format for further analysis.
2.5 Region of interest segmentationNext, two CUS images (JPEG format) and one CEUS video (AVI format) of each target lesion was used for region of interest (ROI) segmentation. For CUS images, the ROI was delineated around the boundary of the target lesion. If the hyperechoic halo was present in CUS images, the boundary was positioned outside hyperechoic halo. For CEUS videos, a series of continuous frames of the CEUS video formed the CEUS images for target lesion. A rectangular box was outlined in the frame that can clearly displayed the tumor area and a computer vision algorithm was subsequently used to track and draw the ROI sketches ac nross the other frames in the video (24). The example of target lesion delineation based on CUS images and CEUS video frames were listed in Figure 2.
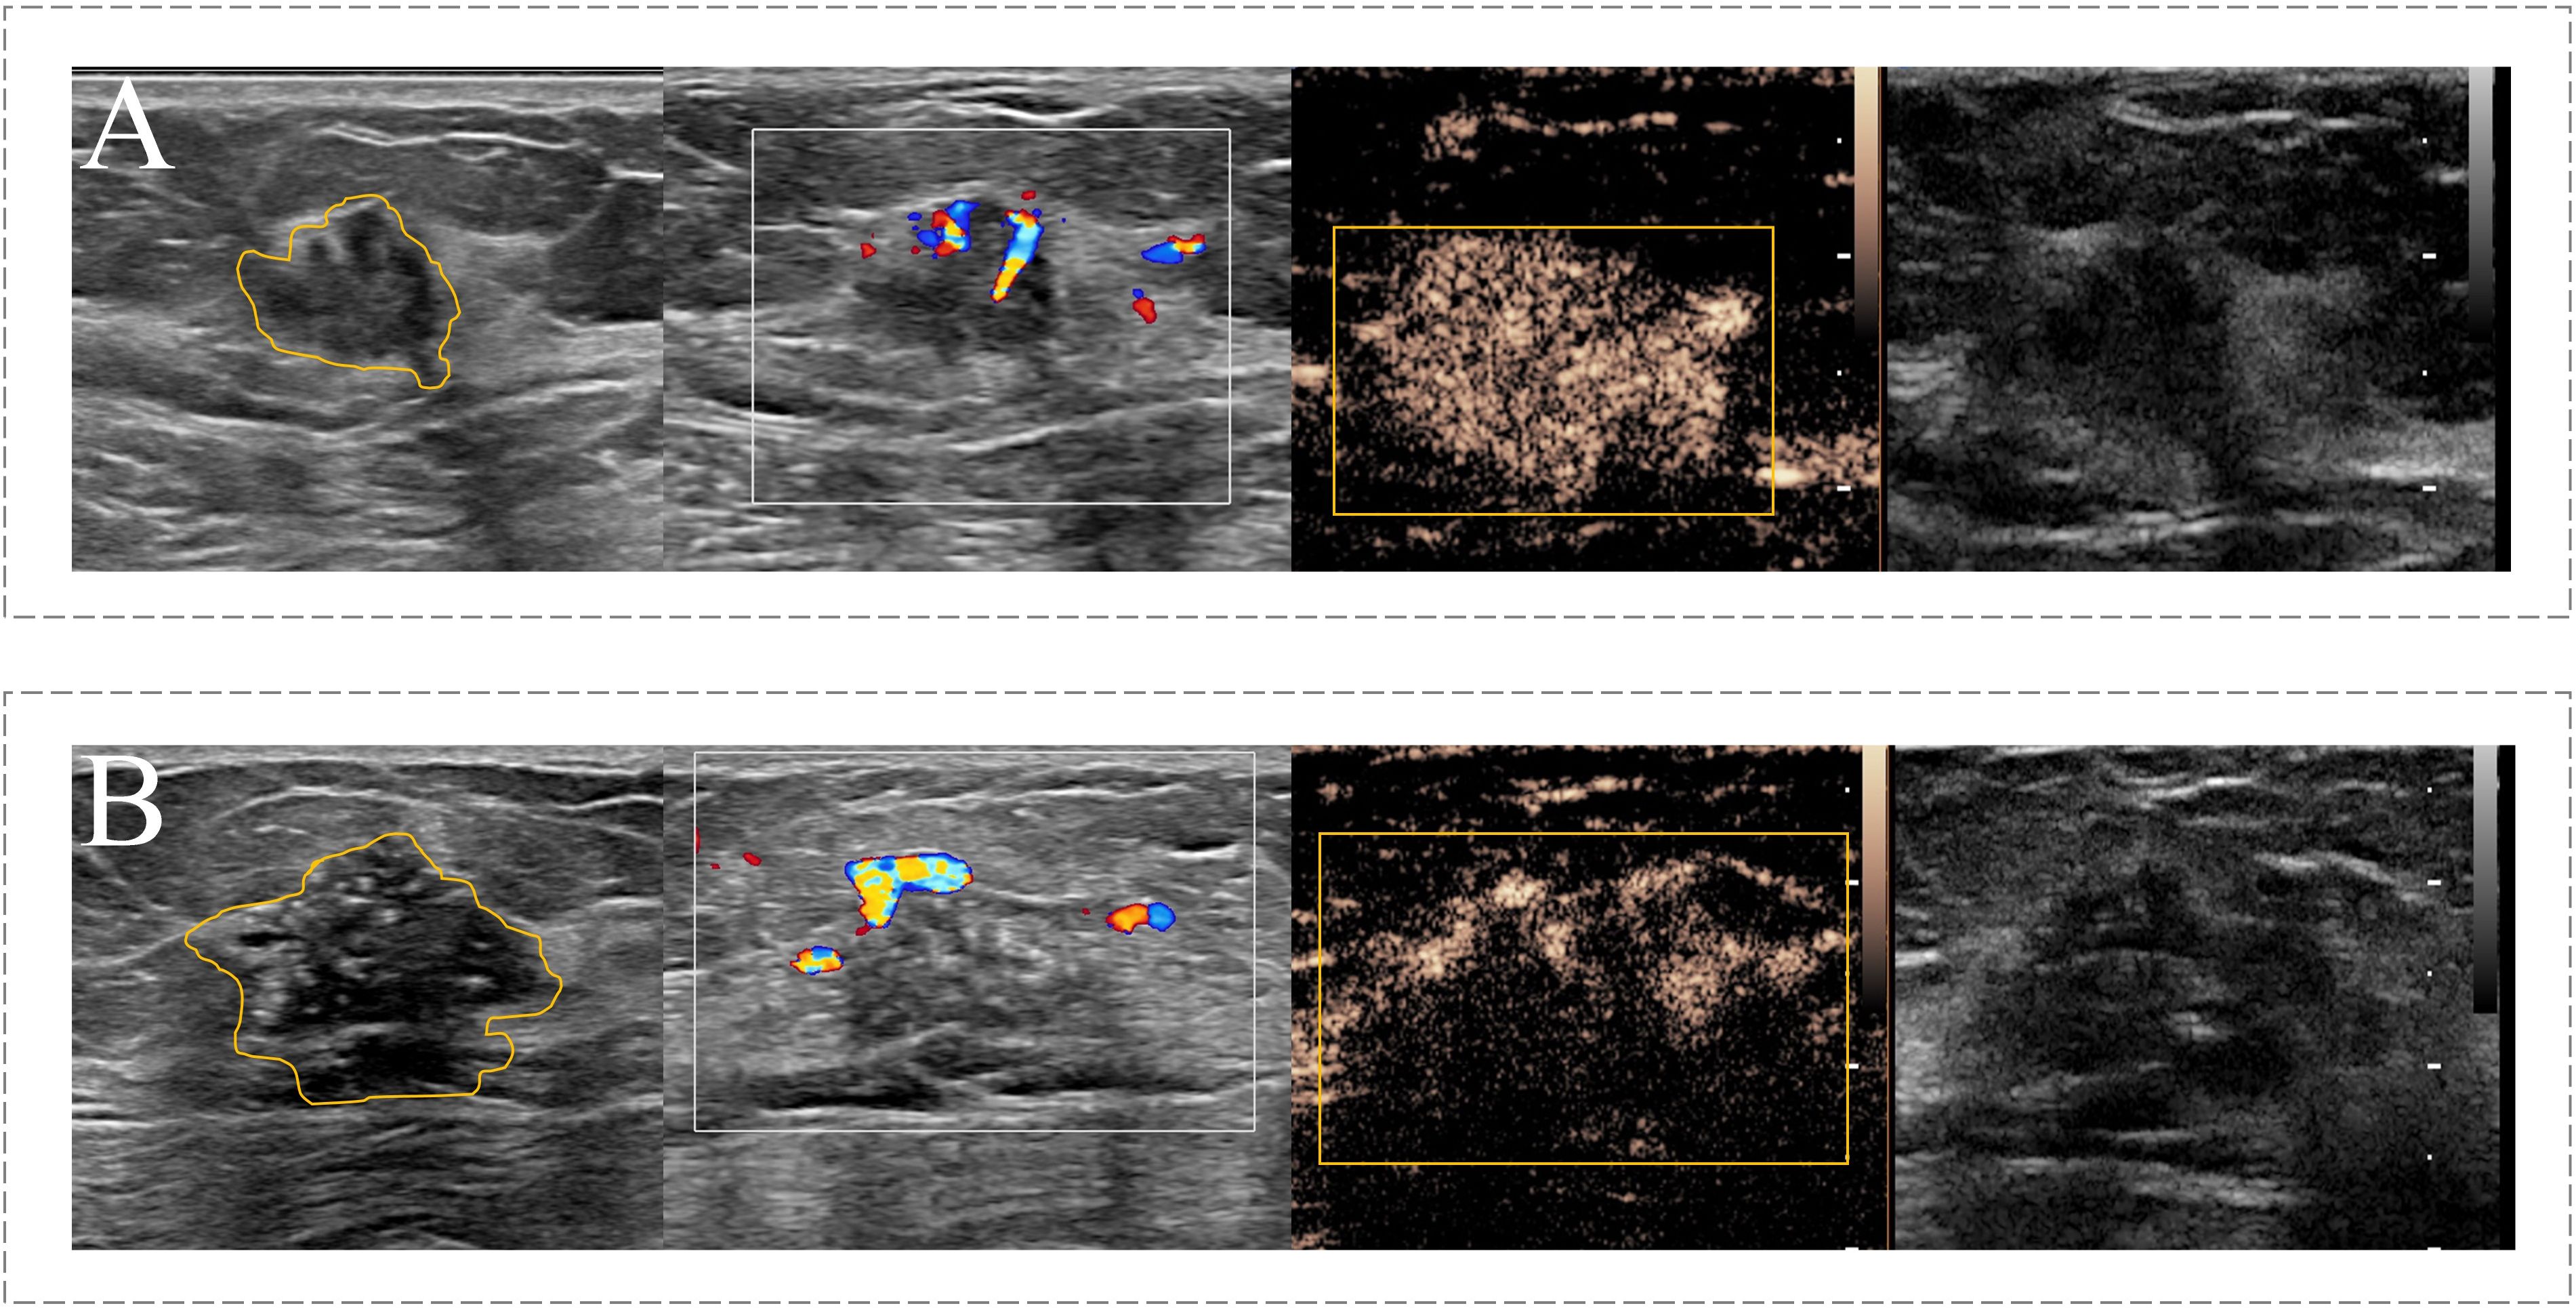
Figure 2 Example of the ROI segmentation in CUS image and CEUS videos. (A) The ROI segmentation on the CUS image (Left) and CEUS frame (Right) of malignant breast lesion with ALNM. (B) The ROI segmentation on the CUS image (Left) and CEUS frame (Right) of malignant breast lesion without ALNM.
2.6 Feature extraction, selection and radiomics score calculationThe radiomics features were extracted from the ROI delineated based on CUS and CEUS images, respectively. An open-source pyradiomics package (http://github.com/Radiomics/pyradiomics) was used to extract shape features, first-order statistical features, and texture features from both the original images and transformed images, respectively. The transformed images were generated by performing 2D discrete wavelet decomposition and reconstruction, or filtering by the Laplacian of Gaussian method with different sigma parameters. Specifically, the shape features extracted from CEUS images were excluded due to the limitations of using a rectangular box delineation, which could not accurately capture the shape information of target lesion.
Next, the max-relevance and min-redundancy (MRMR) and least absolute shrinkage and selection operator (LASSO) analyses were used to respectively select the most effective CUS and CEUS feature subsets for the prediction of ALNM in the training set. Finally, two sets of radiomics scores based on CUS or CEUS images were respectively constructed with corresponding selected features.
2.7 Development and validation of nomogramBefore prediction model construction, the multicollinearity was analyzed by assessing the variance inflation factor (VIF) among involved variables. Multicollinearity was considered to exist when a VIF value was above 3. The clinical characteristic with P <0.05 in the univariate analysis was incorporating with radiomics scores based on CUS and CEUS images to construct a nomogram as a quantitative tool to predict ALNM using multivariable logistic regression analysis. The discriminatory ability of the model was evaluated using receiver operating characteristic (ROC) curve analysis and the area under curve (AUC) in the training data and validation date. The Delong algorithm was used to compare AUC of different models (P < 0.05). The predictive accuracy of the model was evaluated by calibration curve. A decision curve analysis was performed to determine the clinical usefulness.
2.8 Statistical analysisR software (ver.1.4.1717, R Development Core Team) and SPSS 22.0 software (IBM Corporation, NY, USA) were used for statistical analysis. The χ2 test or Fisher’s exact test were used for the comparison of classification variables, whereas the independent-sample t test was used for the comparison of continuous variables. A P value<0.05 was considered statistically significant. SPSS was used for binary logistic regression analysis and a series of packages in R software were used to develop the predictive model and test the diagnostic performance of the model. The corresponding packages included the rsample, mRMRe, glmnet, caret, corrplot, survival, ggplot2, rms, pROC, tidyverse, rmda and ggDCA packages.
3 Results3.1 Baseline characteristics of training set and external validation setA total of 111 patients with 111 breast malignant lesions were enrolled in this study from March 2019 to January 2022. Table 1 summarizes the baseline clinical characteristics of 78 patients in the training set and 33 patients in the validation set. These baseline characteristics included the age of each enrolled patient, size, histology type and receptor status of each breast tumor, as well as the pathological status of ALNM. A total of 27 (34.6%) patients with ALNM were included in the training set and 12 (36.4%) patients with ALNM were included in the external validation set. Both sets had comparable ALN prevalence rate (p = 0.86). Additionally, there are no significant differences in the other baseline characteristics between two sets.
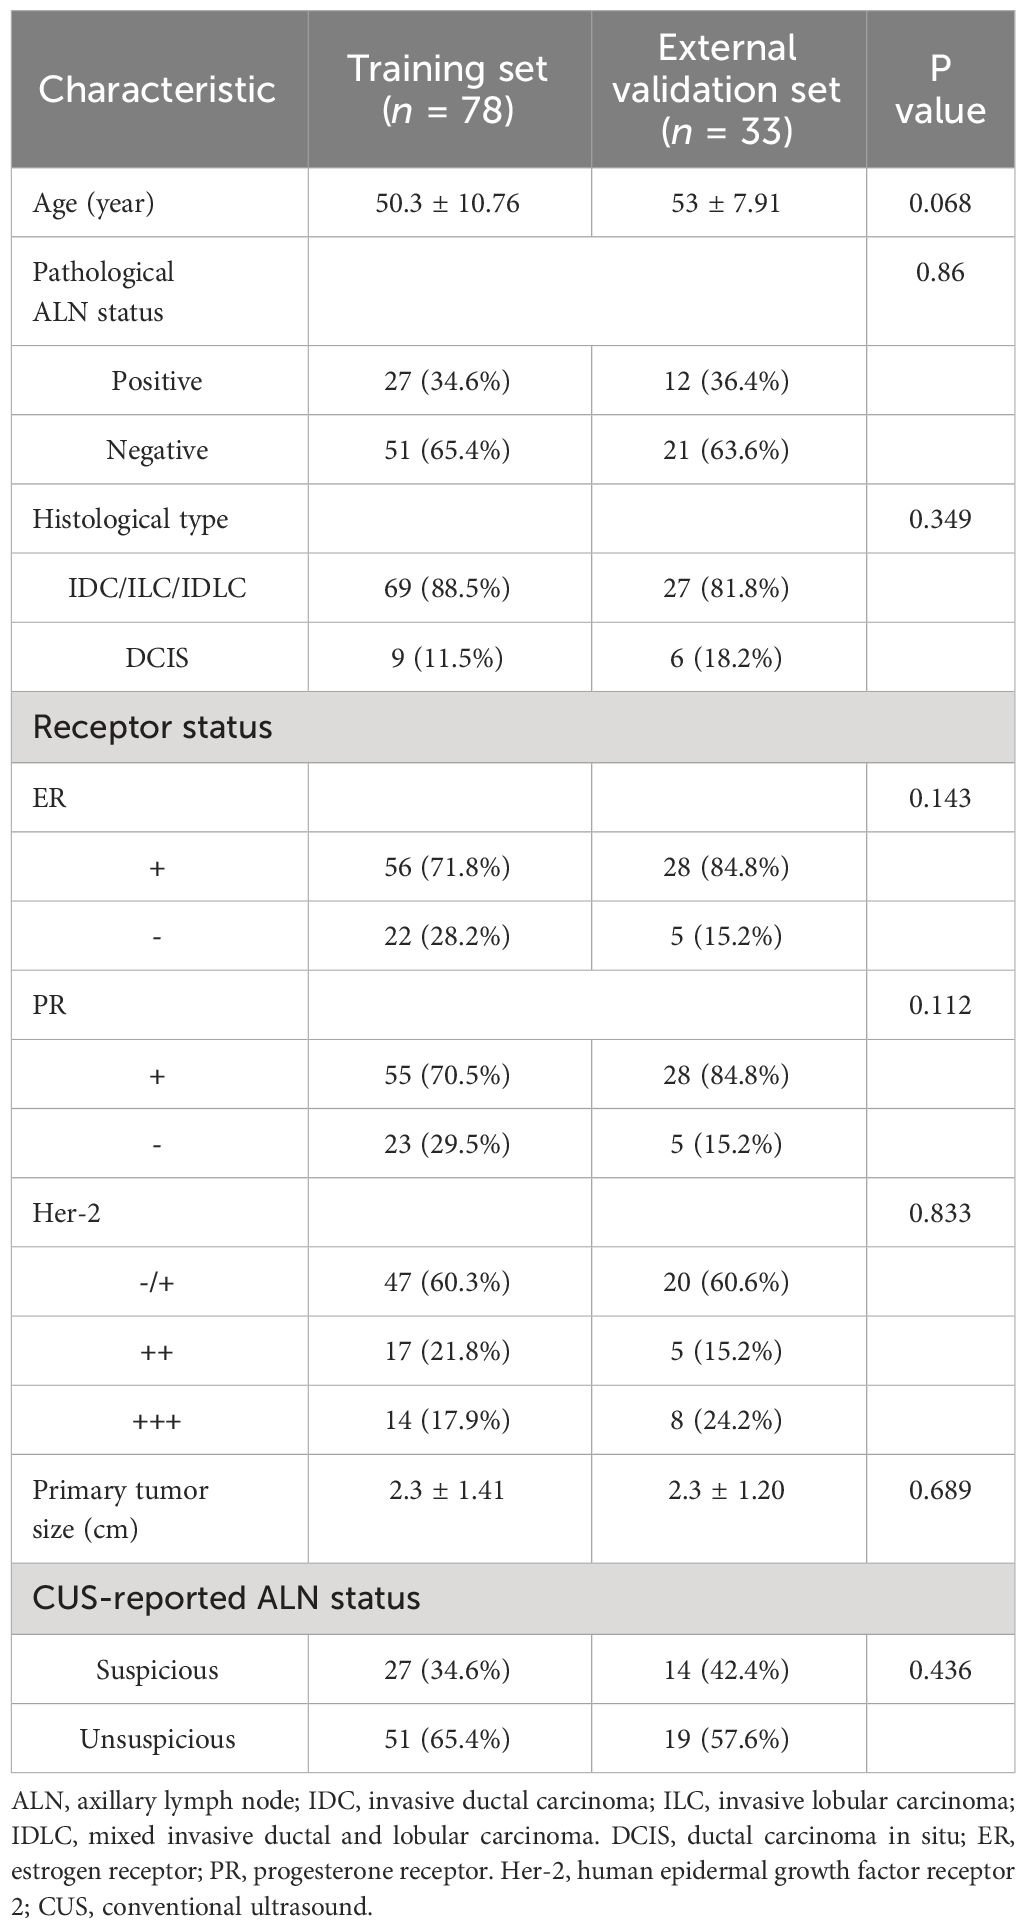
Table 1 Baseline characteristics of patients in training set and external validation set.
3.2 Radiomics features selection and radiomics score calculationA total of 1530 radiomics features (CUS-rad-features) were extracted from CUS images, while 1395 radiomics features (CEUS-rad-features) were extracted from CEUS images. Next, top 30 features were respectively selected from these CUS-rad-features and CEUS-rad-features using MRMR algorithm. Finally, two CUS-rad-features and two CEUS-rad-features with non-zero coefficients were respectively identified by LASSO regression model (Table 2, Figure 3). The radiomics scores based on CUS images and CEUS images were respectively calculated using the final selected features to generate CUS-radscore and CEUS-radscore for model construction.

Table 2 List of the selected radiomics features extracted from CUS and CEUS images via LASSO analyses.
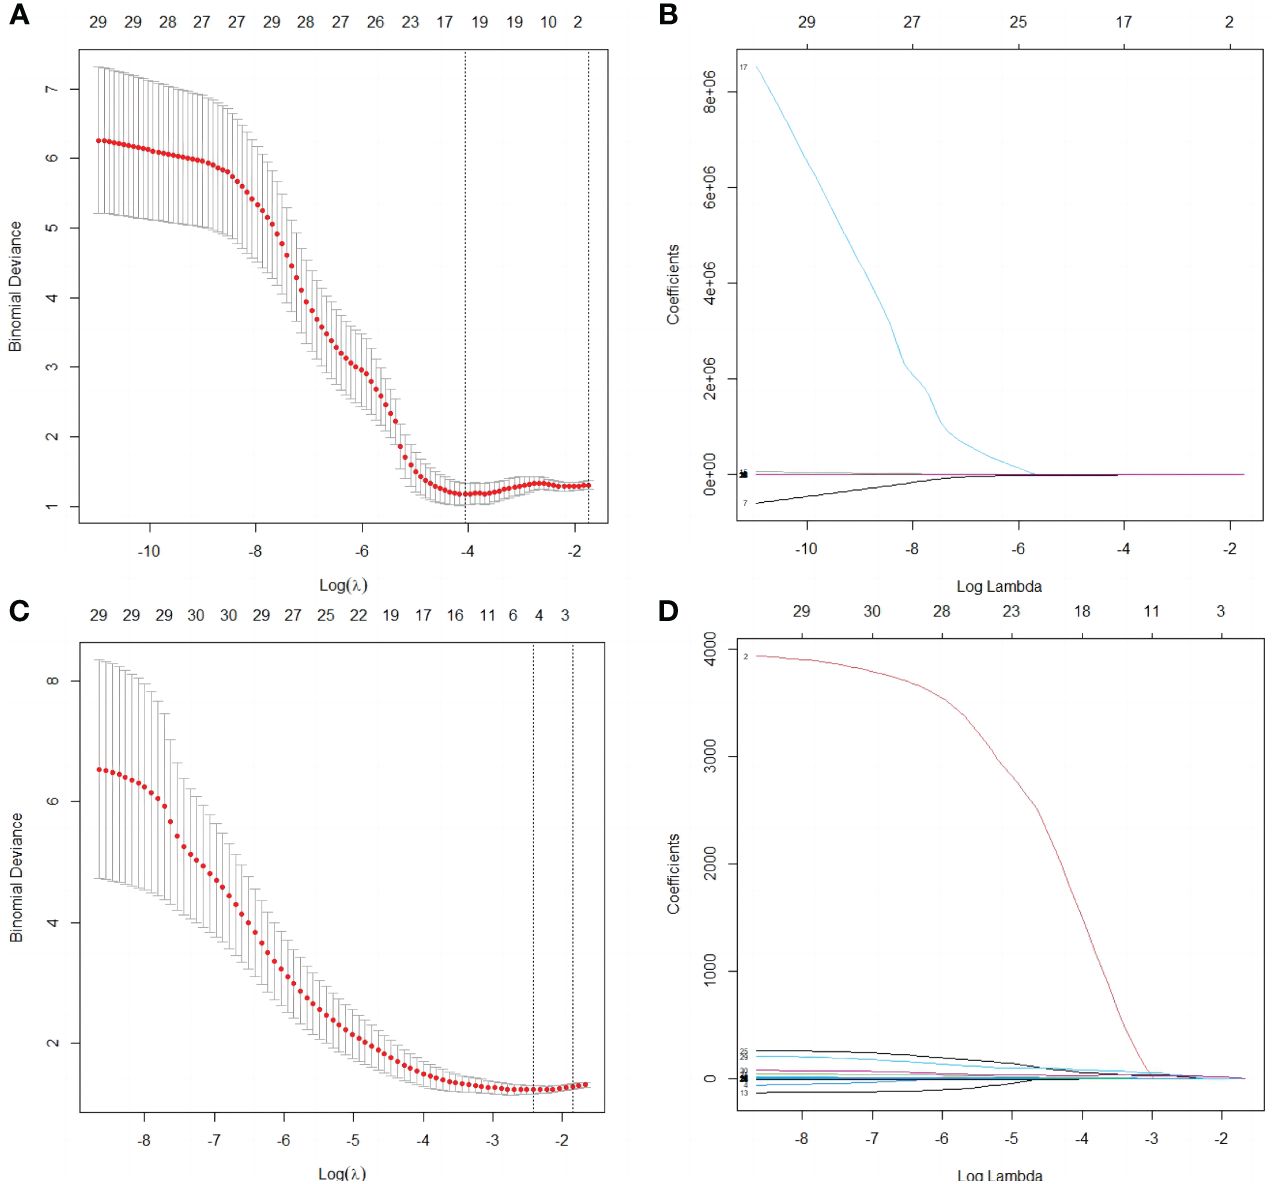
Figure 3 Selection of radiomics features by the LASSO analyses. (A) Selection of the tuning parameter λ in the LASSO analysis among candidate CUS radiomics features via 10- fold cross-validation based on the 1 standard error of the minimum criteria (1 – SE criteria). The value of λ that derived the minimum average binomial deviance was used to select features. Dotted vertical lines were drawn at the values using the minimum criteria and the 1 – SE criteria. (B) LASSO coefficient profiles of the 30 candidate CUS radiomics features. (C) Selection of the tuning parameter λ in the LASSO analysis among candidate CEUS radiomics features via 10- fold cross-validation based on the 1 standard error of the minimum criteria (1 – SE criteria). The value of λ that derived the minimum average binomial deviance was used to select features. Dotted vertical lines were drawn at the values using the minimum criteria and the 1 – SE criteria. (D) LASSO coefficient profiles of the 30 candidate CEUS radiomics features.
3.3 Development and validation of the nomogramThe baseline characteristics that were accessible prior to the surgical operation included age, primary tumor size and CUS-reported ALN status. The multivariate analyses further showed that CUS-reported ALN status was statistically related to ALNM (Table 3). Thus, a total of three predictors including CUS-reported ALN status, CUS-radscore and CEUS-radscore were obtained. The VIFs of these three predictors ranged from 1.269 to 1.439, indicating no multicollinearity existed among them. Next, three prediction models were respectively established by incorporating different amounts of predictors using logistic regression analysis (Model 1: CUS-reported ALN status; Model 2: CUS-reported ALN status + CUS-radscore); Model 3: CUS-reported ALN status + CUS-radscore + CEUS-radscore). The AUC values of three models in both training and external validation set were summarized (Table 4). Model 3 showed better performance than model 2 or model 1 in both the training set (AUC: 0.845 vs. 0.826 or 0.773, P = 0.4581 and P < 0.01) and external validation set (AUC: 0.901 vs. 0.889 or 0.821, P = 0.738 and P = 0.0283). Additionally, a better performance was also observed by adding CUS-radscore on the basis of CUS-reported ALN status in the training set (AUC: 0.826 vs. 0.773, P < 0.001) and the external validation set (AUC: 0.889 vs. 0.821, P = 0.013).Therefore, a nomogram was constructed using model 3 (Figure 4). The ROC curves of both the training and external validation set all showed excellent results (Figure 5). By incorporating three predictors, model 3 yielded an AUC value of 0.845 [95% confidence interval (CI), 0.739-0.950] with a sensitivity of 0.74.1% and a specificity of 92.2% in the training set, and an AUC of 0.901 (95% CI, 0.758-1) with a sensitivity of 91.7% and a specificity of 85.7% in external validation set.
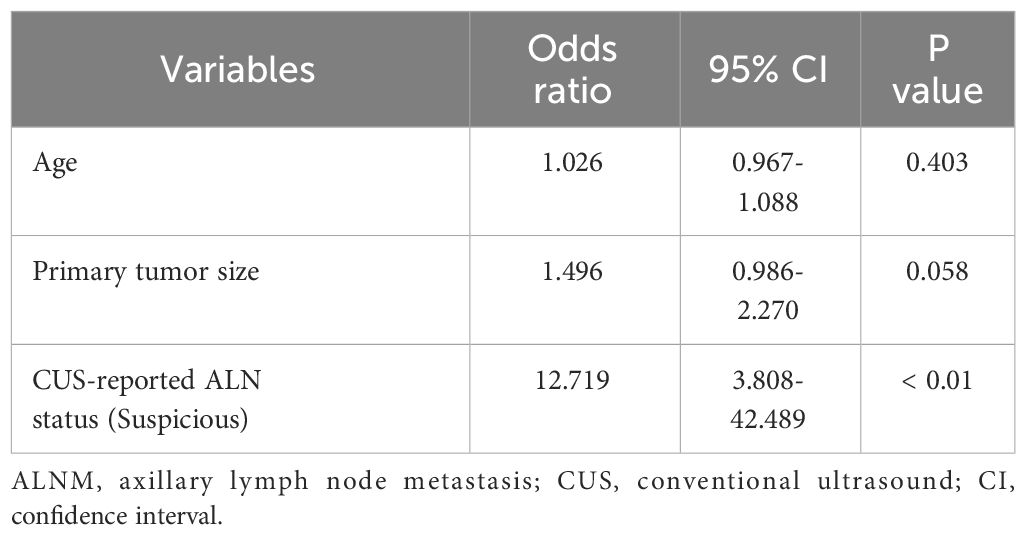
Table 3 The multivariate logistic analysis to identify independent predictor for ALNM among baseline characteristics in the training set.
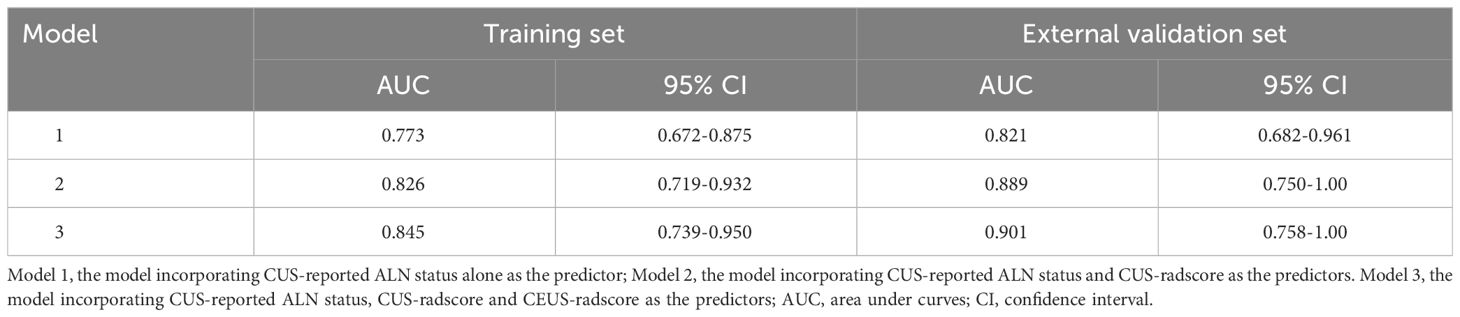
Table 4 Performance of different models in training and external validation set.
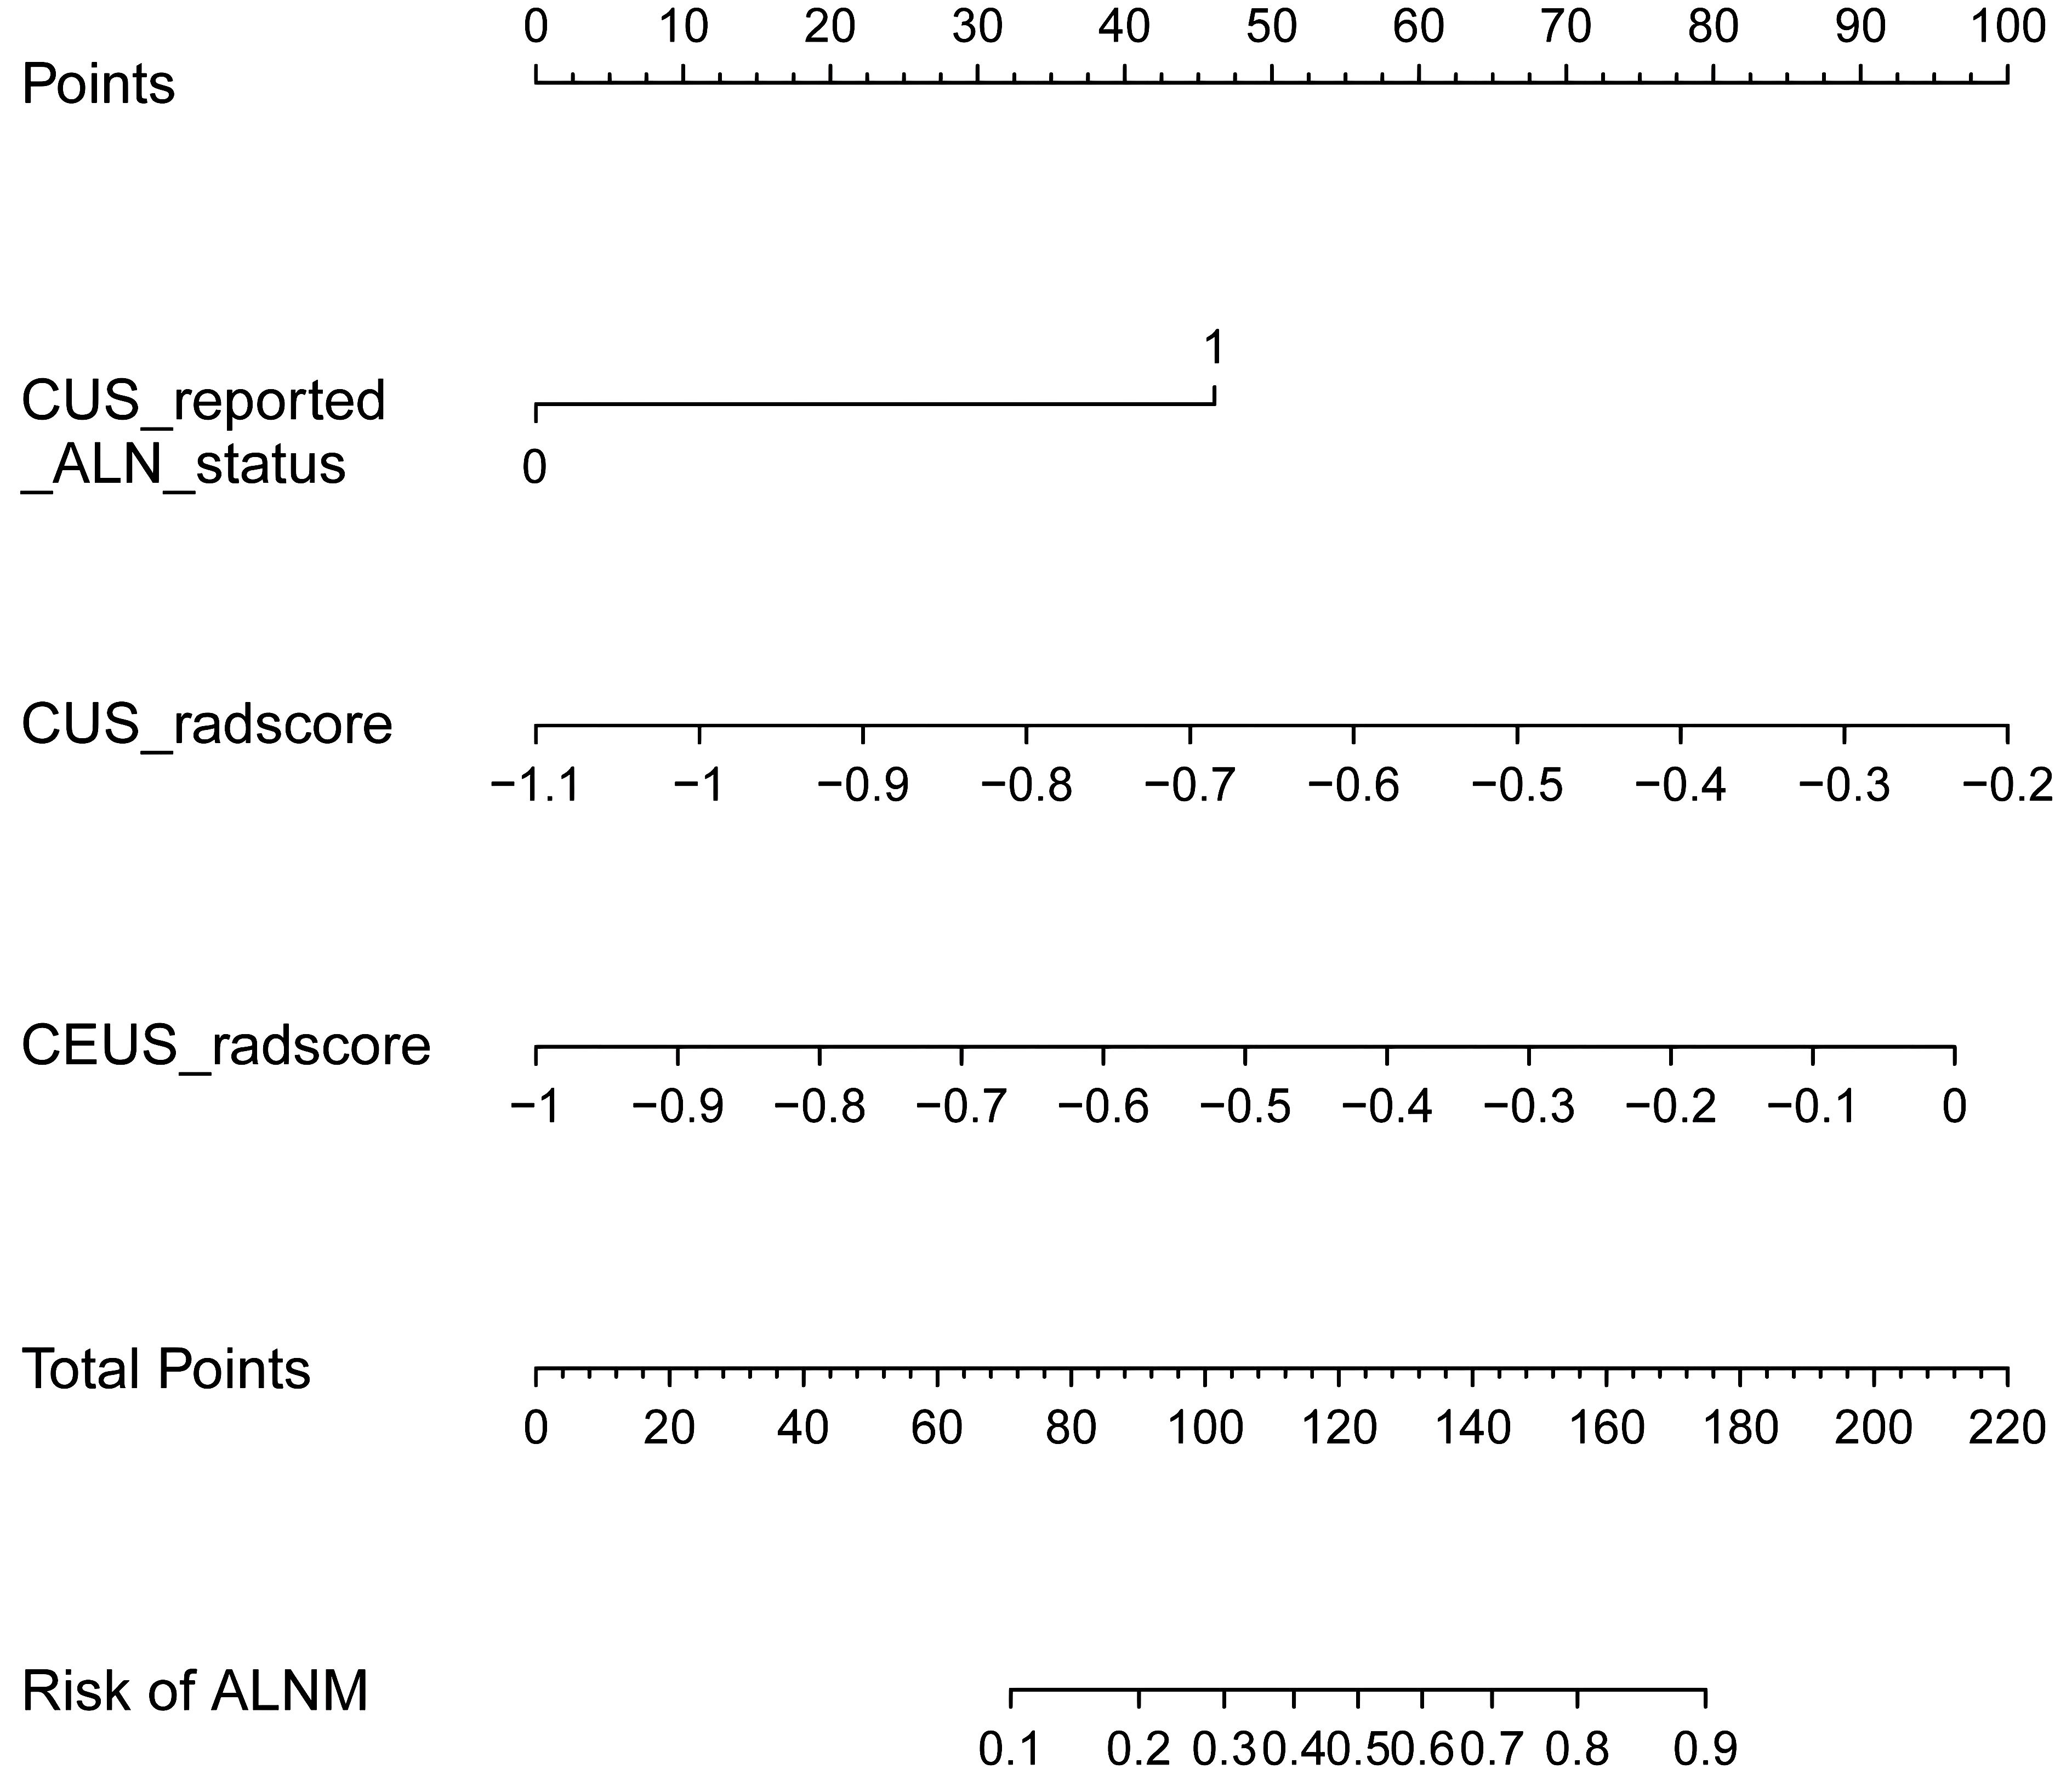
Figure 4 The nomogram developed in the training set using CUS-reported ALN status, CUS-radscore, and CEUS-radscore as predictors. The nomogram plot provides a visual way to calculate the risk of ALNM for breast cancer patients.
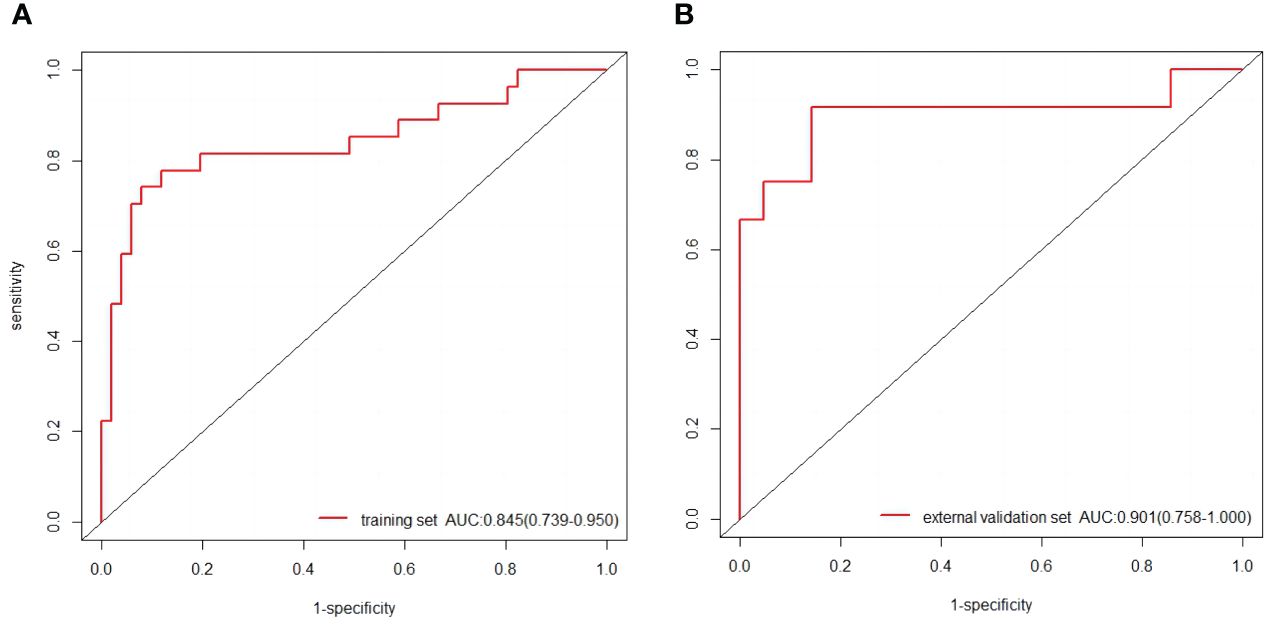
Figure 5 (A) The ROC curves of the nomogram in the training set. (B) The ROC curves of the nomogram in the external validation set.
Calibration curves of the nomogram based on the training and external validation set were plotted to evaluate the consistency between the predicted probability of ALNM and actual pathological results of ALN (Figure 6). The calibration curves of our established nomogram showed a good fitting with the ideal curve in both training and external validation set. The decision curve analysis displayed a positive net benefit for the nomogram when a threshold probability was greater than 0.1, indicating a good clinical utility (Figure 7).
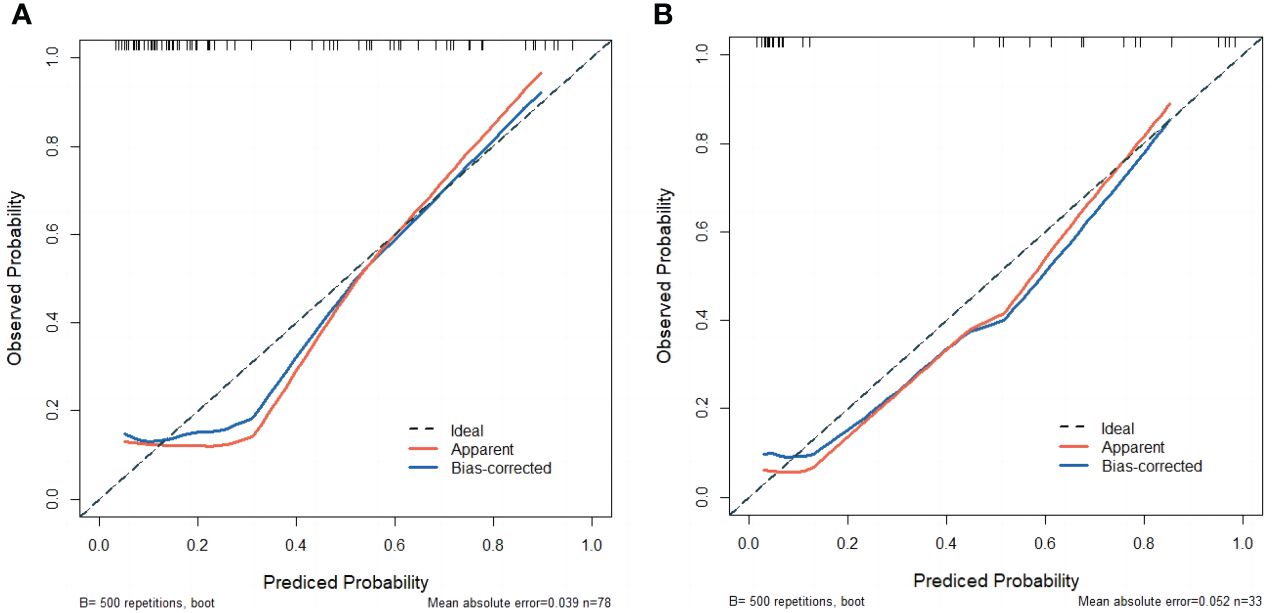
Figure 6 (A) The calibration curve of the nomogram in the training set. (B) The calibration curve of the nomogram in the external validation set.

Figure 7 Decision curve analysis in external validation set.
3.4 Representative examples of the nomogram in clinical practiceThen, we listed two examples of the clinical practice of our proposed nomogram. Patient 1, a 46-year-old woman, was assessed without ALNM by CUS, while an ALNM probability over 0.7 was calculated by the nomogram (Figure 8A). Pathology results confirmed metastatic ALNs were present in this patient. Patient 2, a 49-year-old woman, was assessed with ALNM by CUS, while an ALNM probability around 0.42 was calculated by the nomogram (Figure 8B). Pathology results confirmed metastatic ALNs were absent in this patient.
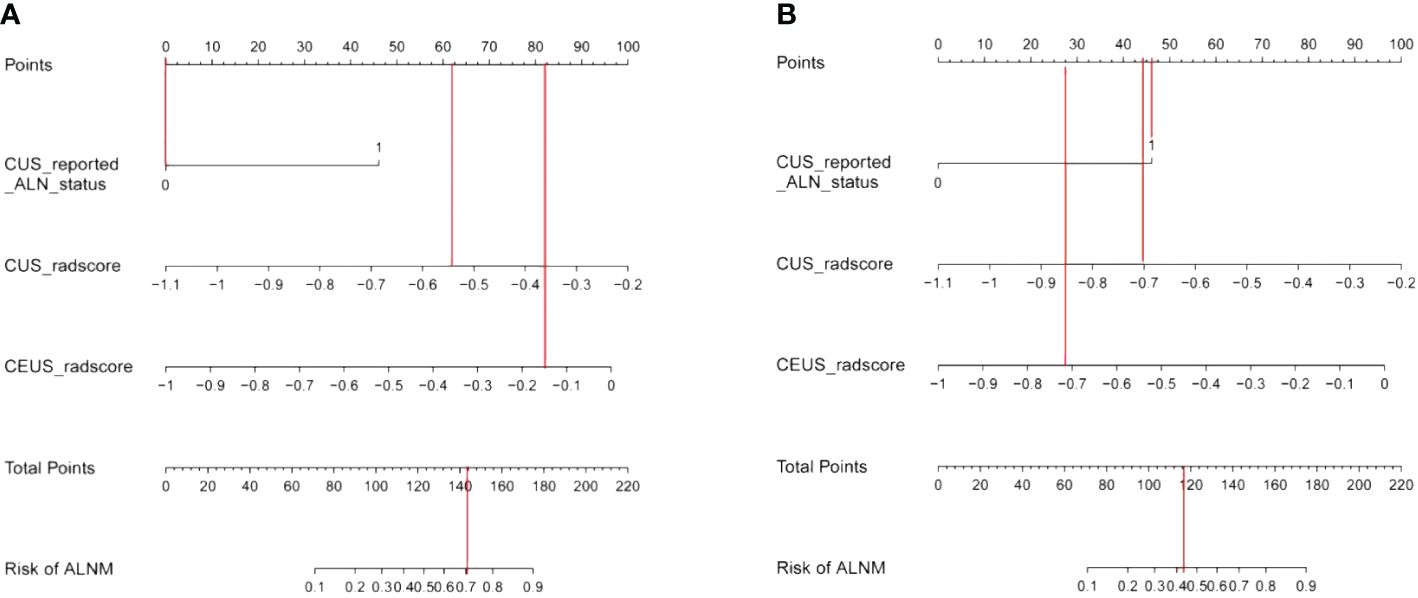
Figure 8 (A) Examples of nomogram evaluation of ALNM in patients with false-negative CUS findings. (B) Examples of nomogram evaluation of ALNM in patients with false-positive CUS findings.
4 DiscussionIn this study, we developed and validated a nomogram to predict ALNM by combining CUS-reported ALN status and radiomics features that were derived from both CUS and CEUS images. A good performance was achieved by our proposed nomogram, with an AUC of 0.845 in the training set and 0.901 in the external validation set.
The ALN status holds significant prognostic value for breast cancer. For invasive breast cancer accompanied with ALNM, ALND is an important treatment option in clinical practice. However, ALND may not suitable for all the patients with breast cancer due its associated complications (5, 6). SLN serves as the first station for lymph node metastases of primary tumors. SLND is considered as an alternative to ALND to determine the ALN status. For SLN negative patients, ALND is not recommended (25, 26). However, SLND is also associated with potential side effects and longer operation time, as well as a certain rate of false negative (7–9, 27). In the background of precision medicine, it is urgent to more effective method for uninvasive prediction of ALNM.
CUS is the routine method for noninvasive assessment of ALN status in breast cancer patients. The presence of irregular cortical thickness, longest-to-shortest axis ratio less than 2, and the absence of a fatty hilum were considered as ultrasonic features suggestive for ALNM on CUS images (23). However, it is difficult for CUS to achieve high accuracy depend on these CUS features for identifying ALNM, especially in pathological N1 patients (10, 28). Recently, several studies have found that the CUS features of primary breast lesions, including tumor size, margin, location and echogenicity were correlated with the tumor biological behavior and thus can help predict ALN status (29–33). Additionally, other studies have reported a potential association between CEUS findings and the prognosis of breast cancers (34, 35). CEUS is also a noninvasive imaging modality that can be conveniently performed on the basis of CUS screening. Different from contrast enhanced CT or MR imaging, CEUS used true intravascular contrast agents without deposition into extravascular space and was capable of reflecting the micro-vascular distribution. In common, the proliferation of vessels would drive the aggressive growth of tumors (36). It was reported that coarse or twisted vessels and enhanced range of the primary tumors were independent predictors for metastatic ALNs (12, 13). The findings of these studies provide support for the feasibility of utilizing radiomics features based on CUS and CEUS to predict the ALN status.
Radiomics can objectively extract and quantitatively analyze features from medical images. In this study, radiomics features were separately extracted from CUS images and CEUS videos. An auto-tracer ROI segmentation technology was applied to outline target region on a continuous series of frames of CEUS video for each target lesion (24). Specifically, Gray Level Size Zone GLSZM (GLSZM) feature was selected as the preferred option among either CUS-radiomics or CEUS-radiomics features. GLSZM measures the size of homogeneous zones for each gray level in an image (37). Previous study demonstrated CLSZM was the optimum texture feature for breast lesion characterization (37, 38). The feature selection results obtained in our study have demonstrated that GLSZM is also optimum feature for the predicting ALNM. It is worth noting that the finally selected CEUS-radiomics features were all generated from images after wavelet transformation. The wavelet transformation is a mathematical algorithm which can mine the hidden patterns from various data, which is not visible to the naked eye (39). Compared with applying CUS-reported ALN status alone, the introduction of either CUS-radiomics features (CUS-radscore) or combined radiomics-features (CUS-radscore and CEUS-radscore) significantly increased the predictive performance. Furthermore, the combination of CUS-radscore, CEUS-radscore and CUS-reported ALN status achieved the highest AUC value, demonstrating the potential value of CEUS for ALNM prediction. Despite an improvement in AUC values for either the training set or external validation set was observed after the incorporation of the CEUS-radscore, the result of Delong test did not reveal a significant difference in AUC values between model 2 (CUS-reported ALN status + CUS-radscore) and model 3 (CUS-reported ALN status + CUS-radscore + CEUS-radscore).This could potentially be attributed to the relatively limited sample size in this study and the N stage of enrolled patients. Given that CUS-reported ALN status exhibits lower diagnostic efficacy in pathological N1 patients (10, 28), integrating predictors derived from CUS or CEUS radiomics into constructing a predictive model holds greater potential for improving AUC values among pathological N1 patients. However, the relatively small sample size of this study restricted the screening of pathological N1 patients for further analysis. A multi-center study with a larger sample size would help to better elucidate the value of CEUS-radscore in predicting ALNM. In clinical practice, the proposed nomogram in our study provides a practical method to quantitatively evaluate the ALNM probability among breast cancer patients. The ALNM probability calculated by the nomogram can serve as a valuable reference for clinicians in determining the necessity of implementing ALND.
There are some limitations of this study that should be mentioned. First, as we mentioned above, the sample size is relatively small and a multi-center study with larger sample size need to be further implemented. Second, a rectangular box was outlined for the ROI segmentation based on CEUS videos. Thus, the shape features derived from CEUS videos could not be used as candidate features. Third, certain ultrasonic sections for target lesions were used to present the whole 3-dimensional lesion for radiomics feature extraction. Fourth, the inter-observer and intra-observer agreement during ROI delineation was not assessed in this study.
5 ConclusionsThis study has established and validated a nomogram for the prediction of ALNM in patients with breast cancer. On the basis of CUS-reported ALN status, the introduction of CUS and CEUS radiomics features derived from primary breast lesions can further improve the predictive performance. Our proposed nomogram is very important in guiding clinical decision and avoid unnecessary invasive operation.
Data availability statementThe raw data supporting the conclusions of this article will be made available by the authors, without undue reservation.
Ethics statementThe studies involving humans were approved by the ethics committee of the Cancer Hospital, Chinese Academy of Medical Sciences and Peking Union Medical College. The studies were conducted in accordance with the local legislation and institutional requirements. Written informed consent for participation in this study was provided by the participants’ legal guardians/next of kin.
Author contributionsCS: Writing – original draft, Methodology, Formal analysis, Conceptualization. XG: Writing – review & editing, Methodology, Data curation. LH: Writing – review & editing, Software, Methodology. DY: Writing – review & editing, Resources, Investigation, Conceptualization. QL: Writing – review & editing, Methodology. LL: Writing – review & editing. YW: Writing – review & editing, Supervision, Funding acquisition, Conceptualization.
FundingThe author(s) declare financial support was received for the research, authorship, and/or publication of this article. This study was supported by Beijing Hope Run Special Fund of Cancer Foundation of China (No. LC2019A01), China postdoctoral science foundation (No. 2017M620683), and Youth Research Fund of Peking Union Medical College (No. 2017320015).
Conflict of interestThe authors declare that the research was conducted in the absence of any commercial or financial relationships that could be construed as a potential conflict of interest.
Publisher’s noteAll claims expressed in this article are solely those of the authors and do not necessarily represent those of their affiliated organizations, or those of the publisher, the editors and the reviewers. Any product that may be evaluated in this article, or claim that may be made by its manufacturer, is not guaranteed or endorsed by the publisher.
References1. Sung H, Ferlay J, Siegel RL, Laversanne M, Soerjomataram I, Jemal A, et al. Global cancer statistics 2020: GLOBOCAN estimates of incidence and mortality worldwide for 36 cancers in 185 countries. CA Cancer J Clin. (2021) 71:209–49. doi: 10.3322/caac.21660
CrossRef Full Text | Google Scholar
2. DeSantis CE, Lin CC, Mariotto AB, Siegel RL, Stein KD, Kramer JL, et al. Cancer treatment and survivorship statistics, 2014. CA Cancer J Clin. (2014) 64:252–71. doi: 10.3322/caac.21235
CrossRef Full Text | Google Scholar
3. DeSantis CE, Ma J, Gaudet MM, Newman LA, Miller KD, Goding Sauer A, et al. Breast cancer statistics, 2019. CA Cancer J Clin. (2019) 69:438–51. doi: 10.3322/caac.21583
CrossRef Full Text | Google Scholar
4. Park KU, Caudle A. Management of the axilla in the patient with breast cancer. Surg Clin North Am. (2018) 98:747–60. doi: 10.1016/j.suc.2018.04.001
CrossRef Full Text | Google Scholar
5. Sakorafas GH, Peros G, Cataliotti L, Vlastos G. Lymphedema following axillary lymph node dissection for breast cancer. Surg Oncol. (2006) 15:153–65. doi: 10.1016/j.suronc.2006.11.003
CrossRef Full Text | Google Scholar
6. Warmuth MA, Bowen G, Prosnitz LR, Chu L, Broadwater G, Peterson B, et al. Complications of axillary lymph node dissection for carcinoma of the breast: a report based on a patient survey. Cancer. (1998) 83:1362–8. doi: 10.1002/(sici)1097-0142(19981001)83:7<1362::aid-cncr13>3.0.co;2-2
CrossRef Full Text | Google Scholar
7. Wilke LG, McCall LM, Posther KE, Whitworth PW, Reintgen DS, Leitch AM, et al. Surgical complications associated with sentinel lymph node biopsy: results from a prospective international cooperative group trial. Ann Surg Oncol. (2006) 13:491–500. doi: 10.1245/ASO.2006.05.013
CrossRef Full Text | Google Scholar
8. Schrenk P, Wayand W. Sentinel-node biopsy in axillary lymph-node staging for patients with multicentric breast cancer. Lancet. (2001) 357:122. doi: 10.1016/S0140-6736(00)03550-9
CrossRef Full Text | Google Scholar
9. Tee SR, Devane LA, Evoy D, Rothwell J, Geraghty J, Prichard RS, et al. Meta-analysis of sentinel lymph node biopsy after neoadjuvant chemotherapy in patients with initial biopsy-proven node-positive breast cancer. Br J Surg. (2018) 105:1541–52. doi: 10.1002/bjs.10986
CrossRef Full Text | Google Scholar
10. Alvarez S, Añorbe E, Alcorta P, López F, Alonso I, Cortés J. Role of sonography in the diagnosis of axillary lymph node metastases in breast cancer: a systematic review. AJR Am J Roentgenol. (2006) 186:1342–8. doi: 10.2214/AJR.05.0936
CrossRef Full Text | Google Scholar
11. Luo Y, Zhao C, Gao Y, Xiao M, Li W, Zhang J, et al. Predicting axillary lymph node status with a nomogram based on breast lesion ultrasound features: performance in N1 breast cancer patients. Front Oncol. (2020) 10:581321. doi: 10.3389/fonc.2020.581321
CrossRef Full Text | Google Scholar
12. Zhu AQ, Li XL, An LW, Guo LH, Fu HJ, Sun LP, et al. Predicting axillary lymph node metastasis in patients with breast invasive ductal carcinoma with negative axillary ultrasound results using conventional ultrasound and contrast-enhanced ultrasound. J Ultrasound Med. (2020) 39:2059–70. doi: 10.1002/jum.15314
CrossRef Full Text | Google Scholar
13. Du Y, Yi CB, Du LW, Gong HY, Ling LJ, Ye XH, et al. Combining primary tumor features derived from conventional and contrast-enhanced ultrasound facilitates the prediction of positive axillary lymph nodes in Breast Imaging Reporting and Data System category 4 Malignant breast lesions. Diagn Interv Radiol. (2023) 29:469–77. doi: 10.4274/dir.2022.22534
CrossRef Full Text | Google Scholar
14. Bi WL, Hosny A, Schabath MB, Giger ML, Birkbak NJ, Mehrtash A, et al. Artificial intelligence in cancer imaging: Clinical challenges and applications. CA Cancer J Clin. (2019) 69:127–57. doi: 10.3322/caac.21552
CrossRef Full Text | Google Scholar
15. Lambin P, Rios-Velazquez E, Leijenaar R, Carvalho S, van Stiphout RG, Granton P, et al. Radiomics: extracting more information from medical images using advanced feature analysis. Eur J Cancer. (2012) 48:441–6. doi: 10.1016/j.ejca.2011.11.036
CrossRef Full Text | Google Scholar
16. Zhang W, Wang S, Wang Y, Sun J, Wei H, Xue W, et al. Ultrasound-based radiomics nomogram for predicting axillary lymph node metastasis in early-stage breast cancer. Radiol Med. (2024) 129:211–21. doi: 10.1007/s11547-024-01768-0
CrossRef Full Text | Google Scholar
17. Gao Y, Luo Y, Zhao C, Xiao M, Ma L, Li W, et al. Nomogram based on radiomics analysis of primary breast cancer ultrasound images: prediction of axillary lymph node tumor burden in patients. Eur Radiol. (2021) 31:928–37. doi: 10.1007/s00330-020-07181-1
CrossRef Full Text | Google Scholar
18. Qiu X, Jiang Y, Zhao Q, Yan C, Huang M, Jiang T. Could ultrasound-based radiomics noninvasively predict axillary lymph node metastasis in breast cancer? J Ultrasound Med. (2020) 39:1897–905. doi: 10.1002/jum.15294
CrossRef Full Text | Google Scholar
19. Harrell F. Regression modelling strategies with application to linear models, logistic regression, and survival analysis. 1ed. New York: Springer-Verlag New York (2001). doi: 10.1007/978-1-4757-3462-1
CrossRef Full Text | Google Scholar
20. Cavaller L, Goupille C, Arbion F, Vilde A, Body G, Ouldamer L. Metastatic profiles and survival differences between infiltrating ductal carcinoma and infiltrating lobular carcinoma in invasive breast cancer. J Gynecol Obstet Hum Reprod. (2024) 53:102740. doi: 10.1016/j.jogoh.2024.102740
CrossRef Full Text | Google Scholar
21. Duraker N, Hot S, Akan A, Nayır PÖ. A comparison of the clinicopathological features, metastasis sites and survival outcomes of invasive lobular, invasive ductal and mixed invasive ductal and lobular breast carcinoma. Eur J Breast Health. (2020) 16:22–31. doi: 10.5152/ejbh.2019.5004
留言 (0)