
記住我


Diabetic bone fragility is a complication of both type 1 and type 2 diabetes mellitus (T1DM, T2DM) and differs from senile and postmenopausal osteoporosis (1, 2). Marrow adipose tissue is a unique type of fat depot that differs from other fat depots in the body. It is sensitive to insulin and possesses distinct metabolic and molecular characteristics that can affect overall energy metabolism (3, 4). Expansion of marrow fat can occur as a result of aging or certain pathologies such as osteoporosis, anorexia nervosa, diabetes mellitus, impaired hematopoiesis, or deficiencies in estrogen and growth hormone (1, 5, 6). Generally, an increase in marrow fat is associated with decreased skeletal integrity (7–9). Since decreased osteoblastogenesis (the formation of new bone) has been observed in T1DM (10), investigating the content of marrow fat is worthwhile.
The phenotype (physical characteristics) of marrow adipose tissue is somewhat unclear. Studies in mouse models of T1DM consistently showed an increase in marrow fat content (6, 11–13). However, when assessing marrow fat content in T1DM patients, some unexpected results were found. Several studies showed no significant difference in marrow fat content between T1DM patients and controls at various skeletal sites such as the lumbar spine, tibia metaphysis, femur epiphysis, and femur metaphysis (14–17). These studies suggest that further clinical research is needed to fully understand whether marrow adipose tissue is altered in T1DM, particularly in first-time diagnosed cases.
Therefore, the purpose of this study was to determine whether there are changes in marrow fat content in first-time diagnosed T1DM patients and to investigate the relationships between marrow fat content and MRI-based findings of trabecular bone microarchitecture.
2 Methods2.1 SubjectsIn this cross-sectional study, we recruited thirty-five first-time diagnosed patients with T1DM from the endocrinology clinic at Shanghai University of Medicine & Health Sciences Affiliated Zhoupu Hospital, during the period spanning from August 2018 through May 2023. The main inclusion criteria was as follows: 1) age 18 years and older; 2) able to understand the study protocol; 3) diagnosis of diabetes based on the World Health Organization 1999 criteria. Exclusion criteria included: 1) chronic diseases that could interfere with the assessment of the variables, such as renal and hepatic chronic diseases; 2) individuals receiving medications affecting bone metabolism (i.e., glucocorticoids, hormone replacement therapy, bisphosphonates, denosumab, teriparatide, strontium ranelate, and calcitonin); 3) co-existing acute diseases, such as acute myocardial infarction and infection, that could affect glucose metabolism. We also recruited forty-six age-, gender-, and body mass index (BMI)-matched healthy controls from the community during the same period, and the exclusion criteria were the same as those for the T1DM cohort.
We collected various clinical data, including age, gender, BMI, personal health, medication history, and lifestyle habits, such as dairy intake, use of vitamins or calcium supplementation, cigarette smoking, and alcohol consumption. Physical activities were defined as engaging in exercise three times a week or more, with each session lasting at least 30 minutes. The study protocol was reviewed and approved by the Institutional Review Board of Shanghai University of Medicine & Health Sciences Affiliated Zhoupu Hospital. All participants provided informed consent prior to their participation in the study.
2.2 Biochemical analysisBlood samples were collected between 8 and 9 a.m. after an overnight fast to minimize confounding factors and ensure accurate assessment of bone health. Enzymatic methods (ADVIA Chemistry XPT; SIEMENS) were used to measure serum creatinine, uric acid, calcium, phosphorus, serum lipid profile (including total cholesterol, high-density lipoprotein cholesterol [HDL-C), low-density lipoprotein cholesterol (LDL-C), and triglyceride (TG)], fasting blood glucose (FBG), and postprandial blood glucose (PBG). Electrochemiluminescence assays (Cobas e601; Roche Diagnostics, Basel, Switzerland) were used to determine serum 25-hydroxyvitamin D [25-(OH)D], total osteocalcin, intact N-terminal propeptide of type I collagen (PINP), and C-terminal crosslinked telopeptides of type I collagen (CTX). Plasma glycated haemoglobin (HbA1c) was determined using high performance liquid chromatography (MQ-6000; Shanghai Medconn Biotechnology Co., Ltd., China).
2.3 Dual-energy x-ray absorptiometryThe area bone mineral density (BMD, g/cm2) of the lumbar spine is an important measure of bone health and is commonly estimated using dual-energy X-ray absorptiometry (DXA). In our study, we utilized the Lunar Prodigy DXA machine manufactured by GE Healthcare in Milwaukee, WI, USA. This machine is widely used and is known for its accuracy and reliability in measuring BMD. In our center, we have established strict quality control measures to ensure the reliability of the DXA scan. One important measure of reliability is the coefficient of variation. In our study, the coefficient of for the lumbar spine BMD measurements was found to be 1.24%.
2.4 MRI assessment of microarchitectureWe captured high-resolution MRI images of the proximal tibia using a 3-T MRI scanner (MAGNETOM Skyra; Siemens Medical Systems, Erlangen, Germany) with a transmit/receive extremity coil suitable for knee imaging. To acquire trabecular images, we utilized a fully balanced steady-state free precession sequence with the following parameters: repetition time (TR) = 10.83 ms, echo time (TE) = 4.69 ms, matrix = 448 × 448, flip angle = 60°, number of averages = 15, number of slices = 20, field of view = 100 mm × 100 mm, and bandwidth (Hz) = 189.
The standardized analysis was performed using the slice located at the insertion point of the patellar ligament. The coded images were then blindly analyzed using MATLAB (MathWorks Inc., San Mateo, CA) to obtain measurements of trabecular parameters. We applied an advanced global thresholding method, using two reference intensity levels: one for marrow fat (Im) and the other for bone (Ib) in image segmentation. To establish the bone reference (Ib), we derived cortical bone intensity from smoothed intensity profiles perpendicular to the cortical bone surface. Cortical intensity for each ray was determined as the first minimum beyond the trabecular region, and the median value from 10 rays was chosen as the cortical intensity for a slice. Meanwhile, the marrow reference intensity (Im) was automatically determined by analyzing the intensity histogram within the trabecular bone region, following a previously established procedure (18, 19). The global threshold, based on the mean intensity of the trabecular region (Itrab), resulted in a bone fraction BV/TV = (Ttrab - Ib)/(Im - Ib). This method ensures the preservation of the average bone fraction within the area, particularly when intensity changes are solely attributed to the partial volume effects of bone and marrow.
The analysis focused on a specific region of trabecular bone in the proximal tibia. Using the segmented binary image, we counted bone pixels within each region of interest (ROI) and calculated the ROI area to determine the apparent bone volume fraction (App BV/TV). To quantify the total number of edges (IL) between bone and marrow phases, we projected rays through the 3D image for each angle pair (θ, φ), with φ set to 0 for 2D analysis. Then, we calculated the mean intercept length (MIL) as L(θ, φ) by multiplying 2 times the App BV/TV with the total length (TL) of lines traversing the image and dividing by IL. Subsequently, we computed the 3D fabric tensor, H, using mean intercept lengths and robust least squares fitting. Eigenvalues were derived through singular value decomposition, with MIL1 > MIL2 > MIL3 representing mean trabecular thickness along primary orientations. The largest eigenvalue and its orientation vividly indicated the main trabecular orientation. Conversely, the other eigenvalues suggested less favored orientations, while under isotropic conditions, all eigenvalues would be comparable. We analyzed structural anisotropy by computing eigenvalue ratios: MIL1/MIL3, MIL2/MIL3, and MIL1/MIL2. Using a slice-by-slice method, we also determined apparent trabecular thickness [appTbTh (mm)], apparent trabecular separation [appTbSp (mm)], and apparent trabecular number [appTbN (1/mm)]. Precision errors were assessed through three scans and analyses on three participants, with repositioning between each session. Subsequently, we calculated the root-mean-square (RMS) average coefficient of variation (CV%). Reproducibility errors, as indicated by the RMS average CV%, ranged from 1.23% to 3.85% across trabecular bone microstructure measurements.
The study involved two musculoskeletal radiologists, L.W. and L.S., who had extensive experience in musculoskeletal MRI, with L.W. having more than 5 years and L.S. having more than 10 years of experience. Both radiologists independently measured trabecular parameters without knowledge of the clinical findings, ensuring unbiased assessments. To evaluate the consistency of the measurements, Two-way, random-effects model, single-measure intraclass correlation coefficients (ICCs) were employed, which accounted for both intra- and inter-observer variability. The strength of the ICC was categorized as follows: 0–0.39 indicating poor agreement, 0.40–0.59 indicating fair agreement, 0.60–0.74 indicating good agreement, and 0.75–1.0 indicating excellent agreement (20).
2.5 MR spectroscopyIn addition, the researchers conducted MR spectroscopy to determine the amount of fat present in the vertebral marrow. The participants were positioned in a supine position inside the scanner. To meet the specific clinical needs of each individual, a standard clinical MRI of the lumbar spine was performed. This included sagittal turbo-spin echo T1- and T2-weighted imaging, as well as transaxial T2-weighted fast spin echo sequence. Following this, a stimulated echo acquisition method (STEAM) sequence was used to measure the percentage of bone marrow fat using MR spectroscopy.
For lumbar MR spectroscopy, a voxel measuring 1.5 cm × 1.5 cm × 1.5 cm was placed in the L3 vertebral body. The volume of interest was positioned in the middle of the vertebral body, and the size of the voxel remained constant throughout the study. The STEAM pulse sequence was used to collect data for single-voxel MR spectroscopy without water suppression. The parameters for the sequence were as follows: TR = 3000 ms, TEs = 12, 24, 36, 48, and 72 ms, data points = 1024, receiver bandwidth = 2000 Hz. Gradient shimming and optimization of transmit and receive gain were performed using automated procedures. The signal intensities of the fat and water peaks were measured at each echo time by integrating the corresponding spectral region. After adjusting for T2 decay by fitting an exponential function to the signal change with echo time, the percentage of fat was calculated using the signal intensities of fat and water (21), as illustrated in Figure 1.
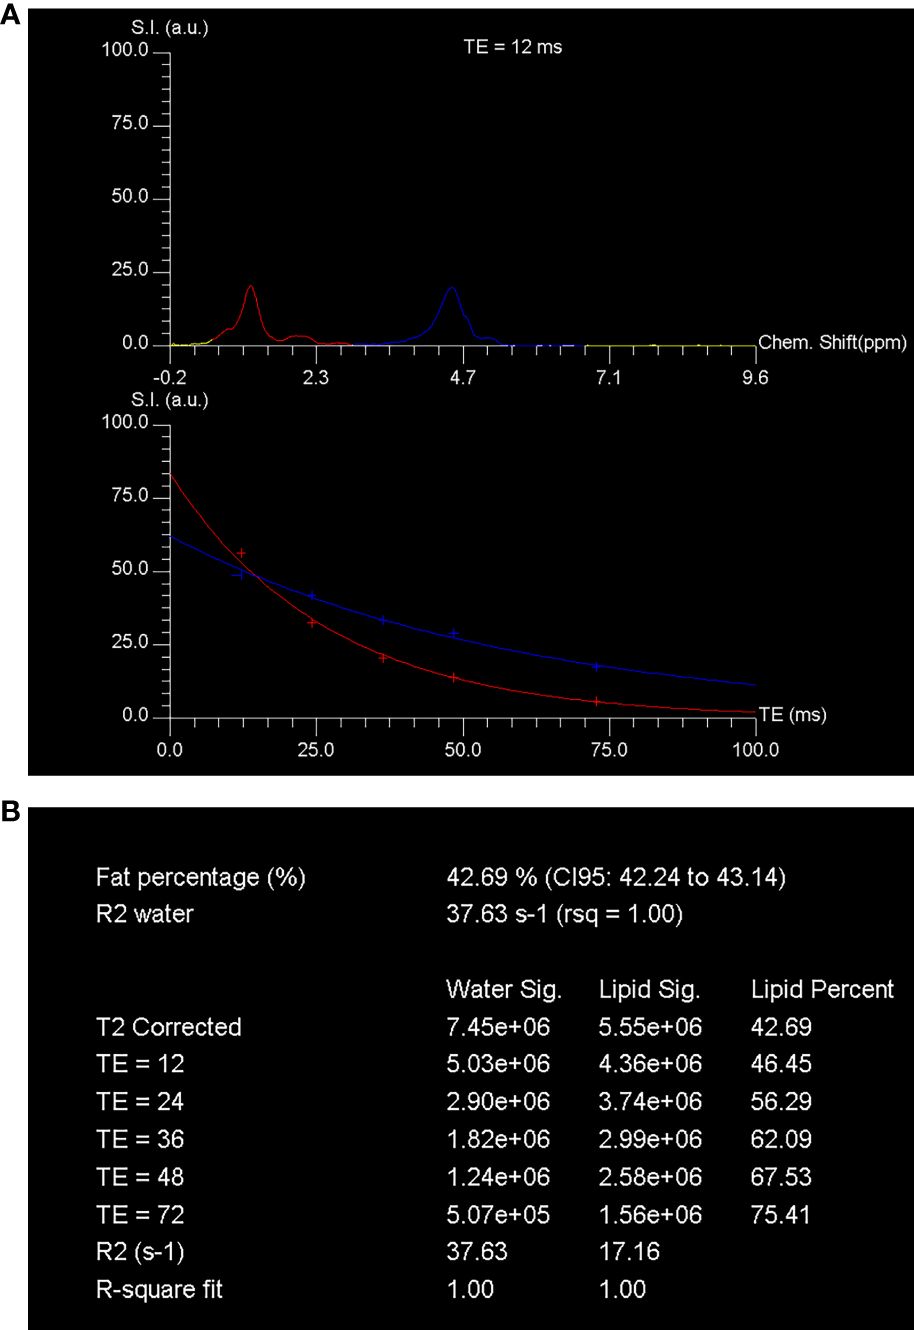
Figure 1 MR spectroscopy assessment of the fat content in vertebral marrow. The spectroscopy was performed using STEAM (stimulated echo acquisition mode) techniques. The technique involved acquiring single-voxel T2-weighted proton spectra at different echo times (TEs) of 12, 24, 36, 48, and 72 ms, along with a repetition time (TR) of 3000 ms. The spectra obtained at a TE of 12 ms showed distinct peaks corresponding to water and fat. The water peak appeared at 4.7 ppm, while the fat peak appeared at 1.30 ppm. These peaks were represented by blue and red curves, respectively, in (A). The signal intensity of these peaks was quantified at each TE. To determine the fraction of marrow fat, the researchers calculated the percent of marrow fat fraction using the T2-corrected fat and water signal intensities. The calculated fraction was found to be 42.7% (B). This calculation was based on the assumption that the fat and water signals followed a T2 decay curve. Chem., chemical; CI, confidence interval; rsq, r-squared; S.I. (a.u.), signal intensity (arbitrary units).
2.6 Statistical analysisThe descriptive statistics included in the analysis were the mean ± standard deviation (SD), median (25th – 75th percentile), counts, and frequencies. The normality of the data was assessed using the Shapiro-Wilks test. Continuous data were compared using Student’s t-test or Mann-Whitney U test, depending on the distribution of the data. Categorical data were compared using the χ2 test or Fisher’s exact test, as appropriate. The association between variables was assessed using Pearson’s or Spearman’s test. Multiple linear regression was performed to examine the associations of MRI-based trabecular microarchitecture with marrow fat fraction, while adjusting for various covariates such as age, gender, body mass index, physical activity, smoking status, alcohol consumption, blood glucose, plasma glycated hemoglobin, lipid profile, and bone turnover biomarkers. Statistical analysis was conducted using SPSS version 25, and a p-value less than 0.05 was considered statistically significant.
3 Results3.1 Clinical characteristics and biochemical markers of bone metabolismTable 1 presents the characteristics of the study population, including both the first-time diagnosed T1DM patients and the controls. There were no significant differences in demographics or anthropometric measurements between the two groups. However, the levels of triglyceride were found to be higher in the adults with first-time diagnosed T1DM compared to the controls. When comparing markers of bone metabolism, including plasma 25-hydroxyvitamin D, PINP, total osteocalcin, and CTX levels, there were no significant differences between the T1DM group and the control group (Table 1).
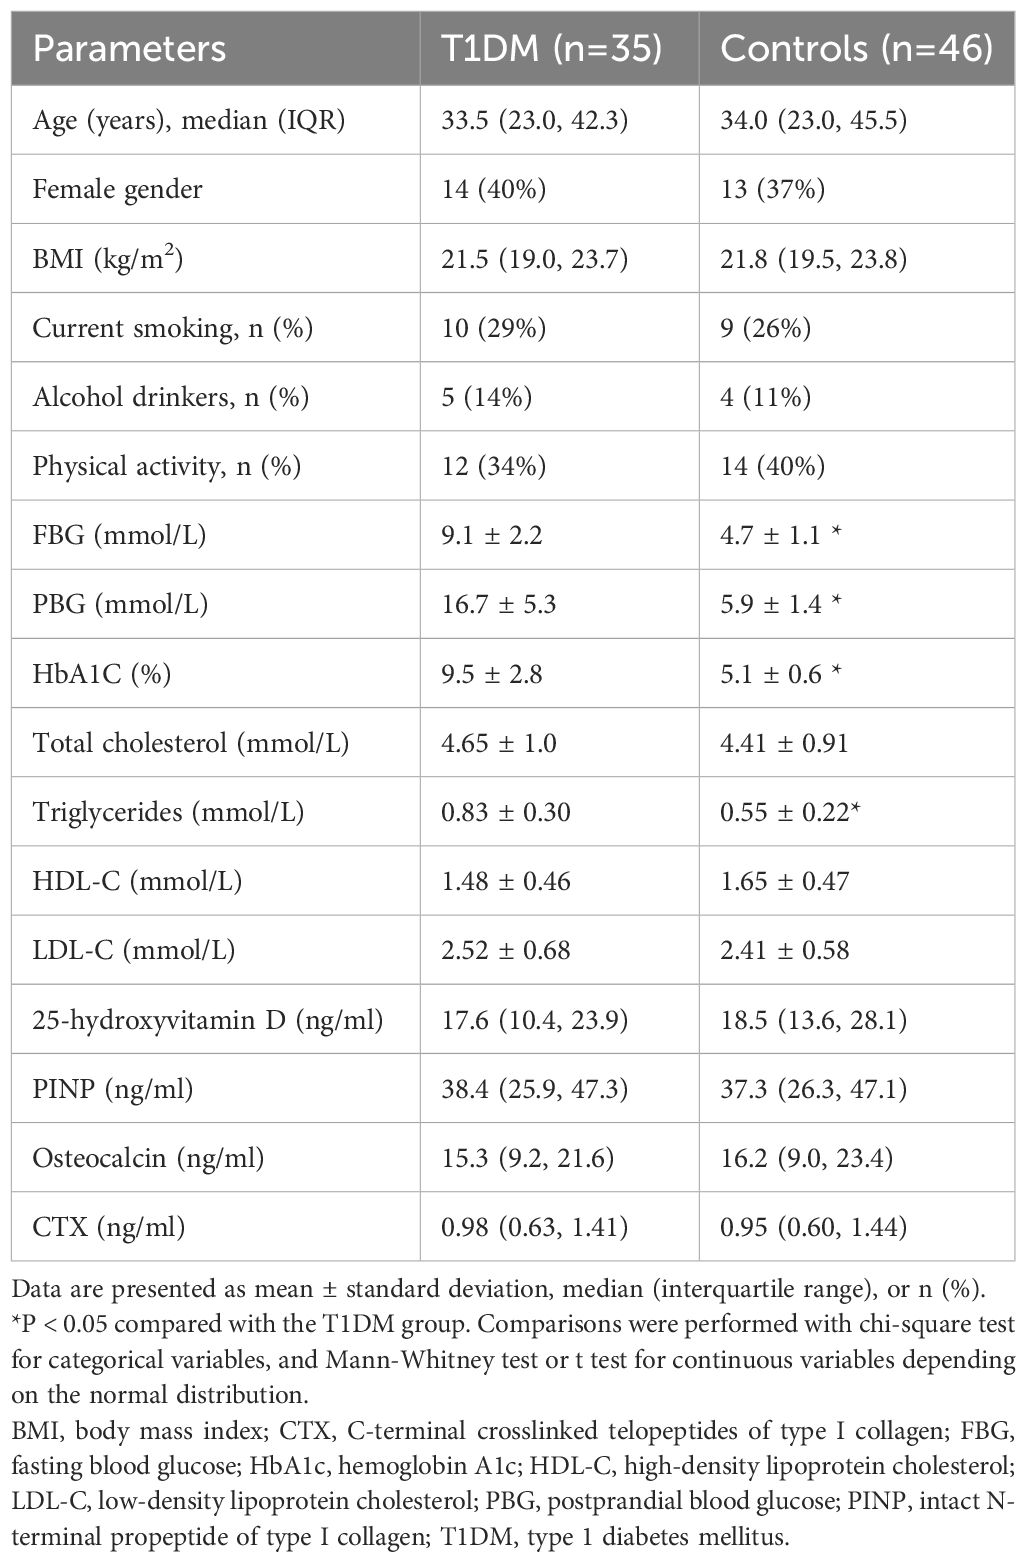
Table 1 Descriptive characteristics of T1DM and controls included in the study.
3.2 Inter- and intra-reader agreementsThere was excellent inter-reader agreement for appBV/TV (ICC = 0.93; 95% CI: 0.90–0.97), appTbN (ICC = 0.91; 95% CI: 0.89–0.95), appTbSp (ICC = 0.93; 95% CI: 0.91–0.97) and appTbTh (ICC = 0.90; 95% CI: 0.87–0.94). Intra-reader agreements for measurements of MRI trabecular bone microarchitecture were likewise excellent, with all ICCs ranging between 0.91–0.97 (95% CI: 0.93–0.96).
3.3 BMD, MRI trabecular bone microarchitecture, and bone marrow adiposity between the cases and controlsFurthermore, the assessment of bone mineral density (BMD) of the lumbar spine using dual-energy X-ray absorptiometry showed no difference between the T1DM group and the control group (Table 2). However, when examining bone microarchitecture of the proximal tibia using MRI-based measures, it was found that trabecular bone microarchitecture variables differed between the T1DM group and the control group. Specifically, appTbSp was significantly higher in T1DM, while appBV/TV and appTbN were lower in T1DM compared to controls. The appTbTh was also lower in T1DM, but this difference did not reach statistical significance. Additionally, the mean vertebral marrow fat fraction was higher in T1DM cases than in controls.
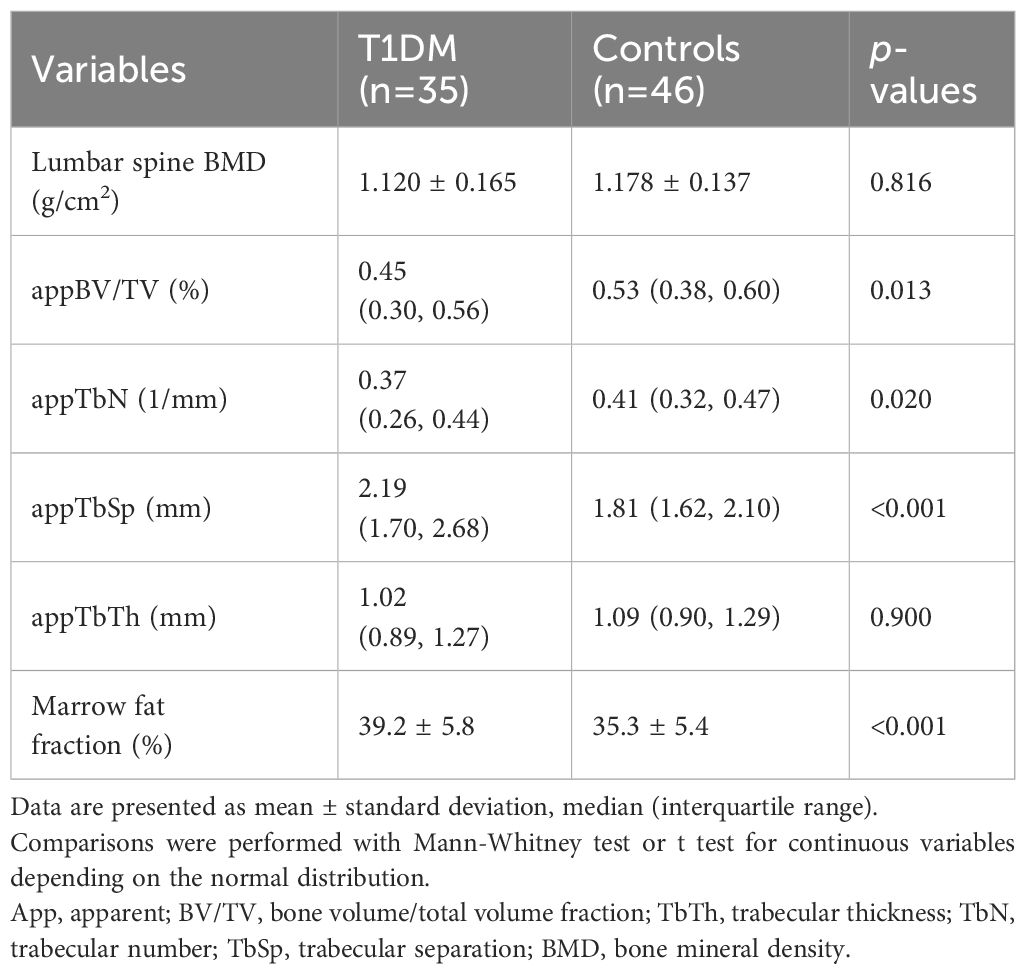
Table 2 BMD, MRI trabecular bone microarchitecture and bone marrow adiposity between the two groups.
3.4 Associations of marrow fat fraction with BMD and MRI trabecular bone microarchitectureIn the T1DM cases, a mild correlation was observed between vertebral marrow fat fraction and BMD at the lumbar spine (r = −0.40, p = 0.024). Moreover, marrow fat fraction values were found to be negatively correlated with appBV/TV (r = −0.69, p < 0.001) and appTbN (r = −0.55, p < 0.001), and positively correlated with appTbSp (r = 0.75, p < 0.001). However, no association was found between vertebral marrow fat fraction and appTbTh (r = −0.25, p = 0.127). To further analyze the relationship between marrow fat fraction, BMD, and MRI-based trabecular bone microarchitecture, a multivariate linear regression model was employed. The results were adjusted for various potential confounding factors, including age, gender, body mass index, physical activity, smoking status, alcohol consumption, blood glucose, plasma glycated haemoglobin, lipid profile, and biochemical markers of bone metabolism. The regression model showed that bone marrow fat fraction was independently associated with total bone volume (standardized β = −0.21), trabecular number (standardized β = −0.12), and trabecular separation (standardized β = 0.57). These associations remained significant after adjusting for confounding factors (p < 0.05 for all) (Table 3).
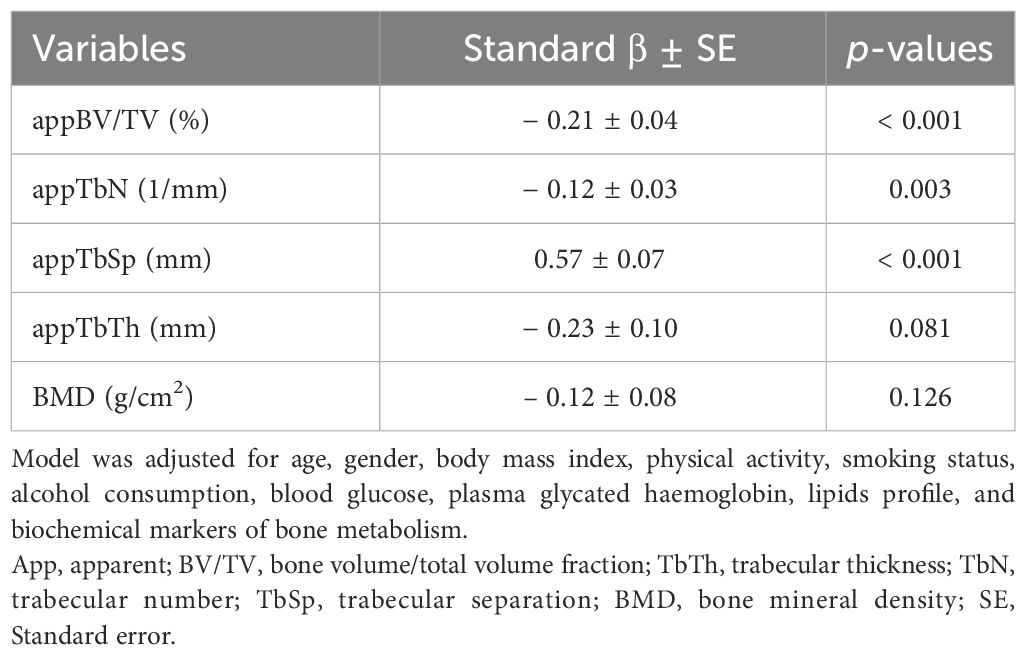
Table 3 Multiple linear regression analysis of MRI-based measures of trabecular bone microarchitecture and BMD on vertebral marrow adiposity in the T1DM group.
4 DiscussionPrevious studies have shown that individuals with T1DM have a higher risk of fragility fractures compared to those without diabetes (1). However, our study did not find any differences in BMD at different bone sites between T1DM and non-diabetic controls, which is consistent with previous reports (22) and a meta-analysis (23). BMD alone does not fully capture bone strength, so assessing bone quality is important in understanding skeletal fragility in diabetes (24).
In our study, we utilized MRI to assess trabecular microarchitecture, specifically focusing on the parameters AppBV/TV, AppTb.N, AppTbTh, and AppTbS. We found that these parameters were altered in T1DM compared to controls, even after adjusting for various confounding factors. Similar findings have been reported in other studies using MRI and DXA to assess trabecular microarchitecture (15, 16, 25). One possible explanation for these alterations in bone quality in T1DM is the impact on bone marrow mesenchymal stem cells. Studies have indicated that diabetic bone marrow mesenchymal stem cells exhibit impaired ability to differentiate into osteoblasts, leading to increased expression of adipocyte markers and reduced osteoblast differentiation markers (26). Animal models of T1DM have also demonstrated an imbalance between bone and fat, with increased marrow fat accumulation and decreased bone mass. The receptor for advanced glycation end products may play a role in this process, as its chronic signaling in T1DM could disrupt bone marrow mesenchymal stromal cells and promote adipocyte differentiation (6, 11).
Historically, single-voxel MR spectroscopy with a single TE gained prominence for evaluating bone marrow fat fraction, particularly in the lumbar vertebrae region (27–30). owever, this method can yield biased results due to complexities such as overlapping water–fat peaks and differences in T2 relaxation times between water and fat signals (7, 20, 31–33). Trabecular bone presence reduces T2* relaxation time, exacerbating peak broadening and overlap among water–fat peaks. Furthermore, differing T2 relaxation times of water and fat introduce biases in fat fraction measurements, especially with a single TE (31). To address this, spectral data were collected at four TEs and meticulously corrected for T2 relaxation times, ensuring precise determination for both water and fat peaks. This correction, based on measured T2 values from multi-TE MR spectroscopy, effectively eliminates T2 weighting effects. Additionally, to mitigate J couplings impact, we employed a stimulated echo acquisition mode (STEAM) MR spectroscopy sequence with a short TE in this study (33, 34).
Consistent with previous findings, a recent study demonstrated the presence of an imbalance between bone and fat in the skeletons of mice with diabetes. This was characterized by an increase in fat accumulation within the bone marrow and a decrease in bone mass (2). The receptor for advanced glycation end products is believed to play a role in the development of fat tissue within the bone marrow. The disruption of bone marrow mesenchymal stromal cells in T1DM may be partly explained by chronic signaling of advanced glycation end products. However, when the receptor for advanced glycation end products was deleted, the up-regulation of factors that promote fat cell formation induced by T1DM in bone marrow stromal cells was prevented, as well as their differentiation into adipocytes (35). In T1DM mice, significant fatty deposits were observed within the marrow cavity of long bones. Notably, the levels of receptor activator of nuclear factor-kappaB ligand mRNA and protein were significantly increased in the adipose tissue of diabetic marrow, primarily located on the membranes of adipocytes (36). These findings suggest that increased bone resorption in early-stage T1DM mice is caused by receptor activator of nuclear factor-kappaB ligand derived from marrow adiposity rather than the bone tissue itself.
Several groups have investigated the impact of diabetes mellitus on bone marrow structures and functions in both human subjects and animal models. Animal studies consistently showed an increase in marrow adiposity (6, 11, 13, 37). However, the increase was not equal throughout the skeleton, with higher adiposity observed in diabetic calvaria and femurs compared to vertebrae (38). Human studies have shown mixed results, with some demonstrating higher marrow fat content in T1DM patients compared to controls (15, 16, 25), while others showed no significant difference (14, 17).
In contrast to previous human data, our study found a higher marrow fat fraction in T1DM patients compared to controls. Trabecular microstructures determined by MRI were identified as significant independent variables contributing to the marrow fat fraction. However, further studies are needed to fully understand this correlation. The conflicting results between animal models and patients may be due to confounding factors such as comorbidities and the limited size of clinical studies (39). Additionally, different measurement methods and specific analysis factors can also contribute to varying results.
Our study has some limitations. First, prior studies indicated that vertebral bone marrow heterogeneity seems to be primarily age-, sex- and menopause status-dependent (40, 41). Our study participants included males and females, both premenopausal and postmenopausal women. However, the sample size was not large enough to adequately compare different subgroups. Second, data on the severity of diabetes or other risk factors for bone deterioration were unavailable. Additionally, the cross-sectional survey design limits our ability to determine causality. Longitudinal studies would provide more insight into the progression of marrow adiposity in diabetes mellitus.
In conclusion, our study suggests that elevated marrow fat content in first-time diagnosed T1DM subjects may indicate altered trabecular bone microstructure associated with marrow adiposity. Incorporating marrow fat fraction measurement into MRI-based trabecular bone microarchitecture assessment could prove to be a valuable tool in the routine clinical evaluation of diabetic bone fragility.
Data availability statementThe raw data supporting the conclusions of this article will be made available by the authors, without undue reservation.
Ethics statementThe studies involving humans were approved by the Institutional Review Board of Shanghai University of Medicine & Health Sciences Affiliated Zhoupu Hospital. The studies were conducted in accordance with the local legislation and institutional requirements. The participants provided their written informed consent to participate in this study.
Author contributionsWL: Methodology, Writing – original draft. WW: Data curation, Investigation, Writing – review & editing. MZ: Writing – review & editing, Formal analysis, Methodology. QC: Methodology, Writing – review & editing, Data curation. SL: Methodology, Writing – review & editing, Funding acquisition, Supervision, Validation.
FundingThe author(s) declare financial support was received for the research, authorship, and/or publication of this article. This work was supported by the funds for Training Project of Academic Leaders of Health System in Pudong New Area of Shanghai (NO. PWRd2021-07).
AcknowledgmentsThe authors would like to thank Dr. Fengyi Li (Shanghai University of Medicine & Health Sciences Affiliated Zhoupu Hospital) for the invaluable assistance with statistical analysis.
Conflict of interestThe authors declare that the research was conducted in the absence of any commercial or financial relationships that could be construed as a potential conflict of interest.
Publisher’s noteAll claims expressed in this article are solely those of the authors and do not necessarily represent those of their affiliated organizations, or those of the publisher, the editors and the reviewers. Any product that may be evaluated in this article, or claim that may be made by its manufacturer, is not guaranteed or endorsed by the publisher.
References2. Han F, Wang C, Cheng P, Liu T, Wang WS. Bone marrow mesenchymal stem cells derived exosomal miRNAs can modulate diabetic bone-fat imbalance. Front Endocrinol (Lausanne). (2023) 14:1149168. doi: 10.3389/fendo.2023.1149168
PubMed Abstract | CrossRef Full Text | Google Scholar
3. Suchacki KJ, Tavares AAS, Mattiucci D, Scheller EL, Papanastasiou G, Gray C, et al. Bone marrow adipose tissue is a unique adipose subtype with distinct roles in glucose homeostasis. Nat Commun. (2020) 11:3097. doi: 10.1038/s41467-020-16878-2
PubMed Abstract | CrossRef Full Text | Google Scholar
4. Pham TT, Ivaska KK, Hannukainen JC, Virtanen KA, Lidell ME, Enerback S, et al. Human bone marrow adipose tissue is a metabolically active and insulin-sensitive distinct fat depot. J Clin Endocrinol Metab. (2020) 105:2300–10. doi: 10.1210/clinem/dgaa216
PubMed Abstract | CrossRef Full Text | Google Scholar
5. Li G, Xu Z, Li X, Zuo X, Chang S, Wu D, et al. Adding marrow R2 * to proton density fat fraction improves the discrimination of osteopenia and osteoporosis in postmenopausal women assessed with 3D FACT sequence. Menopause. (2021) 28:800–6. doi: 10.1097/GME.0000000000001799
PubMed Abstract | CrossRef Full Text | Google Scholar
6. Botolin S, McCabe LR. Bone loss and increased bone adiposity in spontaneous and pharmacologically induced diabetic mice. Endocrinology. (2007) 148:198–205. doi: 10.1210/en.2006-1006
PubMed Abstract | CrossRef Full Text | Google Scholar
7. Li G, Xu Z, Gu H, Li X, Yuan W, Chang S, et al. Comparison of chemical shift-encoded water-fat MRI and MR spectroscopy in quantification of marrow fat in postmenopausal females. J Magn Reson Imaging. (2017) 45:66–73. doi: 10.1002/jmri.25351
PubMed Abstract | CrossRef Full Text | Google Scholar
8. Cordes C, Baum T, Dieckmeyer M, Ruschke S, Diefenbach MN, Hauner H, et al. MR-based assessment of bone marrow fat in osteoporosis, diabetes, and obesity. Front Endocrinol (Lausanne). (2016) 7:74. doi: 10.3389/fendo.2016.00074
PubMed Abstract | CrossRef Full Text | Google Scholar
9. Chen L, Ma R, Luo P, Shi D, Shi X, Nian H, et al. Effects of total flavonoids of epimedium on bone marrow adipose tissue in ovariectomized rats. Front Endocrinol (Lausanne). (2022) 13:900816. doi: 10.3389/fendo.2022.900816
PubMed Abstract | CrossRef Full Text | Google Scholar
10. Raehtz S, Bierhalter H, Schoenherr D, Parameswaran N, McCabe LR. Estrogen deficiency exacerbates type 1 diabetes-induced bone TNF-alpha expression and osteoporosis in female mice. Endocrinology. (2017) 158:2086–101. doi: 10.1210/en.2016-1821
PubMed Abstract | CrossRef Full Text | Google Scholar
11. Botolin S, Faugere MC, Malluche H, Orth M, Meyer R, McCabe LR. Increased bone adiposity and peroxisomal proliferator-activated receptor-gamma2 expression in type I diabetic mice. Endocrinology. (2005) 146:3622–31. doi: 10.1210/en.2004-1677
PubMed Abstract | CrossRef Full Text | Google Scholar
13. Motyl KJ, Raetz M, Tekalur SA, Schwartz RC, McCabe LR. CCAAT/enhancer binding protein beta-deficiency enhances type 1 diabetic bone phenotype by increasing marrow adiposity and bone resorption. Am J Physiol Regul Integr Comp Physiol. (2011) 300:R1250–60. doi: 10.1152/ajpregu.00764.2010
PubMed Abstract | CrossRef Full Text | Google Scholar
14. Slade JM, Coe LM, Meyer RA, McCabe LR. Human bone marrow adiposity is linked with serum lipid levels not T1-diabetes. J Diabetes Complications. (2012) 26:1–9. doi: 10.1016/j.jdiacomp.2011.11.001
PubMed Abstract | CrossRef Full Text | Google Scholar
15. Abdalrahaman N, McComb C, Foster JE, McLean J, Lindsay RS, McClure J, et al. Deficits in trabecular bone microarchitecture in young women with type 1 diabetes mellitus. J Bone Miner Res. (2015) 30:1386–93. doi: 10.1002/jbmr.2465
PubMed Abstract | CrossRef Full Text | Google Scholar
16. Chen SC, Shepherd S, McMillan M, McNeilly J, Foster J, Wong SC, et al. Skeletal fragility and its clinical determinants in children with type 1 diabetes. J Clin Endocrinol Metab. (2019) 104:3585–94. doi: 10.1210/jc.2019-00084
PubMed Abstract | CrossRef Full Text | Google Scholar
17. Carvalho AL, Massaro B, Silva L, Salmon CEG, Fukada SY, Nogueira-Barbosa MH, et al. Emerging aspects of the body composition, bone marrow adipose tissue and skeletal phenotypes in type 1 diabetes mellitus. J Clin Densitom. (2019) 22:420–8. doi: 10.1016/j.jocd.2018.06.007
PubMed Abstract | CrossRef Full Text | Google Scholar
18. Newitt DC, Majumdar S, van Rietbergen B, von Ingersleben G, Harris ST, Genant HK, et al. In vivo assessment of architecture and micro-finite element analysis derived indices of mechanical properties of trabecular bone in the radius. Osteoporos Int. (2002) 13:6–17. doi: 10.1007/s198-002-8332-0
PubMed Abstract | CrossRef Full Text | Google Scholar
19. Majumdar S, Genant HK, Grampp S, Newitt DC, Truong VH, Lin JC, et al. Correlation of trabecular bone structure with age, bone mineral density, and osteoporotic status: in vivo studies in the distal radius using high resolution magnetic resonance imaging. J Bone Miner Res. (1997) 12:111–8. doi: 10.1359/jbmr.1997.12.1.111
PubMed Abstract | CrossRef Full Text | Google Scholar
20. Kim HJ, Cho HJ, Kim B, You MW, Lee JH, Huh J, et al. Accuracy and precision of proton density fat fraction measurement across field strengths and scan intervals: A phantom and human study. J Magn Reson Imaging. (2019) 50:305–14. doi: 10.1002/jmri.26575
PubMed Abstract | CrossRef Full Text | Google Scholar
21. Li S, Wang B, Liang W, Chen Q, Wang W, Mei J, et al. Associations between vertebral marrow proton density fat fraction and risk of prostate cancer. Front Endocrinol (Lausanne). (2022) 13:874904. doi: 10.3389/fendo.2022.874904
PubMed Abstract | CrossRef Full Text | Google Scholar
22. Shah VN, Sippl R, Joshee P, Pyle L, Kohrt WM, Schauer IE, et al. Trabecular bone quality is lower in adults with type 1 diabetes and is negatively associated with insulin resistance. Osteoporos Int. (2018) 29:733–9. doi: 10.1007/s00198-017-4353-0
PubMed Abstract | CrossRef Full Text | Google Scholar
23. Shah VN, Harrall KK, Shah CS, Gallo TL, Joshee P, Snell-Bergeon JK, et al. Bone mineral density at femoral neck and lumbar spine in adults with type 1 diabetes: a meta-analysis and review of the literature. Osteoporos Int. (2017) 28:2601–10. doi: 10.1007/s00198-017-4097-x
PubMed Abstract | CrossRef Full Text | Google Scholar
24. Haffer H, Muellner M, Chiapparelli E, Moser M, Dodo Y, Zhu J, et al. Bone quality in patients with osteoporosis undergoing lumbar fusion surgery: analysis of the MRI-based vertebral bone quality score and the bone microstructure derived from microcomputed tomography. Spine J. (2022) 22:1642–50. doi: 10.1016/j.spinee.2022.05.008
PubMed Abstract | CrossRef Full Text | Google Scholar
25. Abdalrahaman N, McComb C, Foster JE, Lindsay RS, Drummond R, McKay GA, et al. The relationship between adiposity, bone density and microarchitecture is maintained in young women irrespective of diabetes status. Clin Endocrinol (Oxf). (2017) 87:327–35. doi: 10.1111/cen.13410
PubMed Abstract | CrossRef Full Text | Google Scholar
26. Filion TM, Skelly JD, Huang H, Greiner DL, Ayers DC, Song J. Impaired osteogenesis of T1DM bone marrow-derived stromal cells and periosteum-derived cells and their differential in-vitro responses to growth factor rescue. Stem Cell Res Ther. (2017) 8:65. doi: 10.1186/s13287-017-0521-6
PubMed Abstract | CrossRef Full Text | Google Scholar
27. Li G, Xu Z, Lin H, Chen Y, Li X, Chang S. Association between insulin resistance and the magnetic resonance spectroscopy-determined marrow fat fraction in nondiabetic postmenopausal women. Menopause. (2018) 25:676–82. doi: 10.1097/GME.0000000000001063
PubMed Abstract | CrossRef Full Text | Google Scholar
28. Schwartz AV, Sigurdsson S, Hue TF, Lang TF, Harris TB, Rosen CJ, et al. Vertebral bone marrow fat associated with lower trabecular BMD and prevalent vertebral fracture in older adults. J Clin Endocrinol Metab. (2013) 98:2294–300. doi: 10.1210/jc.2012-3949
PubMed Abstract | CrossRef Full Text | Google Scholar
29. Roldan-Valadez E, Piña-Jimenez C, Favila R, Rios C. Gender and age groups interactions in the quantification of bone marrow fat content in lumbar spine using 3T MR spectroscopy: a multivariate analysis of covariance (Mancova). Eur J Radiol. (2013) 82:e697–702. doi: 10.1016/j.ejrad.2013.07.012
PubMed Abstract | CrossRef Full Text | Google Scholar
30. Singhal V, Miller KK, Torriani M, Bredella MA. Short- and long-term reproducibility of marrow adipose tissue quantification by 1H-MR spectroscopy. Skeletal Radiol. (2016) 45:221–5. doi: 10.1007/s00256-015-2292-4
PubMed Abstract | CrossRef Full Text | Google Scholar
31. Dieckmeyer M, Ruschke S, Cordes C, Yap SP, Kooijman H, Hauner H, et al. The need for T(2) correction on MRS-based vertebral bone marrow fat quantification: implications for bone marrow fat fraction age dependence. NMR BioMed. (2015) 28:432–9. doi: 10.1002/nbm.3267
PubMed Abstract | CrossRef Full Text | Google Scholar
32. Karampinos DC, Ruschke S, Gordijenko O, Grande Garcia E, Kooijman H, Burgkart R, et al. Association of MRS-based vertebral bone marrow fat fraction with bone strength in a human in vitro model. J Osteoporos. (2015) 2015:152349. doi: 10.1155/2015/152349
PubMed Abstract | CrossRef Full Text | Google Scholar
33. Karampinos DC, Ruschke S, Dieckmeyer M, Diefenbach M, Franz D, Gersing AS, et al. Quantitative MRI and spectroscopy of bone marrow. J Magnetic Resonance Imaging. (2018) 47:332–53. doi: 10.1002/jmri.25769
CrossRef Full Text | Google Scholar
34. Hamilton G, Middleton MS, Bydder M, Yokoo T, Schwimmer JB, Kono Y, et al. Effect of PRESS and STEAM sequences on magnetic resonance spectroscopic liver fat quanti
留言 (0)