
記住我


Stachys sylvatica L., commonly known as hedge woundwort, is a perennial plant that belongs to the Lamiaceae family consisting of approximately 370 species and about 435 taxa (Güner et al., 2021). It is characterized by an erect, hirsute, tall stem that can grow up to 100 cm. It has opposite, cordate leaves, which are sparsely hirsute. It blooms from June to August, producing reddish-purple flowers organized in verticillasters. The leaves are responsible for the plant’s unpleasant smell (Alizadeh et al., 2020). Plants from the Stachys L. genus can be found in both hemispheres, including the Mediterranean Region, southwest Asia as well as in South and North America and North Africa, except for New Zeland and Australia (Tunçtürk et al., 2019; Güner et al., 2021; Kanjevac et al., 2023). S. sylvatica L. growth area in Kazakhstan includes Altai, Tarbagatai, the Dzungarian Alatau and the ridges of the Northern Tian Shan: Zailiysky, Kungei, Terskei Alatau and Ketmen. S. sylvatica L. prefers wet and shady forest areas, the banks of rivers and streams, often places situated at high altitudes (Hajdari et al., 2012; Alizadeh et al., 2020; Apostolescu et al., 2023).
It is worth notifying that the Stachys L. genus has a long and rich history of use in traditional medicine, e.g., in Italy, Greece, Turkey, Kosovo, Serbia, Montenegro, Poland, Iran, China, Japan, India, Brazil and Peru, where it has been prepared in a form of essential oil, tea, infusion and dried plant parts administered orally or directly on the skin (Gören, 2014; Polat et al., 2015; Tomou et al., 2020). Plants belonging to the Stachys L. genus constitute a rich source of diverse metabolites exhibiting a wide spectrum of biological activity: antioxidant (Kukić et al., 2006; Jassbi et al., 2014; Tundis et al., 2015), anticancer (Foruzani et al., 2015; Barmoudeh et al., 2022; Slimani et al., 2023) and antimicrobial (Saeedi et al., 2008; Koutsaviti et al., 2011; Lazarević et al., 2013; Gizem et al., 2021). The chemical composition of Stachys species varies and depends strongly on the type of plant habitat and geographical location, the availability of water and nutrients or the stage of plant development (Kanjevac et al., 2023). Among the most biologically active secondary metabolites, there are polyphenols, iridoids, terpenoids, fatty acids, alkaloids, triterpenes and many others, represented by more than 200 metabolites (Bilušić, 2019; Tomou et al., 2020). However, there are only scarce data on Stachys sylvatica L. derived mostly from Balkan Peninsula region (Hajdari et al., 2012; Jassbi et al., 2014; Dimitrova et al., 2015; Bilušić, 2019; Apostolescu et al., 2023; Di Stasi et al., 2023).
The study aimed to characterize the qualitative and quantitative chemical composition of hydroethanolic extract (50% v/v) from the aerial parts of S. sylvatica L. collected in the flowering stage (SSE) growing in Almaty region (Southern Kazakhstan) obtained with the aid of ultrasonication. The biological activity of this extract, including anthelminthic, antimicrobial and anticancer properties, was also evaluated.
2 Materials and methods2.1 The collection of plant material and extraction procedureThe aerial parts of Stachys sylvatica L. were collected at the flowering stage in July 2021 at its wild habitat near Zailiysky Alatau mountain (Almaty, Kazakhstan; 43°11′44.5″N 77°07′11.0″E). During the collection of the raw material, more than 5 kg was collected, which was further used for the identification and standardization of the plant. For the extraction experiment described below, 25 g of the crushed raw material was used. The plants were identified following the requirements of the State Pharmacopoeia of the Republic of Kazakhstan by Sitpaeva Gulnara Tokbergenovna, at the Laboratory of the Flora of Higher Plants of the Institute of Botany and Phytointroduction of the Committee of Forestry and Wildlife of the Ministry of Ecology, Geology and Natural Resources of the Republic of Kazakhstan (Voucher No. 01–05/309). After collection, following the Guideline on Good Agricultural and Collection Practice, all impurities such as other plants or soil were removed. Extraction procedure was conducted following patent (Mukhamedsadykova et al., 2023). The plant material was air-dried under the canopy in natural conditions at temperature ranging from 30°C to 35°C for several days and shredded. Voucher specimens were deposited in the Institute of Botany and Phytointroduction for replenishment of the herbarium fund of the main botanical garden. First, the aerial parts of S. sylvatica L. composed of flowers, leaves and stems were cut into 3–4 cm pieces. Then, 300 mL of 50% ethanol (50% v/v) was added to 25 g of crushed raw material placed in a 500 mL flask and put in an alcoholic (SOUS) ultrasonic extractor (KQ5200B; Kunshan Instruments Inc., China) for 25 min (room temperature, 40 kHz). The process was repeated three times with the same solvent. Then, to obtain a dry extract, the solvent was removed with the use of an evaporation process at 45°C for 8 h (Concentrator plus, Eppendorf). The extraction yield was equal to 24.93 ± 0.28 g/100 g DW.
2.2 Reverse phase high-performance liquid chromatographic method with photodiode array analysis (RP-HPLC/PDA)In preparing the SSE for determination, it was necessary to purify it of potential interfering components (e.g. chlorophyll). First, 25 mg of the extract was dissolved in 2 mL of methanol-water mixture (1:1 v/v) and then, using a solid phase extraction system (SPE system J.T. Baker, United States) and 500 mg C18 micro-columns (J.T. Baker, United States), the tested extract was applied to the octadecyl BakerBond cartridges, that had previously been appropriately spiked and conditioned (10 mL of MeOH and 10 mL of the methanol-water mixture (1:1 v/v)). The extract was eluted with a methanol-water mixture (1:1 v/v) in portions of the eluent, directly into the receiver, which was a 10 mL analytical volumetric flask. The operating pressure of the device was −0.01 Mpa. The extract was then prepared for qualitative and quantitative analysis.
Qualitative and quantitative analysis using high-performance column chromatography coupled to a photodiode array detector was performed using a Agilent Technologies (Waldbronn, Germany) 1,100 Series liquid chromatograph equipped with an autosampler. Analysis of the extract was performed using three wavelengths: 254 nm, 280 nm and 325 nm, due to the diversity of metabolites (phenolic acids and derivatives as well as flavonoids and their derivatives). A chromatographic column Zorbax Eclipse XDB C8 column (150 × 4.6 mm I.D., dp = 5 μm) was used, which allowed the extract to be analysed in 30 min using the following eluent gradient: A–water +1% (v/v) acetic acid; B–acetonitrile (0% min–10% B; 0–10 min–10%–14%B; 10–25 min–14%–30% B; 25–30 min–30%–33% B) at a flow-rate of the mobile phase of 1 mL/min and using a fixed analysis temperature of 25°C. Due to the use of the autosampler, it was necessary to use a postrun time of 5 min for the data analysis. For identification purposes, a library of standard substances was created for the particular HPLC/DAD analysis method used in the study. These standards were also collected with consideration of the starting concentration–for each standard substance at 1 mg/10 mL of solution. Qualitative analysis was based on the chromatographic (peak areas, retention times of individual standard compounds) and spectroscopic (UV spectra) data. Quantitative analysis was carried out, taking into account a threefold analysis (n = 3) on three consecutive days of the extract tested. Quantitative analysis of selected and identified metabolites was prepared in methanol:water (6:4 v/v) for phenolic compounds and in methanol for flavonoids at five concentrations ranging from 0.02 to 0.1 mg/mL. Five-point curves were constructed and regression equations together with R2 values were calculated for each calibration curve. The repeatability of peak areas was determined by the evaluation of both SD and RSD parameters.
2.3 Applied high performance liquid chromatography coupled with mass spectrometry based detection fingerprinting (HPLC-ESI-QTOF-MS/MS)The fingerprinting of the obtained extract was performed on a platform composed of HPLC chromatograph (HP1200 Series, Agilent Technologies, Santa Clara, CA, United States) composed of a degasser, an autosampler, a binary pump, and a PDA detector - with a QTOF-MS/MS mass detector (6500 Series, Agilent Technologies, Santa Clara, CA, United States). The chromatographic separation of metabolites was achieved in an optimized method and by applying a Zorbax Eclipse Plus RP-18 chromatographic column (150 mm × 2.1 mm, dp = 3.5 µm, Agilent Technologies, Santa Clara, CA, United States). The chromatograms were recorded in a gradient of solvents: acetonitrile with 0.1% formic acid (solvent B) and 0.1% aqueous solution of formic acid (solvent A) as follows: 0 min–1% of B, 10 min–20% of B, 15 min–40% B, 17–22 min–95% B, 22.1–25 min–1% of B. The run lasted 30 min. The flow rate was set as 0.2 mL/min, the temperature of thermostat at 20°C, UV detection as 210, 254, 280, 365 and 320 nm and the injection volume was 10 µL.
Mass spectrometer was operated in both positive and negative ion mode in the mass range of 40–1,300 u, with the temperature settings of 275°C and 325°C for gas and sheath gas, respectively, gas flows of 12 L/min, capillary voltage of 3000 V, nebulizer pressure of 35 psig, collision energies of 10 and 20 V, fragmentor voltage of 110 V, and skimmer voltage of 65 V. Qualitative Navigator (version B.10.00) and Agilent Mass Hunter Data Acquisition (version 10.1) programs produced by Agilent Technologies (Santa Clara, CA, United States) were used to acquire the spectra and process the recorded data.
2.4 Gas chromatography–mass spectrometry analysis (GC-MS)The SSE was further extracted by chloroform to obtain the volatile fraction. The GC-MS analysis was carried out with the use of a Shimadzu GC-2010 Plus gas chromatograph, coupled with a QP 2010 Ultra mass detector. Volatile metabolites were separated on a ZB-5MS capillary column (Phenomenex) with a silica film thickness of 0.25 µm, column length of 30 m, and internal diameter of 0.25 mm. The initial oven temperature was 50°C, with a 3 min holding time, and then increased to 250°C at 5°C/min, and held for 15 min at 250°C. An injection temperature of 280°C was maintained, and helium (1 mL/min) was used as a carrier gas. The QP 2010 Ultra mass spectrometer worked in the electron ionization (EI) mode. Ionization energy was 70 eV, the scan rate was 0.2 s/scan, and the scan range was 40–500 amu. The temperature of the ion trap was 220°C, while the injection and interface temperature was 250°C. The injection volume was 1 µL. The sample was dosed in split mode (1:20). The retention indices (RI) of the volatile metabolites present in the chromatograms were calculated concerning the homologous series of n-alkanes (C6–C30). The identification of metabolites was made using computer spectral libraries (MassFinder 2.1, NIST 2011) as well as available literature data.
2.5 Anthelminthic activity–examination methodThe extract was tested for its anthelmintic activity using a model of nematodes of the Rhabditis genus in accordance with a previously patented research procedure; patent number PL232918 (Bogucka-Kocka and Kołodziej, 2019). The extract was added to the nematode culture in five selected concentrations: 0.2 mg/mL, 1.1 mg/mL, 3.3 mg/mL, 5.5 mg/mL, 11.1 mg/mL. After a 24-h exposure of nematodes of the genus Rhabditis to the tested extract, their viability was assessed according to the previously described procedure (Dziduch et al., 2020; Bogucka-Kocka et al., 2022; Kołodziej et al., 2023). The control (CTRL NaCl) was a culture of nematodes suspended in 0.6% NaCl only. The experiment was conducted in five biological replicates. Each biological replicate was carried out in three technical replicates. Statistical analysis was performed using GraphPad v8.2.0 software using ANOVA.
2.6 Antibacterial and antifungal activity2.6.1 Microbroth dilution methodThe MIC (minimum inhibitory concentration) of SSE was evaluated with the use of the microbroth dilution method. Briefly, SSE was two-fold diluted in sterile Mueller-Hinton Broth (MHB; Biorad, Hercules, CA, United States) in a 96-well microtiter plate (NUNC, Rochester, New York, United States) to obtain a concentration ranging from 16 to 0.0156 mg/mL. Then, a microbial suspension of a density of 0.5 MacFarland was 100-fold diluted in MHB and 2 µL was added to each well. The assay included positive and negative control, i.e., a well with microorganisms growing without the tested compound and sterile MHB only, respectively. The adequate viability of reference microorganisms was confirmed by plating the liquid culture followed by a colony count with macroscopic characteristics. The plates were incubated at 35°C ± 2°C for 18–24 h (Heraeus B6, Germany) and MIC values were red spectrophotometrically based on the absorbance measured at 600 nm wavelength (EL80, BioTek Instruments, VT, United States). Then, to establish the MBC (minimum bactericidal concentration), 5 µL from each well was plated on Mueller-Hinton Agar (MHA; Biorad, Hercules, CA, United States) and incubated for another 16–20 h.
First, the antimicrobial activity of SSE was determined against a basic panel of reference microorganisms: bacteria Staphylococcus aureus ATCC 29213, Escherichia coli ATCC 25922, Pseudomonas aeruginosa ATCC 27853 and yeast Candida albicans ATCC 10231. Then, based on the initial results the microbial spectrum was expanded by adding the following Gram-positive bacteria: Staphylococcus aureus ATCC BAA-1707, Staphylococcus epidermidis ATCC 12228, Bacillus cereus ATCC 10876, Enterococcus faecium ATCC 19434, E. faecalis ATCC 51299 and E. faecalis ATCC 29212. Among the tested reference strains, S. aureus ATCC BAA-1707 possessed an acquired type of resistance to β-lactam antibiotics (MRSA–methicillin-resistant S. aureus) and E. faecalis ATCC 51299 exhibited resistance to glycopeptides (VRE–vancomycin-resistant Enterococcus). Internal controls included reference antimicrobials, such as vancomycin, ciprofloxacin and nystatin. The MIC values for ciprofloxacin against S. aureus ATCC BAA-1707, S. epidermidis ATCC 12228, B. cereus ATCC 10876, E. coli ATCC 25922 and P. aeruginosa ATCC 27853 were 0.48, 0.12, 0.06, 0.004 and 0.48 μg/mL, respectively. For E. faecalis ATCC 29212, E. faecalis ATCC 51299 and E. faecium ATCC 19434, the MIC of vancomycin was equal to 1.96, 32 and 0.98 μg/mL, respectively, while the MIC of nystatin against C. albicans ATCC 10231 was 0.48 μg/mL. All bacterial reference strains used in this study were cultured on MHA or MHB while C. albicans was cultured with the use of the same microbiological media but with 2% addition of glucose. The experiment was carried out in triplicate and the results were presented as mode.
2.6.2 Time-kill assayTime-kill assay was conducted to determine the mode of action of SSE against a microorganism with the lowest MIC value–Bacillus cereus ATCC 10876. First, a 0.5 McFarland B. cereus suspension was diluted 100 times and 5 mL was placed in the sterile tubes. The extract was added to the tubes to obtain a subinhibitory concentration (0.25 mg/mL), minimal inhibitory concentration (0.5 mg/mL) and a concentration exceeding MIC four times (2 mg/mL). These tubes along with a control tube (bacterial suspension without the tested extract) were incubated at 35°C for 24 h with shaking at 250 rpm (Innova 40R, New Brunswick, Germany). The number of colony forming units in 1 mL of suspension (CFU/mL) was determined by plating 100 µL of decimal dilutions on MHA followed by incubation at 35°C for 16–18 h. The enumeration was performed in eight time points: directly after the preparation of bacterial suspension as well as after 1, 3, 6, 12, and 24 h of incubation. The experiment was carried out in triplicate and the results were presented as the mean with standard deviation of a log10 of CFU/mL. Bactericidal activity of the extract was defined as the reduction of bacterial load equal to or greater than 3 log10 CFU/mL in comparison to the untreated control, while bacteriostatic activity was defined when the reduction was lower than 3 log10 CFU/mL. Microbiological data were analyzed with the use of Graph Pad Prism (V. 6.0; Graph Pad Software Inc., San Diego, CA, United States). Time-kill assay results were presented as graph curves, while the statistical analysis of AUC (area under the curve) was conducted with the use of one-way ANOVA followed by Dunnett’s post hoc test.
2.6.3 Spore germination inhibition assaySpores of B. cereus ATCC 10876 were prepared according to previously published protocol (Rukayadi et al., 2009), with minor modification. First, a single B. cereus colony was streaked on MHA and incubated at 30°C for 14 days to induce spore formation. Then, the culture was suspended in sterile 0.85% NaCl, and after thorough vortexing, divided into 1 mL portions in the 1.5 mL tubes. The tubes were incubated at 60°C for 30 min to kill B. cereus vegetative cells. Then, the tubes were centrifuged at 13,000 rpm for 30 min at 4°C followed by washing with 1 mL of sterile 0.85% NaCl. The supernatant was discarded and the pellet was suspended in 1 mL of 0.85% NaCl. The centrifugation and washing steps were repeated four times. The spores were counted by preparing decimal solutions and plating using the spread-plate technique. The quality of the process was assessed by staining the spore suspension with the use of the Schaeffer-Fulton endospore staining method. Spores were stored at −70°C for further analysis.
2.7 CytotoxicityThe microculture tetrazolium assay (MTT) used to evaluate the viability of the SSE against normal cells was performed as previously described (Świątek et al., 2023). Briefly, the monolayer of selected cells in 96-well plates was incubated with serial dilutions (2–0.001 mg/mL) of SSE in cell media for 24–72 h. Afterward, cell media were removed, cells were washed with PBS, MTT-supplemented medium was added, and incubation continued for 3 h. The precipitated formazan crystals were dissolved using SDS/DMF/PBS solvent, and absorbance was measured (540 and 620 nm) using Synergy H1 Multi-Mode Microplate Reader (BioTek Instruments, Inc. Winooski, Vermont, United States) with Gen5 software (ver. 3.09.07; BioTek Instruments, Inc.). Data were exported to GraphPad Prism (version 7.04, GraphPad Software, Inc., La Jolla, CA, United States) to calculate CC50 and/or CC10, i.e., the concentration of the SSE, which caused a 50% and 10% decrease in cell activity compared to the control (cells not treated with the extract). Values were presented as mean ± SD obtained from three replicates.
The cytotoxicity of the SSE by the MTT method was determined for the following normal cell lines: MRC-5 (human embryonic lung fibroblasts; ATCC, CCL-171) as well as VERO (monkey kidney epithelial cells; ATCC, CCL-81).
2.8 Antiviral activityAntiviral activity was tested against Human Coronavirus 229E (HCoV-229E; ATCC, VR-740) propagated in MRC-5 and against Human Herpesvirus type 1 (HHV-1, ATCC, VR-260) propagated in VERO. Cell lines were cultured using Modified Eagle Medium (MEM; Corning, Tewksbury, MA, United States) supplemented with antibiotics (Penicillin-Streptomycin Solution, Corning) and fetal bovine serum (FBS, Corning)–10% (cell passaging) and 2% (cell maintenance and experiments). Phosphate buffered saline (PBS) and trypsin were bought from Corning, whereas MTT (3-(4,5-dimethylthiazol-2-yl)-2,5-diphenyltetrazolium bromide) and DMSO (dimethyl sulfoxide) from Sigma (Sigma-Aldrich, St. Louis, MO, United States). Incubation was carried out in a 5% CO2 atmosphere at 37°C (CO2 incubator, Panasonic Healthcare Co., Tokyo, Japan). Ribavirin, a standard antiviral substance, was acquired from Sigma. The SSE stock solution was prepared by dissolving in cell culture grade DMSO (PanReac Applichem). The stock solution of SSE was stored at 8°C until used.
To evaluate the antiviral potential, the selected cells (MRC-5 or VERO) were seeded into a 48-well plate and incubated overnight. Then, the cells were infected with HCoV-229E or HHV-1 in 100-fold CCID50/mL (CCID50–50% cell culture infectious dose), leaving at least two wells with non-infected cells (cell control), and incubated for 1 h. Then, the cells were washed with PBS and SSE in non-cytotoxic concentration was added and incubated until CPE (cytopathic effect) was observed in the virus control (virus-infected, non-treated cells). The plates were observed using an inverted microscope (CKX41, Olympus Corporation, Tokyo, Japan) and frozen (−76°C). After thawing, the samples collected from anti-HCoV-229E assays were subjected to RNA isolation (QIAamp Viral RNA Mini Kit, Cat.: 52904 QIAGEN GmbH, Hilden, Germany) while DNA was isolated (QIAamp DNA Mini Kit, Cat.: 51304 QIAGEN GmbH) from samples collected during anti-HHV-1 tests. Subsequently, the RNA isolates were subjected to one-step RT-qPCR (reverse transcription-quantitative polymerase chain reaction) amplification using iTaq Universal SYBR Green One-Step Kit (Cat.: 1725150, Bio-Rad Laboratories, Life Science Group, Hercules, CA, United States) and primers 229E-F (5′-CATACTATCAACCCATTCAACAAG-3′), and 229E-R 5′-CACGGCAACTGTCATGTATT-3′) on the CFX96 thermal cycler (Bio-Rad Laboratories). The RT-qPCR parameters amplification were as follows: reverse transcription reaction (50°C, 10 min), polymerase activation (95°C, 1 min), cycling (40 repeats: denaturation (95°C, 10 s), annealing and synthesis (65°C, 30 s), fluorescence acquisition), and melting curve analysis (65°C–95°C, 0.5°C increment/5 s). The DNA isolates were subjected to qPCR amplification using SsoAdvanced Universal SYBR Green Supermix (Bio-Rad Laboratories) and primers (UL54F–5′CGCCAAGAAAATTTCATCGAG 3′, UL54R–5′ ACATCTTGCACCACGCCAG 3′) on the CFX96 thermal cycler. The amplification procedure was as follows: initial polymerase activation (98°C, 3 min); cycling (40 repeats: DNA denaturation (95°C, 10 s), annealing and synthesis (60°C, 30 s), fluorescence acquisition); melting curve analysis (65°C–95°C). The HCoV-229E and HHV-1 viral loads in the tested samples were assessed in relation to virus control based on the relative quantity (ΔCq) method using CFX Manager™ Dx Software (Bio-Rad Laboratories). To evaluate the sensitivity of RT-qPCR and qPCR, dilutions (10, 100, and 1000-fold) of virus RNA isolate (HCoV-229E) or DNA isolate (HHV-1), respectively, were prepared and analysed.
2.9 Anticancer activityThe MTT assay (described in detail above) was used to examine the anticancer activity of the SSE against FaDu (human hypopharyngeal cancer; ATCC, HTB-43), H1HeLa (human cervical adenocarcinoma; ATCC, CRL-1958), and RKO (human colon cancer; ATCC, CRL-2577) cell lines as well as against two human malignant melanoma cell lines: A-375 (ATCC, CRL-1619) and G361 (ATCC, CRL-1424). Cell line A-375 was cultured in Dulbecco’s modified Eagle’s medium (DMEM; Corning, New York City). The G361 cell line was cultured in McCoy′s 5A Medium (Corning, New York City). All culture media were supplemented with 10% heat-inactivated FBS (PAN-Biotech, Aidenbach, Germany) and antibiotics: 100 U/mL penicillin, 100 μg/mL streptomycin and 0.25 μg/mL amphotericin B (Sigma-Aldrich, St. Louis, MO, United States). Cell culture was maintained at 37°C in a humidified atmosphere of 5% CO2.
3 Results3.1 Compositional studies of the Stachys sylvatica L. extractThe content of selected polyphenols in SSE is presented in Table 1. RP-HPLC/PDA analysis showed that the major metabolite identified in SSE was chlorogenic acid (1.59 mg/g dry extract). Quantitative analysis also revealed a relatively high concentration of luteolin derivatives (0.43–0.66 mg/g dry extract), followed by multiple chlorogenic acid isomers (0.13–0.32 mg/g dry extract) and verbascoside (0.28 mg/g dry extract). Moreover, a lower concentration of p-OH benzoic acid and caffeic acid (0.11 and 0.06 mg/g dry extract, respectively) was found. Chromatograms obtained with the use of RP-HPLC/PDA are presented in Supplementary Figure S1.
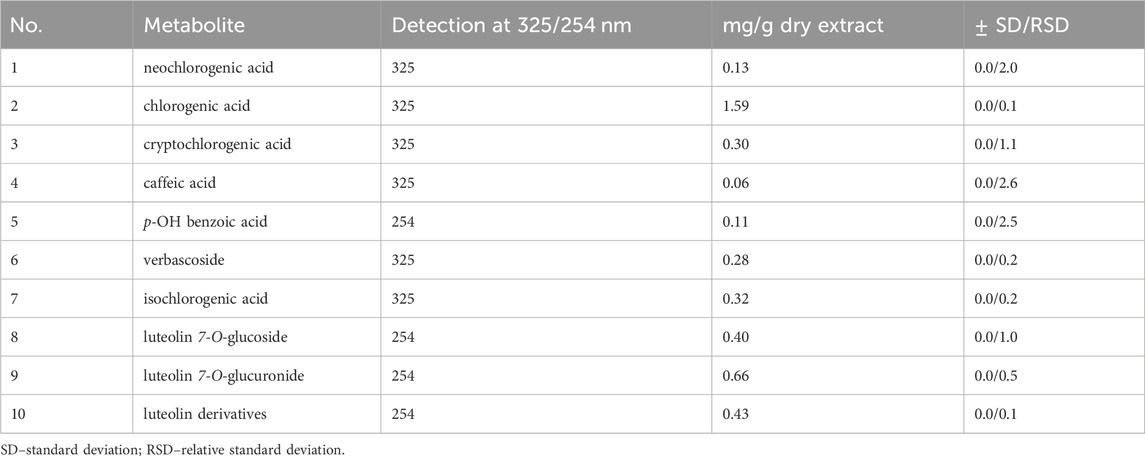
Table 1. The content of selected polyphenols in Stachys sylvatica L. hydroethanolic extract obtained by ultrasonic-assisted extraction.
The applied high performance liquid chromatography coupled with mass spectrometry based detection of small molecules in the SSE led to the identification of 17 metabolites based on their high accuracy mass measurement, their MS/MS spectra (see Supplementary Table S1), retention times and the currently available scientific literature. According to the SSE fingerprinting, the main metabolites were phenolic acids, namely, chlorogenic acid and its isomers–cryptochlorogenic and neochlorogenic acid, phenolic metabolites such as flavonoids and their glycosides. The analysis also detected phenylpropanoids, e.g., verbascoside and its derivatives and verbasoside (decaffeoyl verbascoside) or harpagide belonging to iridoids (Figure 1; Table 2).
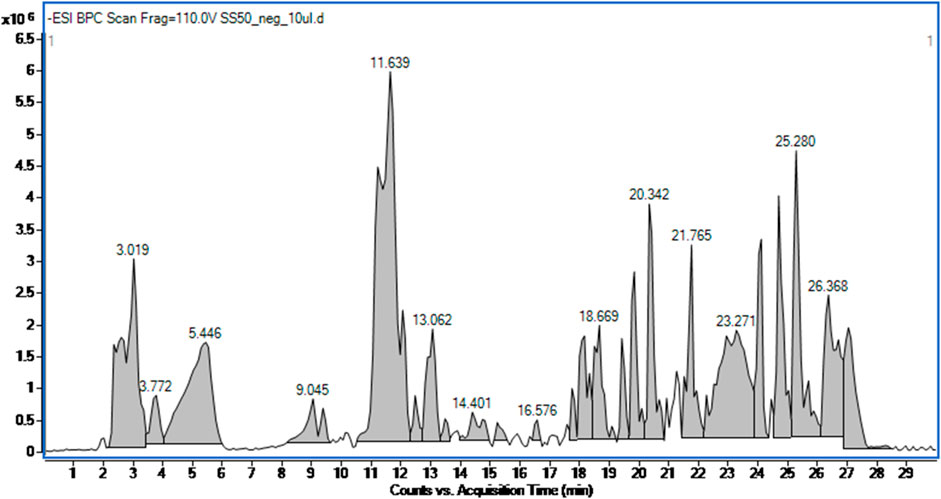
Figure 1. Total ion chromatogram of the Stachys sylvatica L. hydroethanolic extract obtained by ultrasonic-assisted extraction.
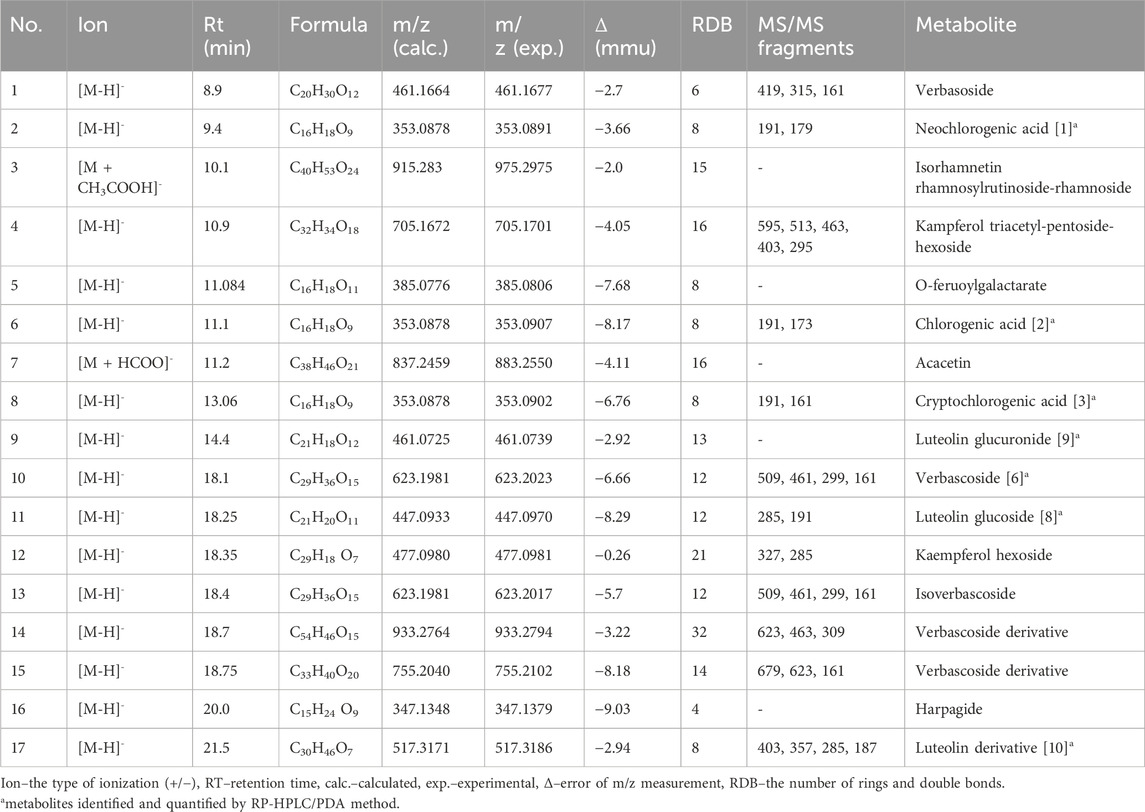
Table 2. The list of HPLC-ESI-QTOF-MS/MS tentatively identified metabolites in the Stachys sylvatica L. hydroethanolic extract obtained by ultrasonic-assisted extraction.
GC-MS analysis of the volatile metabolites showed mainly the presence of diterpenoids and fatty acids esters (Table 3). The most characteristic metabolites identified were fatty acid esters, however, the major was squalene, a linear triterpene synthesized by many plants as a biochemical precursor in the process of plant sterols biosynthesis. The relative percentage of this metabolite in the volatile fraction was almost 43%. The total ion chromatogram of the SSE and mass spectra of two unidentified diterpenoids are available in Supplementary Figures S2-S4.
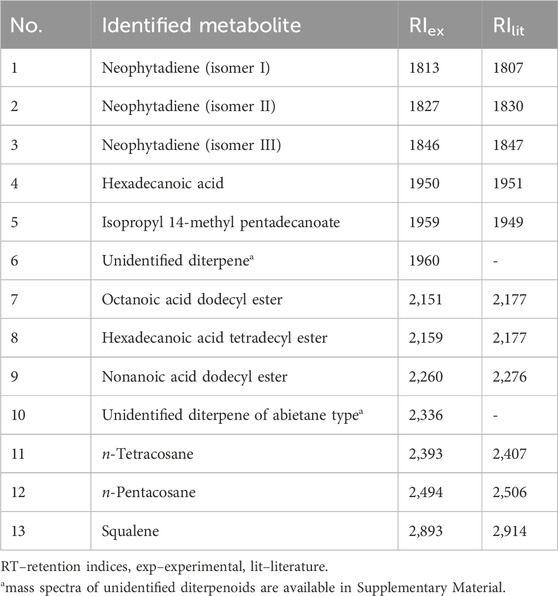
Table 3. Volatile metabolites identified in Stachys sylvatica L. hydroethanolic extract obtained by ultrasonic-assisted extraction.
3.2 Anthelminthic activity of the Stachys sylvatica L. extractThe anthelmintic activity of SSE was tested using nematodes of the genus Rhabditis. These nematodes belong to free-living organisms, but literature data indicate that they are also pathogenic organisms that can parasitize both humans and animals (Duarte et al., 2001; Teschner et al., 2014; Fadaei et al., 2019; Kołodziej et al., 2023). The experiments showed that the tested extract exhibited anthelmintic activity (Figure 2). At the tested concentrations, nematode viability was as follows: 84.21% for the concentration of 0.2 mg/mL, 82.08% for the concentration of 1.1 mg/mL, 72.88% for the concentration of 3.3 mg/mL, 65.84% for the concentration of 5.5 mg/mL and 56.76% for the concentration 11.1 mg/mL. Analysis showed that a significant reduction in Rhabditis sp. viability was obtained for the SSE concentration of 3.3 mg/mL or higher when compared to the control. The tested SSE showed anthelmintic activity comparable to that of albendazole in a concentration of 11.1 mg/mL (Ziaja-Sołtys et al., 2022); no statistically significant difference was demonstrated between reference drug vs. extract. Figure 3 presents exemplary photographs of nematodes used in this study. Upper part (A) shows Rhabditis sp. control culture in 0.6% NaCl, where the nematodes are alive and moving, while the lower part (B) shows the influence of SSE on their viability–non-moving and dead nematodes are marked with an arrow. Despite inhibition of nematodes viability at certain SSE concentrations, further research in this area is needed, among other things, to learn the mechanisms of action of the tested extract.
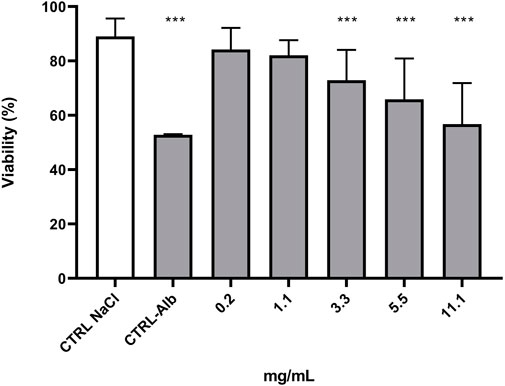
Figure 2. Viability (%) of Rhabditis sp. nematode cultures after 24 h of exposure to increasing concentrations of the Stachys sylvatica L. extract obtained by ultrasonic-assisted extraction. CTRL NaCl—control, CTRL-Alb (11.1 mg/mL)—positive control.
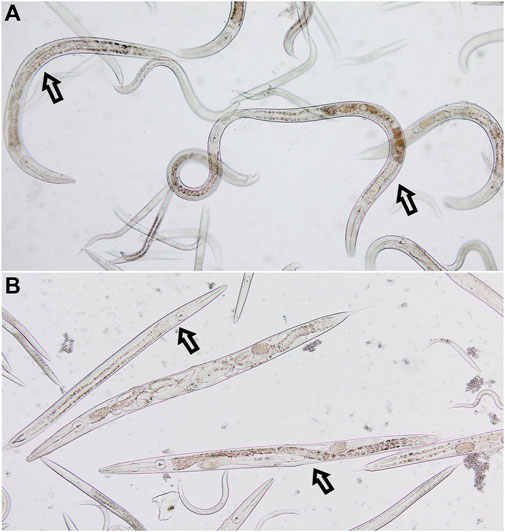
Figure 3. The culture of nematodes of the genus Rhabditis. (A) Control culture in 0.6% NaCl; (B) Culture after 24 h of exposure to the Stachys sylvatica L. extract obtained by ultrasonic-assisted extraction.
3.3 Antibacterial and antifungal activity of the Stachys sylvatica L. extractThe antimicrobial activity of SSE was tested against a basic panel of four microorganisms as well as additional six Gram-positive bacteria based on the initial results (Table 4). The microbroth dilution method showed that the antimicrobial activity was higher for Gram-positive bacteria than other tested microorganisms, i.e., Gram-negative rods as well as yeast, where in all cases the minimal inhibitory concentration was equal to 8 mg/mL. Among Gram-positive bacteria included in the study, the MIC range was from 0.5 to 2 mg/mL. In the case of S. aureus reference strains, the antimicrobial activity was slightly lower for the MRSA strain (methicillin-resistant S. aureus ATCC BAA-1707) with MIC equal to 2 mg/mL when compared with strain without an acquired type of resistance to β-lactam antibiotics. The opposite situation was observed in Enterococcus genus, where the VRE (vancomycin-resistant E. faecalis ATCC 51299) strain was characterized by a lower MIC value than susceptible strains (1 mg/mL vs. 2 mg/mL). The highest antibacterial activity was observed for Bacillus cereus ATCC 10876–an aerobic and spore-forming bacteria, where the MIC and MBC were equal to 0.5 mg/mL, which suggested its bactericidal mode of antimicrobial action.
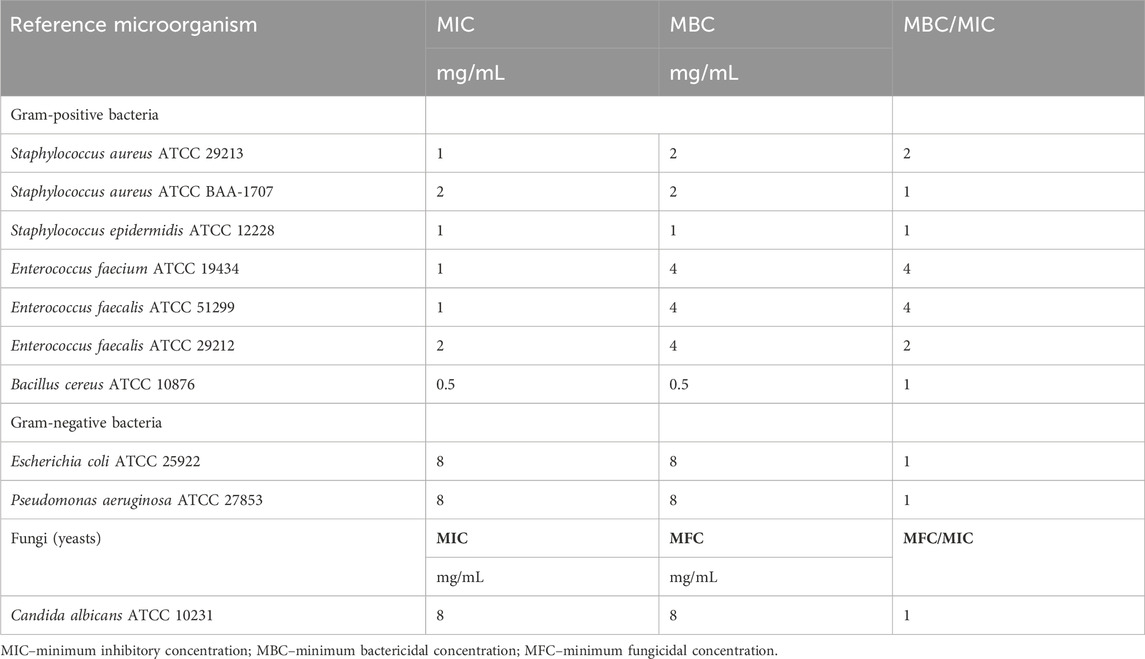
Table 4. Antimicrobial activity of Stachys sylvatica L. hydroethanolic extract obtained by ultrasonic-assisted extraction.
Based on the results of the microbroth dilution method, B. cereus ATCC 10876 was chosen as the test microorganism for the time-kill assay, where it was incubated in the presence of three concentrations of SSE (0.5×MIC, 1×MIC and 4×MIC) and enumerated in certain time-points (Figure 4A). For the subinhibitory concentration of SSE (0.5×MIC; 0.25 mg/mL), minor growth inhibition of B. cereus cells was observed only after 1 h of incubation, which was then followed by a gradual rise in the number of viable cells comparable to that in the growth control. In the case of higher extract concentration equal to MIC–0.5 mg/mL–the number of viable B. cereus cells decreased after 1 h, remained relatively stable up to 6 h and then gradually raised reaching a comparable value at 24 h time point as in the growth control, testifying about the bacteriostatic mode of action of the tested extract. Only in the case of the highest applied extract concentration (2 mg/mL), there was a clear reduction of the number of viable cells starting from just 1 h after incubation up to 6 h of the experiment, where no growth was visible after plating. Then, after 6 h of incubation, the bacteria started to grow, resulting in the final reduction of bacterial load after 24 h equal to 3.3 log10 CFU/mL.
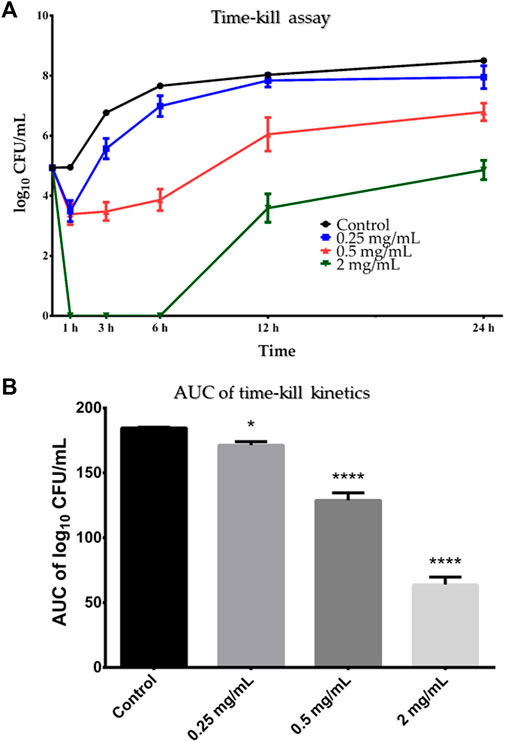
Figure 4. (A) Time-kill curve of Stachys sylvatica L. hydroethanolic extract obtained by ultrasonic-assisted extraction against Bacillus cereus ATCC 10876. A log10 of CFU/mL of Bacillus cereus ATCC 10876 at various time points in the presence of the S. sylvatica L. extract in concentration 0.25, 0.5 and 2 mg/mL in comparison to the growth control (without the inhibition agent). Values are expressed as mean ± standard deviation from three replicates. (B) AUC time-kill kinetics of S. sylvatica L. hydroethanolic extract against B. cereus ATCC 10876. Values are presented as mean ± standard deviation from three replicates. *p < 0.05; ****p < 0.0001 compared to the control. AUC–area under the curve.
Statistical analysis of AUC showed that SSE acted on B. cereus in a dose-dependent manner (Figure 4B). Despite that all tested concentrations significantly reduced the number of viable cells of B. cereus ATCC 10876 in comparison to growth control, two higher concentrations–0.5 and 2 mg/mL–acted more effectively (p = 0.0001) than the subinhibitory concentration–0.25 mg/mL (p = 0.014).
The Bacillus genus is well known for its ability to produce spores–bacterial forms able to persist in unfavourable environmental conditions, often more resistant to tested compounds than vegetative cells. Therefore to determine whether SSE exhibits similar properties against spores as against vegetative cells of B. cereus ATCC 10876 we studied its sporicidal activity. The analysis showed that the minimum inhibitory concentration against spores was equal to 1 mg/mL, however, the minimum sporicidal concentration exceeded 16 mg/mL.
3.4 Cytotoxicity and antiviral activity of the Stachys sylvatica L. extractBased on the 50% cytotoxic concentration (CC50) of the SSE, the cytotoxicity was classified as high (CC50 < 0.02 mg/mL), moderate (CC50: 0.021–0.2 mg/mL), weak (CC50: 0.21–0.5 mg/mL) or none (CC50 > 0.5 mg/mL), based on previously published literature (Geran, 1972; Łaska et al., 2019).
The cytotoxicity was determined towards two normal cell lines, namely, VERO (monkey kidney epithelial cells) and MRC-5 (human embryonic lung fibroblasts). After 72 h of incubation, the SSE showed moderate cytotoxicity towards MRC-5 with CC50 of 0.0891 ± 0.014 mg/mL and was not cytotoxic to VERO (CC50 of 0.810 ± 0.013 mg/mL).
Based on the dose-response curves presented in Figure 5A and Figure 6A, the maximum non-toxic concentrations used in antiviral studies were estimated to be 0.032 mg/mL in MRC-5 and 0.5 mg/mL in VERO: In these non-toxic concentrations no cytopathic effects were observed in MRC-5 (Figures 5C, D) and in VERO (Figures 6C, D). The incubation of HCoV-229E-infected MRC-5 with SSE 0.032 mg/mL (Figure 5E) did not reduce the formation of CPE when compared with the virus control (Figure 5B). Ribavirin, a broad-spectrum antiviral, managed to noticeably reduce the formation of CPE (Figure 5F). Subsequent RT-qPCR analysis showed (Figure 7A) that despite the lack of influence on CPE formation, the SSE 0.032 mg/mL managed to reduce the viral load of HCoV-229E by 1.56 log, compared to the virus control. The antiviral effect showed a dose-response effect, and SSE at 0.016 mg/mL reduced the HCoV-229E viral load by 1.08 log. Interestingly, the ribavirin showed a reduction of only 1.21 log. Thus, the SSE showed low antiviral activity against HCoV-229E replicating in MRC-5, but comparable to ribavirin.
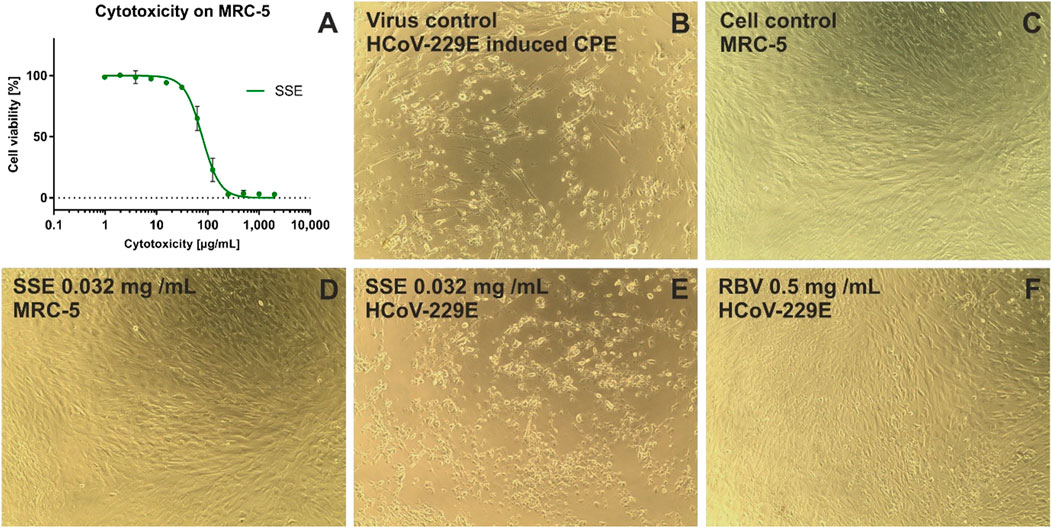
Figure 5. The cytotoxicity against MRC-5 and antiviral activity against HCoV-229E of Stachys sylvatica L. hydroethanolic extract obtained by ultrasonic-assisted extraction. (A) dose-response influence of SSE on MRC-5; (B) HCoV-229E induced cytopathic effect, virus control; (C) non-infected MRC-5 cells, cell control; (D) influence of SSE 0.032 mg/mL on MRC-5; (E) influence of SSE 0.032 mg/mL on HCoV-229E-infected MRC-5; (F) influence of ribavirin (RBV) 0.5 mg/mL on HCoV-229E-infected MRC-5.
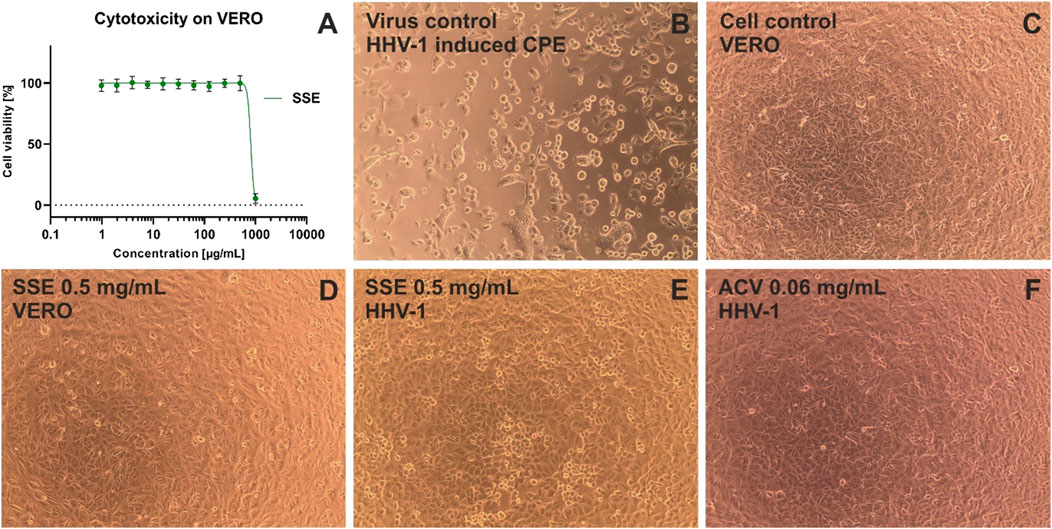
Figure 6. The cytotoxicity against VERO and antiviral activity against HHV-1 of Stachys sylvatica L. hydroethanolic extract obtained by ultrasonic-assisted extraction. (A) dose-response influence of SSE on VERO; (B) HHV-1 induced cytopathic effect, virus control; (C) non-infected VERO, cell control; (D) influence of SSE 0.5 mg/mL on VERO; (E) influence of SSE 0.5 mg/mL on HHV-1-infected VERO; (F) influence of acyclovir (ACV) 0.06 mg/mL on HHV-1-infected VERO.
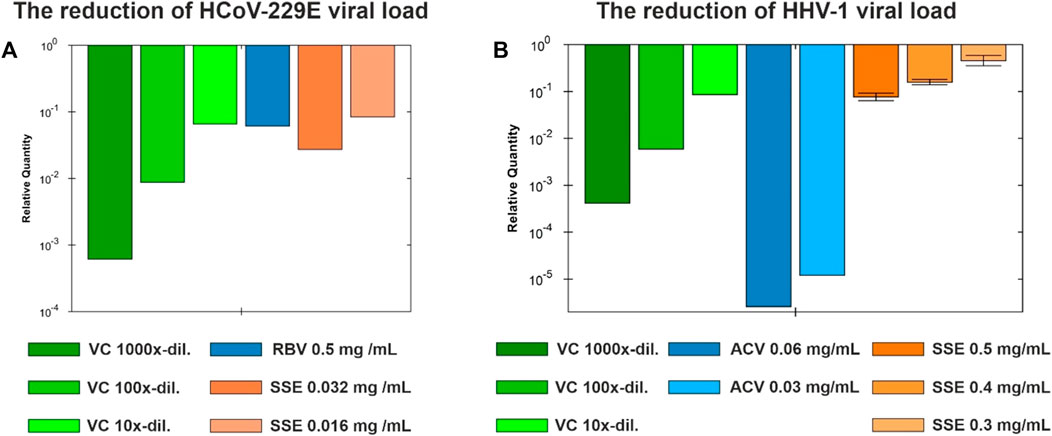
Figure 7. The viral load reduction under the influence of Stachys sylvatica L. hydroethanolic extract obtained by ultrasonic ultrasonic-assisted extraction. (A) The reduction of HCoV-229E viral load in MRC-5; (B) The reduction of HHV-1 viral load in VERO.
Interestingly, the incubation of HHV-1-infected VERO with SSE (0.5 mg/mL) (Figure 6E) noticeably reduced the formation of CPE when compared with the virus control (Figure 6B). The effect was dose-dependent, and at lower concentrations of SSE (0.3 and 0.4 mg/mL), the inhibition of CPE was less profound (data not shown). Following the qPCR analysis (Figure 7B), it was found that the SSE in the concentrations of 0.3, 0.4, and 0.5 mg/mL reduced the HHV-1 viral load by 0.34, 0.8, and 1.11 log, respectively. Acyclovir, a reference antiviral drug against HHV-1, at concentrations of 0.03 and 0.06 mg/mL, prevented the development of CPE in virus-infected VERO (Figure 6F) and reduced HHV-1 viral load by 4.92 and 5.59 log, respectively (Figure 7B). Thus, the SSE showed good protection against the cytopathic effect induced by HHV-1.
3.5 Anticancer activityPreliminary evaluation of anticancer activity showed that the SSE exerted concentration- and time-dependent effect. This extract was moderately cytotoxic after 72 h incubation towards human cervical adenocarcinoma (H1HeLa) cells (CC50 of 0.0127 mg/mL), and weakly cytotoxic (0.21 < CC50 < 0.5 mg/mL) to human hypopharyngeal cancer (FaDu) and human colon cancer (RKO) cells (Table 5). After 24 h extract showed weak cytotoxicity on FaDu and H1HeLa and no cytotoxic effect (CC50 > 0.5 mg/mL) on RKO. After 24 h of incubation, the SSE exhibited weak cytotoxicity or no cytotoxicity against human melanoma cells, G361 and A375, respectively.
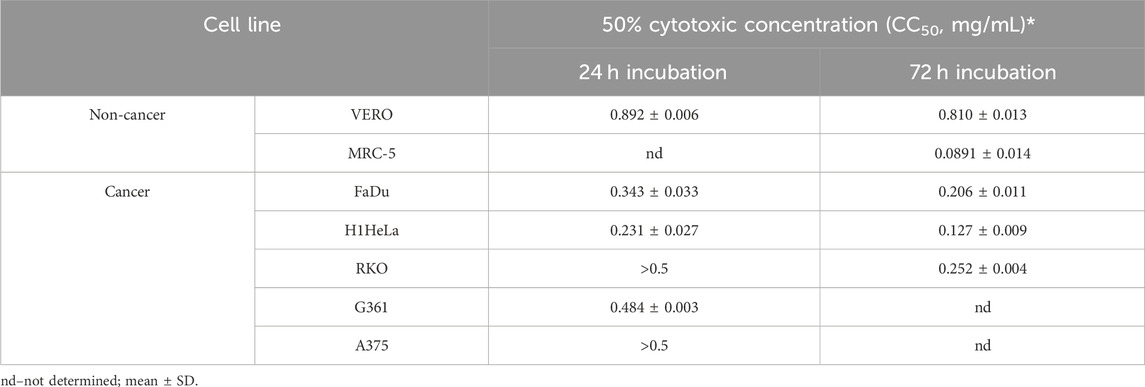
Table 5. The cytotoxicity of Stachys sylvatica L. hydroethanolic extract obtained by ultrasonic assisted extraction against normal and cancer cells.
4 DiscussionBased on the scientific literature data the genus Stachys L. can be perceived as a promising one with a high load of secondary metabolites of different types with proven pharmacological properties. As shown by the recent studies focusing on the phytochemical composition of Stachys L. genus, there is a noticeable heterogeneity of obtained results, depending on various factors such as geographical region, collection season and part of plant (Tomou et al., 2020). Nevertheless, studies have shown that flavonoids, iridoids, fatty acids and phenolic acids constitute the main plant metabolites present in extracts prepared from Stachys spp. (Tundis et al., 2014). Although several plant species belonging to this genus have been broadly studied (Tomou et al., 2020), there are only some phytochemical and biological/pharmacological investigations concerning S. sylvatica L. Data included in this paper presents for the first time the chemical composition and bioactivity of the hydroethanolic extract (50% v/v) obtained by ultrasonication from the flowering aerial parts of S. sylvatica L. collected in Almaty region (Southern Kazakhstan).
Previously other authors showed the presence of a rich variety of metabolites in Stachys sylvatica L. extracts. The chloroform, chloroform-methanol and methanolic extracts prepared from aerial parts of S. sylvatica L. collected in Tuscan-Emilian Apenine (Italy) were investigated, followed by the identification of 23 metabolites belonging to the phenolic derivatives, glycosylated aliphatic alcohols, glycosylated phenylpropanoids, flavonoids, lignans, ionones and carboxylic acids (Di Stasi et al., 2023). In other studies concerning S. sylvatica L. growing in Romania the hydromethanolic extracts (80% v/v) obtained from flowers, leaves and stems were analyzed separately. These extracts were rich in phenolic metabolites, including chlorogenic acid. The content of polyphenols in flowers, leaves and stems differed greatly, being 2119.69, 333.25 and 113.38 μg/g, respectively (Apostolescu et al., 2023; Di Stasi et al., 2023).
Our study showed that chlorogenic acid is the main metabolite in SSE (1.59 mg/g dry extract), which is consistent with other studies investigating different species belonging to the genus Stachys L, namely, S. byzantina, S. inflata, S. lavandulifolia, S. annua and S. tmolea. (Elfalleh et al., 2019; Bahadori et al., 2020; Bursal et al., 2020). For instance, this phenolic acid was found to be the dominant metabolite in the hydroethanolic extract (70% v/v) from aerial parts of S. sylvatica L. growing in Romania, where its concentration was 5.55 mg/g dry extract. The SSE was also found to contain high amounts of luteolin derivatives (1.49 mg/g dry extract), including luteolin 7-O-glucoside and luteolin 7-O-glucuronide (Benedec et al., 2023). According to the review of Tomou et al., this flavone and its derivatives were reported to be identified in aerial parts or leaves of several Stachys species, e.g., S. aegyptiaca Pers., S. chrysantha Boiss. and Heldr., S. annua L. or various subspecies of S. wainsonii (Tomou et al., 2020). As presented elsewhere (Lachowicz-Wiśniewska et al., 2022), one of the major metabolite of S. palustris L. leaves collected in Poland were luteolin 6-C-galactoside (462.91 mg/100 g dry matter) and luteolin-6-C-glucoside (267.68 mg/100 g dry matter). The phenylethanoid glycosides, including verbascoside, were found to occur commonly in various Stachys L. species, both in aerial parts and roots. The verbascoside content in the SSE was calculated to be 0.28 mg/g dry extract. It is worth noting that the extract was also rich in verbasoside and harpagide belonging to iridoids, as well as in organic acids, alkaloids and terpenoids (Tundis et al., 2015; Tomou et al., 2020).
According to quantitative analysis, dominant metabolites in the SSE were chlorogenic acid (together with its derivatives), luteolin derivatives and verbascoside. The chemical profile obtained for the investigated SSE partially differs from other S. sylvatica L. extracts, where all investigated samples were derived from plants growing in Europe (Italy or Romania). Phenolcarboxylic acids, mostly chlorogenic acid, caffeic acid and rosmarinic acid, are often found metabolites in S. sylvatica L. (Apostolescu et al., 2023; Benedec et al., 2023; Di Stasi et al., 2023). While in our extract chlorogenic acid was found, no remaining two acids were identified. Additionally, quantitative analysis revealed that S. sylvatica L. collected in Kazakhstan is rich in numerous chlorogenic acid derivatives, e.g., isochlorogenic acid or cryptochlorogenic acid, rarely reported in samples collected in other parts of the world (Benedec et al., 2023; Di Stasi et al., 2023). However, it is worth mentioning that chlorogenic acid derivatives were reported in research including other Stachys species, e.g., isochlorogenic acid was found in S. officinalis L. (Vundać et al., 2005; Kanjevac et al., 2023), while neochlorogenic and cryptochlorogenic acids in S. palustris L. (Kartsev et al., 1994). Similarly, we detected multiple luteolin derivatives, which were not detected in other studies concerning S. sylvatica L. (Benedec et al., 2023; Di Stasi et al., 2023).
Many studies focus on the chemical composition of the essential oil prepared from S. sylvatica or the content of volatile metabolites. Similarly, as in the case of chemical composition from the extracts prepared from the aerial parts of the plant, the results on the chemical composition of essential oils vary. Our studies showed that the SSE volatile fraction is composed mainly of diterpenoids and fatty acid esters. The obtained results are confirmed in the literature. Genus Stachys is a rich source of diterpenes mainly belonging t
留言 (0)