
記住我


Epigenetic dysregulation has emerged as a pathologic driver of many diseases, including primary immune deficiencies (1–3). Kabuki syndrome type 1 (KS1) is an autosomal dominant, congenital, epigenetic disorder commonly associated with heterozygous loss-of-function variants in the lysine methyltransferase 2D gene, KMT2D (also known as MLL2/MLL4/ALR). KS1 has a complex phenotype, including disruption of craniofacial, skeletal, cardiac, cognitive, and immune development. KS1 is frequently associated with specific forms of immune dysfunction, including humoral immunodeficiency, autoimmunity, and lymphoproliferation, which contribute to the morbidity and mortality seen in individuals with KS1 (1, 3, 4). KS1-associated immune deficiency (KSAID) can be partially explained through the known role of KMT2D in B-cell survival/cell cycle regulation, differentiation, and peripheral tissue homing (5, 6). Specifically, KMT2D influences the expression of its target gene integrin beta 7 (ITGB7) and the ITGA4-ITGB7 integrin heterodimer (also known as lymphocyte Peyer’s Patch adhesion molecule-1 [LPAM1]) in mesenteric lymph node–derived lymphocytes and thus disrupts Peyer’s Patch size, quantity, and function (2). However, the contribution of T-cells to KSAID pathogenesis is currently not well understood. Recent studies suggest that KMT2D insufficiency in T-cells may be disruptive as researchers have identified KMT2D mutations in 20% of peripheral T-cell lymphomas-not otherwise specified (PTCL NOS), a disease with notable T-cell dysfunction tied to dysregulated expression of the cell cycle and adhesion genes (7, 8). Furthermore, dysregulated cell cycle/proliferation has been described across many KMT2D-deficient models systems, including neurons and cancer cells (9, 10). However, the contribution of T-cells to the KS1 immune deficiency phenotype has remained unclear. Recent studies in Kmt2d knockout (KO) (of exons 16–19) mice showed multiple T-cell abnormalities including significant drops in all peripheral T-cell subsets, a reduction in thymic CD4+ T regulatory cells, loss of the interferon gamma (IFNγ) silencer CNS-28, and disrupted post-stimulation-induced survival of peripheral CD8+ T-cells (11–13). Additionally, an immune phenotyping study of individuals with KS1 suggested decreased CD4+ memory cells (14); however, the use of appropriate reference ranges negated this finding (15). Recently, KMT2D’s role in long-range chromatin interactions and in modulation of the chromatin structure has become a focus (11, 13). However, the contribution of KMT2D across T-cell development and how KMT2D T-cell-specific haploinsufficiency (KS1) impacts peripheral T lymphocyte populations driving KSAID pathogenesis remain unaddressed. Further understanding of T-cell development and function in individuals with KS1 may improve care for all patients with immune deficiency and broaden our basic understanding of epigenetic regulation of T-cell development.
Here, we show that KMT2D directly regulates integrin expression, specifically Itgae, Itgal, Itgb2, and Itgb7, throughout the T-cell lineage, thus modulating T-cell maturation, activation, and localization. Additionally, KMT2D regulates the key thymic egress licensing transcription factor Klf2. In the periphery, we demonstrate that Kmt2d deficiency leads to changes in immune populations, such as memory skewing. Together, these data demonstrate that Kmt2d regulates integrins through T-cell-intrinsic epigenetic mechanisms and thus is a regulator of adaptive immunity.
MethodsPatient consent and sample collectionThe parents of the human subjects provided written consent for enrollment in this study (Cincinnati Children’s Hospital Medical Center [CCHMC] Institutional Review Board [IRB], protocol #2012-4636 and/or protocol #2020-0570). All KS1 cohort peripheral blood lymphocyte subpopulation analyses were performed in the CCHMC Diagnostic Immune Laboratory, and the collected data were compiled from a review of medical records. All clinical evaluations were performed at Clinical Laboratory Improvement Amendments (CLIA)–certified clinical laboratories and reported with the age-matched normal ranges. All 16 KS1 cohort patients underwent KMT2D sequencing (reference transcript: NM_003482). KMT2D domains were mapped according to UniProt Database (O14686). KMT2D mutations and type (frameshift, nonsense, missense, splice variants) associated with the individual’s recorded DNA mutation were generated via VarSome (https://varsome.com/) (16) for the Lolliplot (https://www.cbioportal.org/mutation_mapper) (17, 18). Lolliplots were manually altered in order to include additional variant information through color and shape. Values found within (closed) and outside (open) the reference range (2.5 – 97.5 percentile) are both displayed on the plots. The significance was determined using the binomial test, with the null hypothesis being that individuals with KS1 have the same probability of falling outside the reference range (2.5 - 97.5 percentile) equal to 5%, that is, the same as healthy age-matched individuals, and the P-value generated is listed on the graphs in Figure 6. The lower limit of normal (LLN) for assessment of cardiac surgery is calculated using the KS1 value divided by the lowest value (2.5 confidence value) of the reference range.
MiceMice were housed in accordance with NIH guidelines, and experimental protocols were approved by the Institutional Animal Care and Use Committee of CCHMC and Johns Hopkins University. Experimental observations of phenotypes were replicable at both institutions. The thymus, spleen, and/or blood were collected for flow cytometry and phenotyping analysis. Magnetic bead sorting was performed to isolate single-positive (SP) thymocytes or peripheral T-cell subsets for assessment of Cre recombinase efficiency and for RNA isolation, RNA-seq library preparation and sequencing. Kmt2d+/βgeo (also known as Mll2Gt(RRt024)Byg) mice (gene trap) were obtained from Bay Genomics (Berkeley, CA) and contain a powerful splice enhancer integrated in between exons prior to the SET domain. These mice show many features in common with patients with KS (19). Kmt2d+/βgeo animals were backcrossed onto a pure C57BL/6 background (verified by SNP array via Taconic Labs) and are maintained through breeding heterozygous carriers with fresh C57BL/6J (B6; Jackson Laboratories) as homozygous Kmt2dβgeo/βgeo mice are embryonic lethal.
Kmt2d-SET-fl/fl (also known as Mll4-SET-fl/fl mice), a kind gift from Dr. Kai Ge (NIH) that have been previously described (20, 21), were crossed with Cre recombinase (Cre) under various promoters. This mouse strain is not the same as the publicly available Kmt2d tm1.1Kaig/J (also known as Mll4fl/fl) mouse from Jackson Laboratories (Strain #032152), which we refer to in this document (referencing some prior Kmt2d literature (11–13) and scRNA analyses [GSE217656] as Kmt2d-exon16-19-fl/fl to differentiate it from Kmt2d-SET-fl/fl. Briefly, Kmt2d-SET-fl/fl mice harbor LoxP sites around Kmt2d exons 50 and 51 and disrupt the SET domain through a frameshift causing a stop codon at exon 52 upon exposure to Cre, which leads to a truncated protein (276 amino acid truncation at the carboxy-terminal end).
Conditional mice will sustain Kmt2d loss throughout thymocyte development and into the mature T lymphocytes in the periphery, thus allowing us to determine the role of Kmt2d in T-cell development. Vav1-iCre (a kind gift from Senad Dianovic, CCHMC, but can also be purchased from The Jackson Laboratory, Bar Harbor, USA; Strain #008610) turns on at the hematopoietic stem cell stage, whereas the two additional models used to conditionally delete T-cells, Lck-CreMar (The Jackson laboratory; Stain #003802) reportedly turns on around DN3 (22) and CD4-Cre (a kind gift from David Hildeman, CCHMC but can also be purchased from The Jackson laboratory; Strain #022071) turns on around DN4 (22) (see Supplementary Figure 1).
All mice used in these studies were adults (ranging 1 – 6 months old), with the majority of mice 2 – 3 months of age. All mutant mice used were evaluated against their same-sex littermate controls for age-/sex-related normalizing purposes. Mice were sacrificed via intraperitoneal injection of sodium pentobarbital (65 mg mL−1; 200 μL – 300 μL) after which the thymus, spleen, mesenteric lymph node, and/or blood were collected. Using a 3 mL syringe plunger (#309656; Becton Dickinson [BD], Franklin Lakes, USA), the organs were mashed through a T-cup strainer (#352350; Corning Inc., Glendale, USA) using 5 – 10 mL of 0.5% DNase I (DN25-1G; Sigma, St. Louis, USA) in complete RPMI 1640 (cRPMI; RPMI 1640 [#10-040-CV; Corning/Mediatech Inc., Manassas, USA] containing 10% heat inactivated fetal bovine serum [#16140-071; Invitrogen]). Peripheral blood was collected from live mice for analysis via submandibular phlebotomy into K2EDTA tubes (Microtainer, #365974; BD). Cells were collected and spun down at 500 g × 5 min. The 1 million cells collected from tissues or blood were strained and used for flow cytometric analyses or for recent thymic emigrant T-cell receptor excision circles assessment.
Flow cytometry analysisCells were spun down at 500 g for 5 min to pellet and resuspended in 5 mL of cRPMI. Cells were stained using a dilution of 1:400 of anti-mouse CD16/CD32 (Fc Shield, #70-0161-U100; Tonbo Biosciences, San Diego, USA) in cRPMI for 15 min, washed with cRPMI, spun down, and incubated with the following antibodies in cRPMI at 1:200 for 30 min: CD4-BV650 (#100469; BioLegend, San Diego, USA), CD8-BV605 (#100744; BioLegend), CD25-PE-Cy7 (#102016; BioLegend), CD44-AF488 (#103016; BioLegend), and additional panel antibodies (TCRβ, ITGAL, ITGAE, MHCI, CD69, CCR7, CD24) or the peripheral (splenic) antibody panel; see Supplementary Table 1 and Supplementary Figure 2 for antibody information and gating strategies, respectively. For analysis only, cells were washed with 1× DPBS (10× DPBS diluted with Millipore water 1:10; #14200-075; Thermo Fisher Scientific) twice then stained at 1:1,000 with Zombie UV Fixable Live/Dead (blue-fluorescent reactive dye #L23105A; Thermo Fisher Scientific) for 15 min at room temperature. Cells were washed, spun down, and fixed with either 4% diluted paraformaldehyde (#15710-S; Electron Microscopy Sciences, Hatfield, USA) or with Cytofix/Cytoperm (#554722; BD) for 20 – 30 min, washed with 1× DPBS, spun down, and stored in 1× DPBS or cRPMI until run on the LSRFortessa I flow cytometer (BD, maintained/run at CCHMC) or FACSVerse (BD, run at JHU). Flow cytometry files were analyzed using FlowJo (TreeStar LLC, now BD, Ashland USA).
Magnetic bead sortingCells were spun down at 500 g for 5 min to pellet and resuspended in 5 mL of cRPMI. Single cells were depleted of both CD4+ double-positive (DP) and CD4+ SP cells using a CD4+ (L3T4) positive selection kit (Microbeads; #130-117-043; Miltenyi Biotec, Gaithersburg, USA). The resulting flow-through contains both double-negative [DN] and CD8+SP cells. Next, the CD8a+ (Ly-2) positive selection kit was applied to the DN/CD8+SP containing flow-through to isolate CD8+SP thymocytes per manufacturer’s instructions (Microbeads, #130-117-044; Miltenyi Biotec). The second flow-through resulted in the DN population, whereas the magnetic elute resulted in the CD8+SP population. Conversely, CD4+SP isolation was used in the opposite microbead sequence (CD8 kit then CD4 kit). Briefly, both these kits used a 10 min incubation with either CD4+- or CD8+-specific microbeads followed by applying cells to the magnet-associated column, thereby capturing the CD4+ or CD8+ cells, relative to the antibody-microbead used. CD4+ and CD8+ peripheral T-cells require only one positive microbead kit for isolation.
Assessment of Cre recombination efficiencyRecombination of magnetic sorted thymocyte and peripheral cells (pool from the spleen and lymph nodes) and CD4+ and CD8+ cells (see Supplementary Figure 1 for Cre recombination activity documented in prior literature [Supplementary Figure 1A] and location of our designed primers and predicted outcomes [Supplementary Figure 1B; Supplementary Table 2]) was assessed by determining the expression or loss of the exon 50/SET domain through genomic DNA quantitative polymerase chain reaction (PCR). CD4+ and CD8+ cells were sorted through magnetic bead separation (see Magnetic bead sorting procedure above) and genomic DNA was isolated via a QIAamp DNA Micro Kit (#56304; Qiagen LLC, Germantown, USA) per manufacturers’ directions and quantified optically by Qubit 2.0 Fluorometer (#Q32866; Thermo Fisher Scientific) using Qubit dsDNA HS Reagent/Buffer (#Q32854A/Q32854; Thermo Fisher Scientific). A quantitative PCR reaction was performed using 10 ng (in 3 µL volume) of extracted DNA per reaction, 2 µL of combined 1 µM forward and reverse primers (see Supplementary Table 2), and 5 µL SYBR Green Master Mix (#A25742; Applied Biosystems, Waltham, USA) and run on the QuantStudio 7 Flex (Applied Biosystems) or ABI ViiA7 (Applied Biosystems) in a MicroAmp Optical 384-well reaction plate (#A4309849; Applied Biosystems). The CT values were then placed in the following equation: 2-(Mutant [CT ofKmt2d-Exon50/CT ofKmt2d-Total R20] – Control [CT ofKmt2d-Exon50/CT ofKmt2d-Total R20]) for recombination assessment.
Assessment of migrationChoice of the Transwell pore size (3 µM compared with 5 µM) is informative about types of thymocyte migration (for example: 3 µM requires cellular contractility [using Myosin IIa] and polarization/shape changing [Mst1 pathway] (23, 24) compared with 5 μM pores are general un-impeded migration). As previously described, control and Kmt2d+/βgeo bulk thymocytes were either pretreated with LFA1 blocking antibody (Clone M17/4, #BE0006; Bio X Cell) at 100 μg mL−1 or left untreated for 30 min, then washed and loaded at 5 × 10⁶ bulk thymocytes per 100 μL of PBS containing BSA on the top of a 24-well (6.5 mm) 3 μM pore (#3415; Corning) or 5 μM pore (#3421; Corning) Transwells. Chemokines (CCL19 [0.45 μg mL−1, #250-27B-5UG; PeproTech], CCL21 [1 μg mL−1, #250-13-5UG; PeproTech], or CXCL12 [270 ng mL−1, #250-20B-2UG; PeproTech]) stabilized with BSA or no chemokine (BSA alone; control) in 600 μL of PBS was added to the bottom of the Transwell. Equal amounts of BSA concentration were provided in the PBS of both top and bottom to prevent migration due to BSA. Transwells were incubated for 2 h at 37°C with 5% CO2 before migrated cells were harvested, stained, and analyzed by flow cytometry. SP or M2-SP phenotype and cell counts were quantified using flow cytometry gating and a semi-mature staining panel. The resultant migrated cell number was divided by the corresponding loaded cell number and normalized to Kmt2d+/+ controls under BSA conditions.
TREC analysis of RTEWithin developing T-cells, rearrangement of the gene segments encoding the T-cell receptor (TCR) occurs, resulting in chromosomal sequences that are excised to produce episomal DNA by-products called TRECs. TRECs are stable, not duplicated during mitosis, and diluted out with each cellular division; therefore, TRECs serve as markers for RTEs in the peripheral blood. To detect RTE, TREC numbers are analyzed from peripheral blood and normalized to the T-cell numbers from the blood via flow cytometric gating. Briefly, peripheral whole blood was collected in K2EDTA Microtainer tubes (BD; #365974) or with 50 μL – 100 µL of sodium heparin–coated tubes (#540-15; Fresenius Kabi, Lake Zurich, USA), subsequently stained with CD45-PE-Cy7 (#368531; BioLegend) or CD45-Alexa700 (#103113; BioLegend) and CD3-FITC (#130-080401; Miltenyi Biotec), fixed/lysed with Cytofix/Cytoperm (554722; BD), and stored in 1× PBS until run on the flow cytometer (BD LSR Fortessa/BD FACSverse). The gating percentage was used to normalize the data to CD45+ CD3+ total T-cells. DNA from 100 µL of whole blood was extracted using a QIAamp DNA micro kit per manufacturers’ directions and quantified optically by Qubit 2.0 Fluorometer, as done in the “Recombination Assessment of Cre” section. A PCR reaction was performed using 12.5 – 40 ng of extracted DNA per reaction and PowerUp SYBR Green Master Mix (#A25742; Applied Biosystems). Mouse primers for Ca were used as an internal control (Mouse Ca Forward: 5′-TGACTCCCAAATCAATGTG-3′; Mouse Ca Reverse: 5′-GCAGGTGAAGCTTGTCTG-3′), whereas mouse primers for TREC were used to quantify TREC (Mouse sjTREC Forward: 5′-CCAAGCTGACGGCAGGTTT-3′; Mouse sjTREC Reverse: 5′-AGCATGGCAAGCAGCACC-3′). Cycling was as follows: 2 min at 50°C, 2 min at 95°C, 40 cycles of: 15 s at 95°C and 1 min at 60°C. After the CTs were extracted, the differences in CT (delta CT) from Ca and sjTREC were calculated and run through the equation sjTREC/percent CD45+CD3+ cells to normalize to the number of T-cells.
RNA isolation, library preparation, and sequencingIsolated Kmt2d-KO and littermate control thymic cells were centrifuged to pellet, resuspended in 300 µL of Protection Buffer (Monarch RNA Isolation Kit, #T2010S; New England Biolabs Inc. (NEB), Ipswich, USA) and stored at −80°C until isolation. RNA was subsequently isolated following the manufacturer’s instructions of the Monarch RNA Isolation Kit (#T2010S; NEB). RIN scores and concentration were identified using High Sensitivity RNA ScreenTape (#5067-5579/#5190-6507; Agilent Technologies, Santa Clara, USA) and run using the Agilent Technology software with an electronic ladder. Quality RIN scores above 7 were used for RNA-Seq library preparation. Samples were stored at −80°C until library construction. Library construction (input: 40 ng per CD8+SP sample) was performed using a NEBNext Poly(A) Magnetic Isolation Module (#E7490; NEB) followed by a NEBNext Ultra II Directional RNA library prep kit for Illumina (#E7760 and/or #E7770 with #E7765; NEB) with size selection by AMPure XP (#Ab3881; Beckman Coulter, Brea, USA) beads, according to manufacturers’ protocols. Library quantification and quality checks were done using KAPA Library Quantification Kit for Illumina (#KK4824; Kapa Biosystems, Cape Town, South Africa), High Sensitivity D1000 DNA Kit on BioAnalyzer (#5067-4626/#5190-6502; Agilent Technologies). Paired-end 50-bp read sequencing was obtained for pooled libraries using a NovaSeq 6000 instrument (Illumina, San Diego, USA).
RNA-seq analysis: Transcriptomic data collected by RNA-Seq were analyzed to determine the genes present in each sample, their expression levels, and the differences in expression levels between Kmt2d-SET-fl/flCre+ conditional mutant and Kmt2d-SET-fl/fl control (CD4+SP Lck-CreMar, CD8+SP Lck-CreMar, CD8+SP Vav1-iCre). We also utilized publicly accessible data for CD8+SP from Lck-Cre Dot1lfl/fl GEO accession: GSE138910 and for CD4-Cre Kmt2d-exon16-19-fl/fl KO naïve CD4+ (GEO: GSE69162) and naïve CD8+ peripheral T-cells (NCBI SRA: PRJNA541991). RNA-Seq analysis (from our thymocytes) was performed using three methods. The results of the analysis from the first analysis program, SciDAP (https://scidap.com/), are used for the figures; the two alternative methods (Salmon [2] and HISAT2 [3] alignment tools) were used for verification (data not shown).
Before uploading into SciDAP, two files from each lane were merged into the same file (R1 and R2 merged; L1 and L2 merged). Within the bioinformatics website SciDAP, we imported the merged FASTQ files, trimmed adapters from the files (https://github.com/datirium/workflows/blob/master/workflows/trim-rnaseq-pe.cwl), aligned reads to the mouse genome mm10 (25) and calculated read numbers and RPKMs for transcripts, as previously described (26, 27). Differential expression analysis was performed by DESeq2 (https://github.com/datirium/workflows/blob/master/workflows/deseq.cwl). Each set of data (Kmt2d-SET-fl/flCre+) with their corresponding littermate controls (Kmt2d-SET-fl/flCre−) were run separately using pairwise DESeq2 (i.e., 1. CD4+SP Lck-CreMar, 2. CD8+SP Lck-CreMar, 3. CD8+SP Vav1-iCre). Additionally, publicly available datasets were analyzed using pairwise DESeq1 or DESeq2 pipelines (control versus experimental) and subsequently compared with our gene lists. Data files were exported from SciDAP and filtered within Microsoft Excel using the following criteria: 1. For thymocyte KMT2D-regulated genes: RPKM ≥5 in at least one condition, adjusted P-value ≤ 0.01, and Log2 fold change ≥0.59 or ≤−0.59 to be considered “upregulated” or “downregulated,” respectively, in wild-type compared with Kmt2d-deficient/mutant thymocytes; 2. For peripheral KMT2D-regulated activation genes: a. RPKM ≥5, P-value ≤0.99, Log2 fold change ≥0.59 in either activated sample of peripheral control and Kmt2d-KO cells when compared with unstimulated and b. RPKM ≥5 in either sample, P-value ≤0.99, and Log2 fold change ≤−0.59 in Kmt2d-KO when comparing between wild type and KO). Gene visualization (upregulated/downregulated vs. control littermates) is displayed via Volcano plot (VolcaNoseR; https://goedhart.shinyapps.io/VolcaNoseR/ (28); Supplementary Figure 3). The resulting KMT2D-regulated and KMT2D-regulated activation lists were placed into a Venn diagram (Venny v2.1; https://bioinfogp.cnb.csic.es/tools/venny/index.html (29)) to determine the overlapping KMT2D-regulated genes between the datasets. The resulting overlapping genes were copied into ToppGene Suite (https://toppgene.cchmc.org/ (30–33)). Using the program ToppFun with the manufacturer’s recommended settings and analyzed for biological gene ontology “GO” terms (with cutoffs being false-discovery rate Benjamini and Yekutieli [FDR B&Y] = 0.05).
For integrin heatmaps from the datasets: All individual sample RPKM values were run using the Feature expression merge pipeline, a program that combines RPKM expression from several experiments, from SciDAP. The heat maps were generated via importing a table of the integrin RPKMs generated from Feature expression merge pipeline selected in Microsoft Excel into Morpheus (https://software.broadinstitute.org/morpheus). Heatmap scales were based on overall RPKM for the heatmap with cutoffs 0 (black) 5/10 (blue), 25 (cyan), 50 (green), 100 (yellow), 250 (red), and 500 (white) for a gradient coloring to reflect the changes.
RNA-Seq analysis alternative (for confirmation): For Salmon (2) and HISAT2 (3) alignment tools, following quality checking with the software FastQC, reads were trimmed with trim-galore/0.5.0 to remove reads with adaptors.
(2) Salmon alignment tool. We built a mouse index using FASTA file of all mouse cDNA sequences downloaded from Ensembl (ftp://ftp.ensembl.org/pub/release-91/fasta/mus_musculus/cdna/Mus_musculus.GRCm38.cdna.all.fa.gz) and pseudo-mapped the RNA-Seq reads with Salmon (v1.1). Subsequently, resulting transcript quantifications were imported into R to get gene-level counts, using the tximport R package. The differential analysis was performed with DESeq2, retaining counts greater than 10.
(3) HISAT2 alignment tool. We built a mouse index using FASTA file downloaded from Ensembl (ftp://ftp.ensembl.org/pub/release-101/gtf/mus_musculus/Mus_musculus.GRCm38.101.gtf.gz) and mapped the reads with the alignment tool HiSat2/2.1.0. The generated Sam files were processed using Samtools/1.9. The reads mapped to feature (exon) and meta-feature (gene) were counted with the feature Counts function from Subread/1.6.3 using an annotation file downloaded from Ensembl (ftp://ftp.ensembl.org/pub/release-101/gtf/mus_musculus/Mus_musculus.GRCm38.101.gtf.gz). This count matrix served as the input for the differential analysis, which we performed using DESeq2. For (2) and (3): Differentially expressed genes were further analyzed for the enriched pathways with an online tool, WEB-based Gene SeT AnaLysis Toolkit (webgestalt.org).
Visualization of Kmt2d-exon16-19-fl/fl KO peripheral naïve CD8+ T-cells genes at a single-cell levelUsing SciDAP, we ran a multistep single cell (sc) RNA-Seq pipeline on the GEO accession: GSE217656 (the stimulated and unstimulated samples were run separately, only stimulated dataset results are shown) (12). First, the feature-barcode matrices were generated by Cell Ranger Count using the mouse (mm10) genome as a reference (https://github.com/datirium/workflows/blob/master/workflows/single-cell-preprocess-cellranger.cwl). Next, the multiple datasets were merged with Cell Ranger Aggregate (https://github.com/datirium/workflows/blob/master/workflows/cellranger-aggr.cwl) without normalization. Then, the merged datasets were filtered to remove low-quality cells (excluding those with low [<2k] UMI or high [>3k] gene number; https://github.com/datirium/workflows/blob/master/workflows/sc-rna-filter.cwl). During the dimensionality reduction step, the datasets were normalized (sctglm) and scaled with Seurat and integrated with Harmony using default parameters (https://github.com/datirium/workflows/blob/master/workflows/sc-rna-reduce.cwl). The dataset was clustered (https://github.com/datirium/workflows/blob/master/workflows/sc-wnn-cluster.cwl) to yield the scRNA plot viewable via UCSC cell browser (34). Top genes from each cluster were both automatically and manually used to classify each peripheral naïve CD8+ T-cell subpopulation. The relative gene expression heatmap for the selected genes was generated with the dittoSeq R package (35). The scRNA heatmap displays gene expression across each noted integrin gene (row), with each line representing a cell’s relative expression. Cells are grouped by their classified cluster (shown above heatmap). Relative scale: low (black) to high (yellow).
Proposed transcription factor binding at promoter region of KMT2D downregulated genesTo understand potential transcription factors binding within the promoter region of downregulated genes in the following variants: 1. CD4+SP Lck-CreMar, 2. CD8+SP Lck-CreMar, and 3. CD8+SP Vav1-iCre compared with their littermate controls (via DESeq2 criteria), we used the defined upstream 1 kb from the transcriptional start site (promoter region) locations from our filtered downregulation in variant gene lists and within SciDAP using the Motif Finding with HOMER with random background regions (36). The two resulting transcription factor binding motif lists (known and de novo) from each dataset were generated. The proposed transcription factors were filtered against our DESeq2 RPKM values for expression. These transcription factors were compared between known and de novo for each dataset for validation and compared across datasets. To determine if a transcription factor binding motif is true (not an artifact), the motif is required to be consistently enriched across the models and contain the length/complexity needed to accurately assign.
Chromatin immunoprecipitationThe IVG genome browser (37, 38) (accessed via SciDAP Trim Galore ChIP Seq Pipeline Single-Read; mm10) was used to locate KMT2D binding in cis-regulatory regions (and display MACS called peaks) of the integrin and egress licensing genes (Itgae, Itgal, Itgb2, Itgb7, Itgb1, and Klf2) around the transcriptional start site (TSS) and into the gene body in naïve CD4+ T-cells from a publicly accessed GEO accession: GSE69162. ChIP-Seq file SRR2037221 was analyzed using corresponding input file SRR2037222. An additional H3K4me1 ChIP-seq analysis (on GEO accession: GSE69162) was performed in unstimulated control or Kmt2d-KO peripheral naïve CD4+ T-cells. The total mapped reads for all ChIP-Seq samples were normalized to 1 million reads.
Chromatin immunoprecipitation–polymerase chain reactionThymi were harvested and single-cell suspensions were created as described above. As previously described by Sailaja et al. (39), 8 × 10⁷ total thymocytes were cross-linked with 1% formaldehyde in PBS with 0.5% bovine serum albumin at room temperature for 10 min, followed by the addition of glycine in water solution to a final concentration of 125 mM glycine for 5 min. After two washes with ice-cold PBS and their subsequent centrifugations at 300 × g for 7 min each, the cells were lysed with ChIP-Lysis buffer (10 mM EDTA, 1% [w/v] SDS, 50 mM Tris–HCl, pH 7.5, one tablet of Protease Inhibitor Cocktail [#11836170001; Roche, Mannheim, Germany], and 0.1 mM phenylmethylsulfonyl fluoride [PMSF], followed by sonication in a Bioruptor water bath of five cycles of 5 min, set on HIGH, 30 s ON, and 30 s OFF). 25 µg of DNA diluted in ChIP dilution buffer (0.01% [w/v] SDS, 1.1% [v/v] Triton, 1.2 mM EDTA, 16.7 mM Tris–HCl, pH 8.1, 167 mM NaCl) was precipitated overnight at 4°C with H3K4me3 antibody (#9727; Cell Signaling Technology, Danvers, USA) or normal rabbit IgG (considered “input,” # 2729; Cell signaling technology). PCR of the precipitated product (5 ng) was performed using a reaction with 5 µL SYBR Green (#A25742; Thermo Fisher Scientific) and 0.5 µL of 10 µM primer listed in Supplementary Table 3. Primer sequences were designed based off the 8-week Thymus H3K4me3 Histone Modification by ChIP-seq Signal from ENCODE/LICR located under the track name Thymus H3K4me3 in the Mouse July2007 (NCBI37/mm9) assembly on the UCSC genome browser (40, 41). Primers were designed with the intention that the amplicons would span the H3K4me3 binding peak (Supplementary Figure 4). The IVG genome browser (accessed via SciDAP Trim Galore ChIP Seq Pipeline Single-Read; mm10) was used to locate KMT2D binding in cis-regulatory regions of the egress licensing genes within −1 kb of transcriptional start site (TSS) into the gene body up to 5 kb (first few exons) in naïve CD4+ T-cells from a publicly accessed ChIP-Seq file SRR2037221 analyzed using corresponding input file SRR2037222 (37, 38). In silico PCR (UCSC genome browser; mm10 genome) was used to generate the primer location (Supplementary Figure 4 indicated in blue) from the ChIP-PCR primer sequence designed with the H3K4me3 binding peak (40).
Assessment of gene and protein sequence similaritiesMurine ITGAE (Gene ID: 16407; Protein GenBank ID: ABD49099.1), ITGAL (16408; AAI45803.1), ITGB2 (16414; AAI45645.1), and ITGB7 (16421; EDL03997.1) protein and gene sequences were obtained from the NCBI database for genetic and protein similarities. For comparison of the cis-regulatory region (1,001 base pairs upstream from the transcriptional start site sequence) was determined using the UCSC genome browser with mm39 alignment, the DNA sequence generated and run through LALIGN Pairwise Sequence Alignment (https://www.ebi.ac.uk/Tools/psa/lalign/; a program that finds internal duplications by calculating non-intersecting local alignments of protein or nucleotide sequences) (42).
Statistical analysisFor murine flow phenotypic, weight-based, and ChIP-PCR data, significance was determined using a parametric, unpaired, Welch’s corrected t-test against the littermate. The P-values are noted by asterisks: P-value > 0.05 (ns), P-value < 0.05 (*), P-value < 0.01 (**), P-value < 0.001 (***), and P-value < 0.0001 (****). RNA-Sequencing was analyzed using DESeq2, which utilizes the Benjamini–Hochberg method to generate P-adjusted values.
For human data, significance was determined using the binomial test, with the null hypothesis being that individuals with KS1 have the same probability of falling outside the reference range (2.5 to 97.5 percentile) equal to 5%, that is, the same as healthy age-matched individuals. The resulting P-values were subsequently adjusted for multiple testing with the Bonferroni method and noted by asterisks: P-value > 0.05 (ns), P-value < 0.001 (***), P-value < 1e-9 (^), and P-value < 1e-14 (&).
ResultsKmt2d loss alters SP thymocyte progression in a dosage-dependent mannerTo understand the role of KMT2D across T-cell development, we first evaluated the gene’s thymic function using multiple murine models that span from systemic to T-cell-specific and from constitutive to conditional to help define valid consistent changes caused by Kmt2d deficiency and rule out model-contributed artifacts. To do this, we employed a constitutive Kmt2d haploinsufficiency (herein called Kmt2d+/βgeo mice) (19), which reportedly profiles similar to human KS1. We validate the findings utilizing two conditional T-cell-specific Kmt2d KOs (CD4-Cre, Lck-CreMar) systems known to initially recombine at distinct late DN thymocyte stages (Supplementary Figure 1) to help narrow down the Kmt2d influences intrinsic to T-cells.
First, we analyzed murine thymus weight and found no significant change in Kmt2d+/βgeo mice, nor in CD4-Cre-driven Kmt2d KOs; however, the T-cell-specific Lck-driven Kmt2d-KO led to a significant increase in thymus weight (Figure 1A;Supplementary Figure 5A). Next, to elucidate the stages in which Kmt2d plays a role during thymocyte development, we analyzed thymocyte populations (CD4-CD8-DN, CD4+CD8+DP, CD8+SP, and CD4+SP) across developmental time. Strikingly, Kmt2d loss significantly increased the percentage of CD8+SP, but not CD4+SP thymocytes (of live/single cells) in both Kmt2d-KO models and in the Kmt2d-haploinsufficent model (Figure 1B).
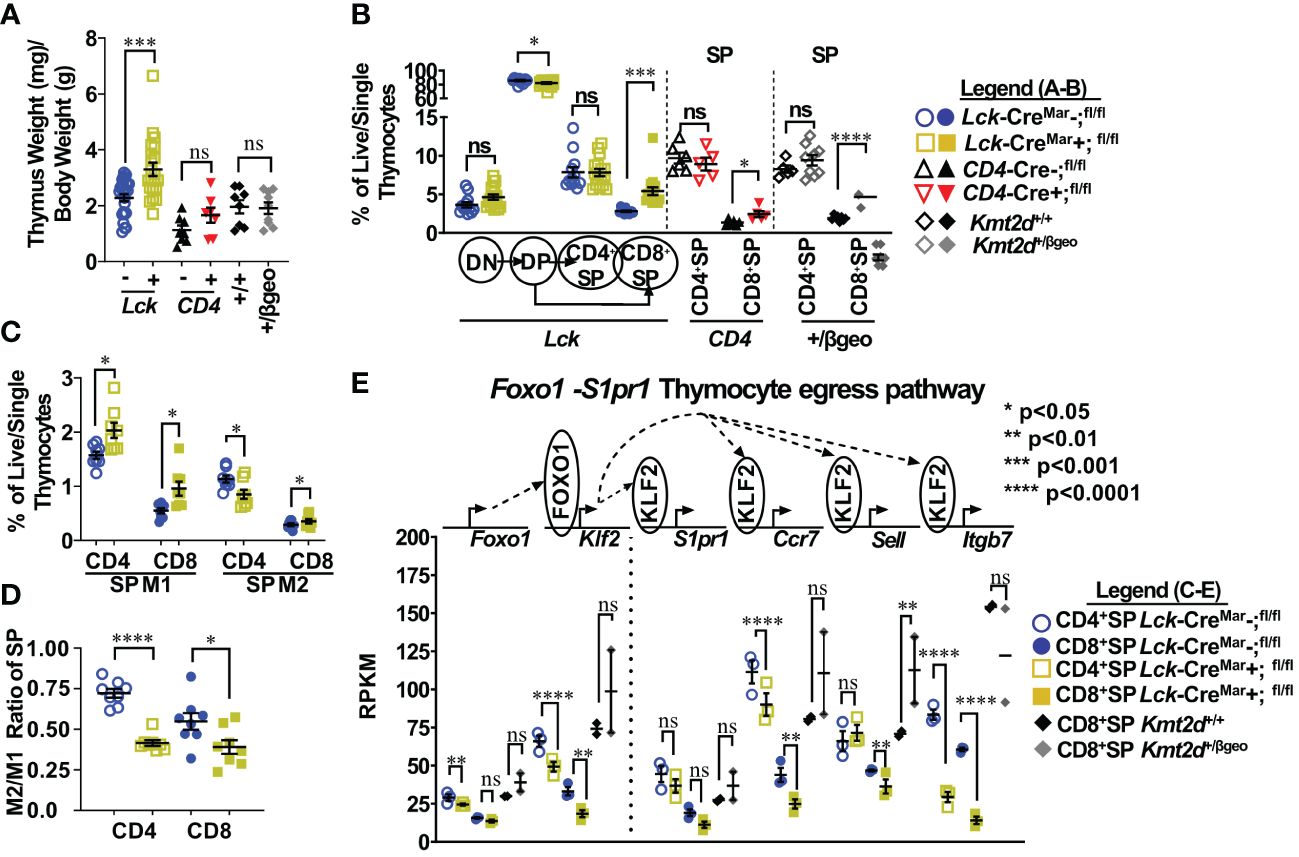
Figure 1 Shifts toward enhanced CD8+SP cell percentage, accumulation of Mature 1 SP cells, and alterations in the Foxo1 licensing egress pathway at the population level in Kmt2d-deficient mice. (A) Organ weight of thymus (milligrams) normalized to body weight (grams). (B) Flow cytometric analysis of thymocyte populations across development, as indicated: double-negative (DN), double-positive (DP), and single-positives (CD4+SP, CD8+SP) as a percent of total live/single thymocytes. Lck-CreMar; Kmt2d-SET-fl/fl thymocyte populations (left) and CD4+SP and CD8+SP from CD4-Cre; Kmt2d-SET-fl/fl (middle) and Kmt2d+/βgeo (right) separated by dotted lines. CD8+SP are significantly enhanced in all models. (C/D) Thymic Lck-CreMar; Kmt2d-SET-fl/fl CD4+SP (open) and CD8+SP (closed) maturation by flow cytometry, progressing from Mature 1 MHCI+CD69+CCR7+TCRβ+ (M1; left) to MHCI+CD69-CCR7+TCRβ+ Mature 2 (M2; right) as a percent of total thymocytes (C) or by M2-SP/M1-SP ratio using values from % of total thymocytes values (D). Each marker displays average cells from individual mice (n = 2–15; from two or more independent experiments/condition). (E) Disruption of the Foxo1 egress licensing pathway expression (RPKM) in Kmt2d-deficient CD4+SP and CD8+SP thymocytes. Pathway depicted above graph: FOXO1 protein binds to promote gene expression of Klf2, fueling KLF2 protein expression (protein depicted within circle), which binds to four downstream genes inducing increased RNA expression of the stated genes. Relevant genes are displayed on the top of each dataset. Each marker displays average cells from individual mice (n = 2–15) and black lines represent mean ± SEM. The mouse lines are displayed on the graphs: Kmt2d+/βgeo (+/+ black diamonds/+/βgeo gray diamonds), Lck-CreMar; Kmt2d-SET-fl/fl (Cre− blue circles/Cre+ yellow squares), and CD4-Cre; Kmt2d-SET-fl/fl (Cre− black up-right triangles/Cre+ red inverted triangles). For all cellular/organ phenotype analysis, we employed parametric, unpaired, Welch’s corrected t-test (mutant compared with corresponding littermate) for significance. For (E), DESeq2 generated adjusted P-values using the Benjamini–Hochberg method. Significance is listed on graph based on P-value or DESeq2 adjusted P-values (e) > 0.05 (ns), P-value < 0.05 (*), P-value < 0.01 (**), P-value < 0.001 (***), and P-value < 0.0001 (****). Multiple independent experiments were used for (A-D).
Thymocyte SP maturation occurs concurrently with negative selection, proceeding from semi-mature SP cells into the “non-licensed” Mature 1 (M1)-SP stage and then onto the Mature 2 (M2)-SP thymocyte stage, where cells are licensed, selected, and become ready for egress. We selected Kmt2d-KO thymi to further characterize Kmt2d’s influence on SP maturation as deletion of both alleles may allow us to more clearly view the mechanism without potential compensation. By flow cytometry, Kmt2d-KO (Lck-CreMar) thymocytes have a significantly increased percentage of M1-SP (Figure 1C). In addition, CD44 cleavage (which is required for SP maturation and egress) (43) did not occur as frequently within either Kmt2d-KO or -haploinsufficient SP cells as their control littermates (Supplementary Figure 5B). When evaluating the SP population, we found that the T-cell-specific Kmt2d KO mice most likely had a partial block in the transition between M1 to M2 differentiation as we observed a relative M1 accumulation and a M2 reduction, but the overall CD4+SP population does not change as a percentage of total thymocytes (Figures 1B–D). In contrast, CD8+SP demonstrated an increase in both M1-SP and M2-SP thymocyte populations leading to an increase in the overall percentage of the CD8+SP population in the overall thymocyte pool (Figures 1B–D). In contrast, Kmt2d haploinsufficient mice do not have the M1-SP accumulation but rather a trend toward increased M2-SP (Supplementary Figures 5C, D). These heterogenous SP changes demonstrate Kmt2d’s differential effect on CD4+SP and CD8+SP thymocytes as they transition from M1 to M2 or in the ability of M2 cells to egress.
SP differentiation has previously been partially characterized, but the role of Kmt2d in this process is unknown. Reportedly, the transcription factor, FOXO1, is only expressed in the most mature SP cells (CD69− and no longer receiving negative selection TCR signaling) and normally binds at the Klf2 locus (44–46). Subsequently KLF2 regulates the transcription (through binding) of a plethora of homing genes including S1pr1 (encodes sphingosine-1-phosphate receptor 1, the receptor for S1P1), Itgb7, Ccr7, and Sell (encodes CD62L), all of which are normally upregulated during the egress process (44–47). As M1-SP thymocyte accumulation was observed in Kmt2d-KO SP thymocytes, we investigated whether dysregulation of the FOXO1-driven egress licensing pathway could be a potential culprit. In Kmt2d-KO SP thymocytes, we observe either a significant or trending reduction in expression of nearly all FOXO1 target genes analyzed (Figure 1E). Both phenotypic and RNA analyses revealed a population level maturation deviation in Kmt2d-KO SP. In contrast, Kmt2d-haploinsufficient CD8+SP thymocytes did not have the reduced expression but rather a trend of enhancement of Foxo1, Klf2, S1pr1, and Ccr7 (Figure 1E). Interestingly, Kmt2d-haploinsufficient CD8+SP thymocytes displayed an independent reduction of Itgb7 expression, albeit not significant (Figure 1E). The FOXO1 pathway may require at least one allele of Kmt2d for function, as complete Kmt2d loss resulted in reduced late maturation (M2), whereas one allele is sufficient to support normal expression of this pathway. As the CD8+SP population was relatively expanded and Itgb7 reduction within SP thymocytes is conserved across all Kmt2d-deficient models, two alleles of Kmt2d may be required for Itgb7 expression (potentially by direct regulation) and Itgb7 loss may contribute to CD8+SP accumulation (Figure 1E).
To further understand KMT2D’s broader regulatory function in thymocyte development, we evaluated gene expression changes in our models and characterized overall biological impacts. Specifically, we evaluated significantly downregulated genes in the bulk Kmt2d KO SP thymocytes that were shared between the CD4+SP and CD8+SP in different conditional KO models (Lck- vs. Vav1-driven Cres; Supplementary Figure 3). KMT2D is a transcriptional co-activator that regulates gene activation through histone H3K4 methylation on promoters and enhancers; therefore, a priori one would expect direct KMT2D-targets to show reduced RNA expression in Kmt2d-KO compared with control cells. Downregulated genes (Supplementary Table 4) that overlapped in the different SP KO models clustered in the biological gene ontology terms “cell adhesion,” “GTPases,” and “activation,” which are all downstream functions of integrins. Similarly, the biological function of genes downregulated in Kmt2d haploinsufficient thymocytes (DN1 and CD8+SP) and CD8+SP KO thymocytes overlapped with “cytotoxic (effector),” “response/activation,” and “migration” gene ontology terms, but CD8+SP KO cells additionally had downregulated genes associated with “proliferation” and “differentiation.” Together, these findings suggest that Kmt2d loss in distinct models affects similar pathways of activation and adhesion/migration.
KMT2D regulates integrin expression during thymocyte developmentSince the biological categories associated with KMT2D aligned with activation and adhesion, we next investigated integrin expression in thymocytes. Altered integrin expression, changes in motility and integrin-directed localization, and disrupted cellular signaling have been previously described in various KMT2D deficient model systems (2, 12, 48, 49).
Starting in SP thymocytes, we evaluated integrin gene expression in Kmt2d sufficient and conditionally deficient cells (Figure 2A). In this case, we have also employed a conditional hematopoietic-activated Kmt2d KO driven by Vav1-iCre (22), to assist in confirming consistency of changes. We found that both control and Kmt2d KO (Lck-CreMar and Vav1-iCre) SP cells expressed integrin genes previously reported in control SP thymocytes (50), including Itga4, Itga5, Itga6, Itgae (only CD8+SP), Itgal, Itgav, Itgb1, Itgb2, Itgb3, and Itgb7; however, expression levels did vary by genotype. In Kmt2d KO SP thymocytes, genes that produce integrin subunits whose proteins heterodimerize together, such as the Itgae/Itgb7 and Itgal/Itgb2 pairs, had significantly reduced expression of both alpha and beta genes (Figure 2A). Furthermore, Kmt2d KO SP thymocytes had reduced expression of two other integrins, Itga4 and Itga6, while showing increased Itgb1 and Itgb3 expression (Figure 2A) compared with controls.
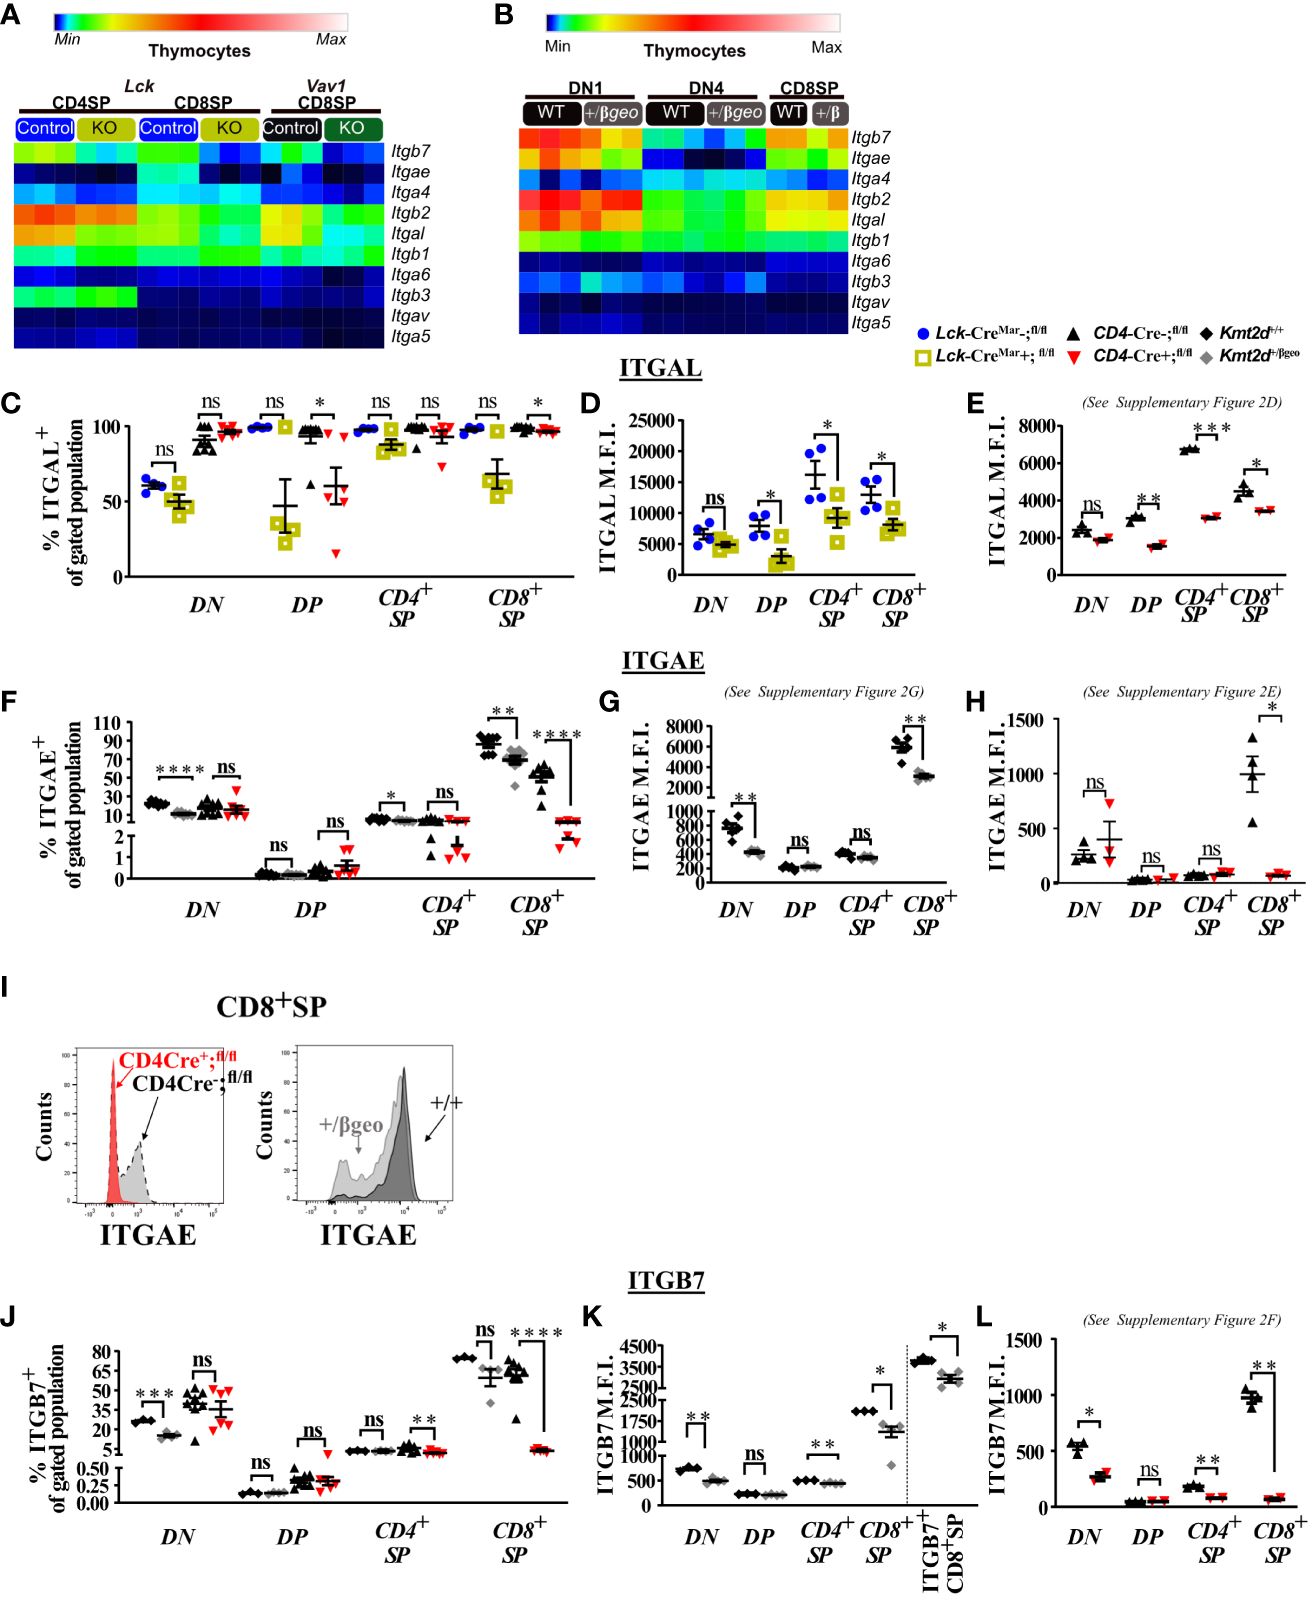
Figure 2 Dysregulated thymic integrin expression in Kmt2d-deficient models. (A, B) Heatmap panel of relatively expressed integrins from: (A) Lck-CreMar or Vav1-iCre driven Kmt2d KO and corresponding control SP thymocytes (n = 3 mice [biological replicates]/group) from 1 (Lck-Cre) or 2 (Vav1-iCre) independent experiments. (B) Kmt2d haploinsufficient and sufficient thymocytes across stages of thymocyte development (DN1, DN4, and CD8+SP) from 1 (CD8+SP; n = 2 mice [biological replicates]/condition) or 2 (DN1, DN4; n = 3 mice [biological replicates]/condition) independent experiments. DN1 and DN4 contain results from multiple pooled mice in 1 sample (n = 1) within an independent experiment. Relative expression level scale based on RPKM values of the whole plot (black, 0; blue, 10; cyan, 25; green, 50; yellow, 100; red, 250; white, 500). (C-L) Flow cytometric population shifts across the thymocyte development: shown as percent positive of indicated thymic population: double-negative (DN), double-positive (DP), and single-positive (CD4+SP, CD8+SP) of ITGAL (C), ITGAE (F), and ITGB7 (J) or relative mean fluorescence intensity (MFI; in arbitrary units of intensity (a.u.i.); i.e., protein expression level) of ITGAL (D, E), ITGAE (G, H), and ITGB7 (K, L). The following mouse lines (Kmt2d+/βgeo [+/+ black diamonds/+/βgeo gray diamonds, two independent experiments], Lck-CreMar; Kmt2d-SET-fl/fl [Cre− blue circles/Cre+ yellow squares, 1 independent experiment] and CD4-Cre; Kmt2d-SET-fl/fl [Cre− black up-right triangles/Cre+ red inverted triangles, three independent experiments]) are displayed as one marker per individual mouse (n = 2–9 mice [biological replicates]/condition) on the graphs. The percentage graphs (C, F, J) display all independent experiments together; however, MFI graphs (D, E, G, H, K, L) only display one independent experiment as cytometer settings and instruments were altered. The MFI for the additional independent experiments (with similar MFI directionality) are displayed in Supplementary Figures 2D–G. (I) Representative flow histogram overlay of Kmt2d deficient with corresponding control littermate each from a single mouse (y axis: Counts, as normalized to mode). Depiction of both the shift toward the negative population and decreased expression level of ITGAE in CD8+SP (right; +/+ black/+/βgeo gray, left; CD4-Cre; Kmt2d-SET-fl/fl with Cre− black/Cre+ red). Each dataset displays black lines, which represent mean ± SEM. Significance labeled on graphs were determined using a parametric, unpaired, Welch’s corrected t-test between a mutant and corresponding littermate controls. Significance based on P-value > 0.05 (ns), P-value < 0.05 (*), P-value < 0.01 (**), P-value < 0.001 (***), and P-value < 0.0001 (****).
We next analyzed integrin levels in Kmt2d haploinsufficient thymocytes across key developmental states (DN1, DN4, and CD8+SP populations). Although the DN1 and CD8+SP populations of Kmt2d+/βgeo showed a trend toward reduced leukocyte-specific integrin expression levels, the observed differences were not statistically significant (Figure 2B). Furthermore, DN4 thymocytes had modest integrin expression with no significant differences between genotypes (Figure 2B). Overall, KMT2D appears to be important for leukocyte-specific integrin expression in SP cells in a gene dose-dependent fashion.
To determine if integrin gene expression changes altered their protein expression levels, we evaluated a panel of differentially expressed integrins (ITGAL, ITGAE, and ITGB7) by flow cytometry across thymocyte developmental time. Our results indicate that the majority of all thymocytes express ITGAL with its expression increasing across developmental time (lowest expression in DN, enhanced in DP, with highest expression in SP; Figures 2C–E). When comparing Kmt2d KO mice with control mice, a significant decrease in ITGAL expression levels (decreased geometric mean fluorescence intensity; MFI) begins in the DP stages and continues in both SP thymocyte populations (Figures 2D, E; Supplementary Figure 2D). Additionally, changes in ITGAL positivity (shifts in population positive to negative ITGAL expression) in Kmt2d-targeted mice trend toward decreased ITGAL populations in both DP and CD8+SP thymocytes compared with control mice (Figure 2C). In contrast, both the ITGAE+ population and ITGAE MFI are specifically decreased in the CD8+SP thymocytes, but not in DP cells in Kmt2d-deficient models (Figures 2F–I; Supplementary Figures 2E, G). Similarly, ITGB7 displayed similar patterns of reduced MFI and populations shifts in CD8+SP, without altered changes in the DP population (Figures 2J–L). In CD8+SP, the expression intensity of ITGAE and ITGB7 in control cells is at least twofold higher than other thymocyte populations (DN, DP, CD4+SP), whereas in the Kmt2d KO CD8+SP thymocytes, the ITGAE and ITGB7 MFIs decrease to levels similar to those of DP and CD4+SP thymocytes (Figures 2H, L; Supplementary Figures 2E, F). Lastly, the ITGB7 MFI levels in CD4+SP and CD8+SP thymocytes within haploinsufficient models were decreased (Figure 2K). A closer analysis of CD8+SP ITGB7-positive thymocytes reveal that the intensity decrease in the Kmt2d-haploinsufficient model specifically corresponds to changes at both the expression level within the positive population and in overall ITGB7 positivity, similar to alterations observed in ITGAE (Figures 2I–K). Thus, KMT2D appears to influence this specific group of integrin signaling molecules, and these observed expression abnormalities translate into a measurable effect at the protein level. From the expression and protein integrin subunit shifts, our data support a model where within control SP thymocytes, KMT2D is associated with the expression of integrin dimers ITGAE-ITGB7 and LFA1 (ITGAL-ITGB2), whereas in models deficient in Kmt2d, these heterodimers are no longer expressed or are greatly reduced.
Conserved integrin expression consistent with direct KMT2D controlTo examine whether KMT2D directly regulates SP thymocyte integrin and egress genes, we utilized published KMT2D chromatin immunoprecipitation-sequencing (ChIP-Seq) data (GEO accession: GSE69162) to identify KMT2D peaks present in putative cis-regulatory regions of an SP licensing transcription factor (Klf2) and integrins (Itgal, Itgb2, Itgb7, and Itgb1) within peripheral CD4+ T-cells (12, 13). In the ChIP-Seq datasets, we observed KMT2D binding in unstimulated peripheral CD4+ T-cells at Itgal, Itgb2, Itgb7, and Klf2 cis-regulatory regions, but lower reads in Itgb1 (Figure 3A). Next, we selected Klf2, Itgal, Itgb7, and a control housekeeping gene, Gapdh, cis-regulatory regions (Supplementary Figure 4) for H3K4me3 ChIP-PCR to assess KMT2D catalytic activity, and thus reveal potential direct regulation of KMT2D. We found significantly decreased H3K4me3 levels at Klf2, Itgal, and Itgb7 cis-regulatory regions, whereas the Gapdh promoter showed no change (Figure 3B). This finding suggests direct KMT2D-catalyzed chromatin modification at these loci. Next, we compared H3K4me1 levels between unstimulated control and Kmt2d KO CD4+ T-cells in the ChIP-Seq dataset (GEO accession: GSE69162) (12, 13). Normally, H3K4me3 is present at active promoters; however, without KMT2D catalytic function, histone H3K4me2 and H3K4me3 methylation may be less efficient, thus retaining H3K4me1 at promoters of genes that KMT2D can directly regulates. In fact, we observe a significantly enhanced fold change of H3K4me1 reads at the Itgb7 promoter using MAnorm analysis (Figure 3C). Together, these data suggest that KMT2D directly regulates Itgb7.
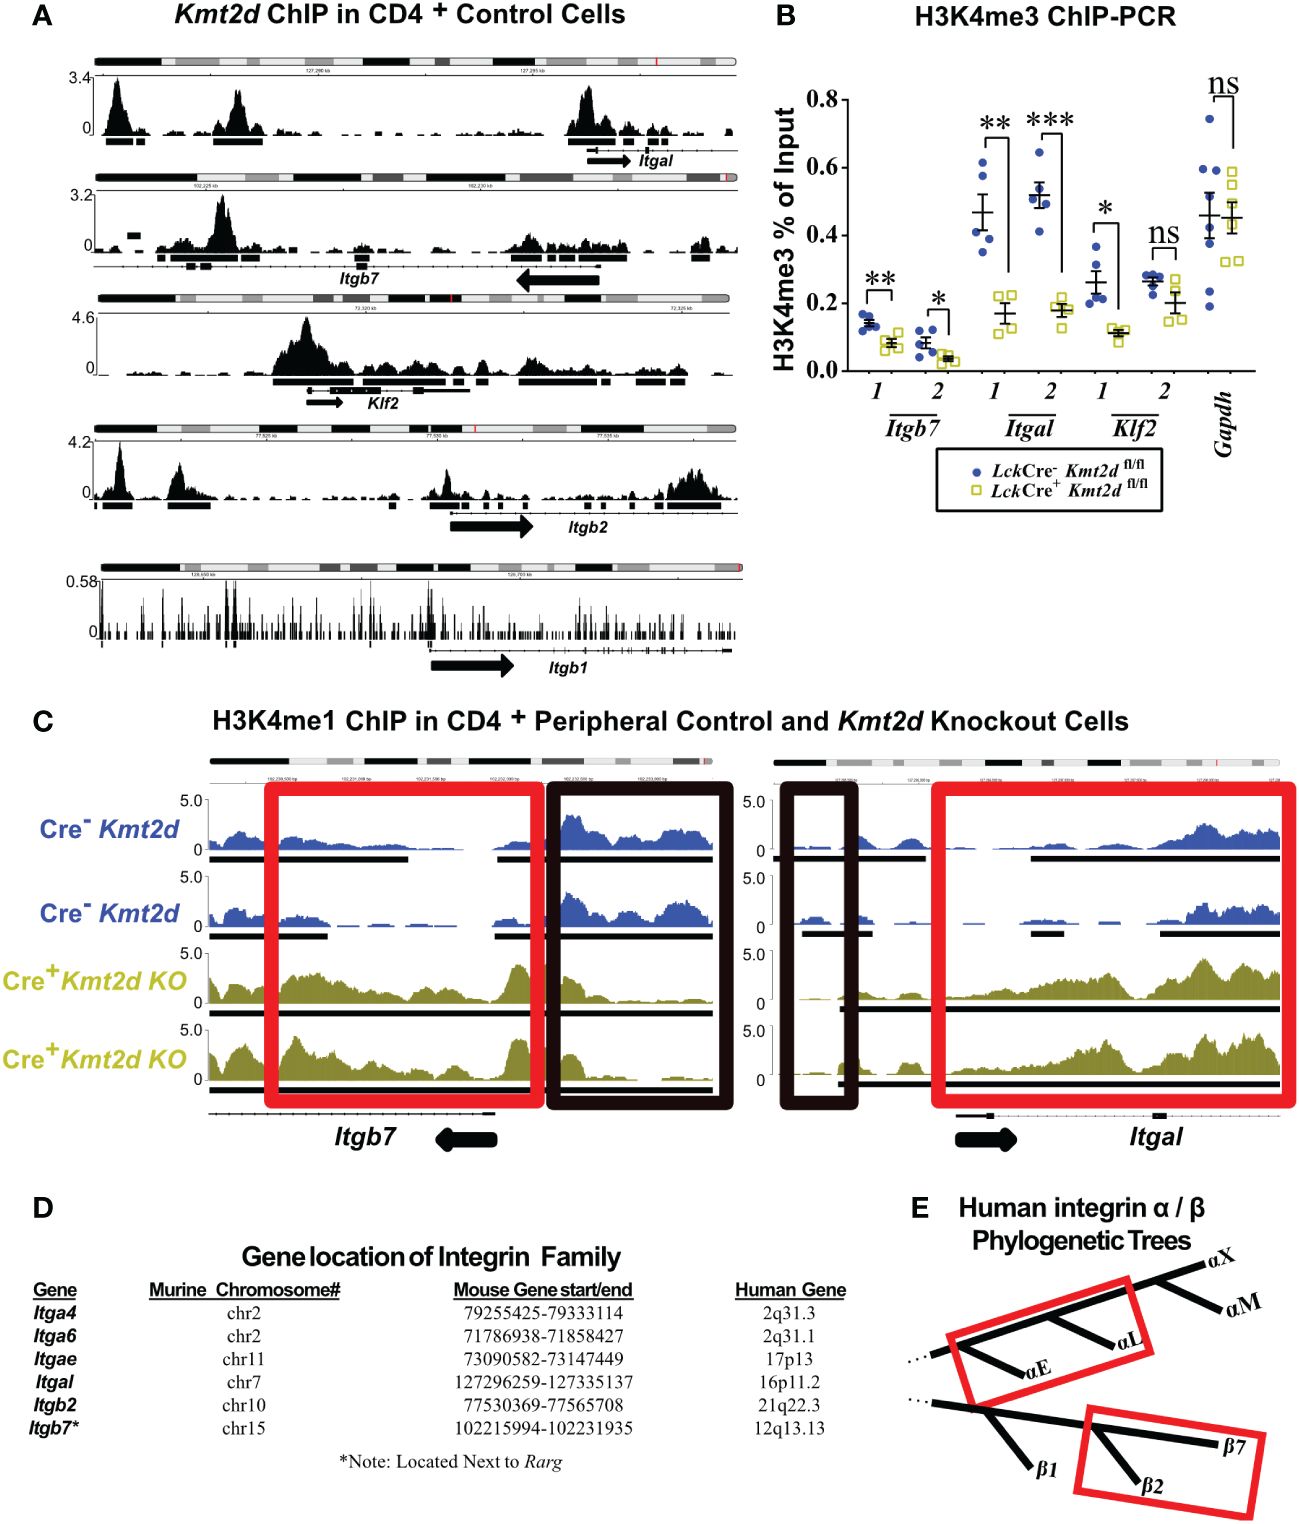
Figure 3 Differentially expressed genes have KMT2D binding sites in cis-regulatory regions and demonstrate an abnormal chromatin signature. (A, C) Integrative Genomics Viewer browser images of chromatin immunoprecipitation (ChIP) binding of KMT2D (A) or H3K4me1 (C) in control naïve peripheral CD4+ T-cells at cis-regulatory regions around the transcription start site (TSS) region of the Kmt2d KO downregulated genes from GEO accession number: GSE69162. (C) ChIP of H3K4me1 at cis-regulatory regions (red and black boxes highlighting regions with shifts between control [Cre−, blue] and Lck-CreMar; Kmt2d-SET-fl/fl [Cre+, yellow] landscapes) of Itgb7 and Itgal in naïve peripheral CD4+ T-cells. Black arrow notes TSS start site and direction for the gene. (B) ChIP-PCR of H3K4me3 Lck-CreMar; Kmt2d-SET-fl/fl (Cre- blue circles/Cre+ yellow squares; n = 4–8; from three to four independent experiments) bulk thymocyte binding to indicated cis-regulatory regions (primer locations displayed in Supplementary Figure 4) of Klf2, Itgb7, and Itgal genes, as compared with that of housekeeping genes (Gapdh). Each dataset displays black lines, which represent mean ± SEM. Significance determined using a parametric, unpaired, Welch’s corrected t-test between a mutant and corresponding littermate controls is listed on graph based on P-value > 0.05 (ns), P-value < 0.05 (*), 0.01 (**), and 0.001 (***). (D) Downregulated integrins and their murine and human chromosomal locations. No observed clustered co-localization of downregulated leukocyte-specific receptor integrin genes on both mouse and human chromosomes, but similar location of Itga4 and Itga6. (E) Red box highlighting the proximity of the leukocyte-specific receptor integrins on their localized regions of their respective separate phylogenetic tree regions.
As multiple integrins demonstrated similar alterations in expression upon loss of Kmt2d, we hypothesized that they might be co-regulated. KMT2D thymocyte integrin co-regulation did not appear to involve genomic domain regulation as chromosomal location/loci (both murine and human) were not shared by affected integrin genes (Figure 3D). Phylogenetically, human α- and β-leukocyte-specific integrins were most similar within their respective chains displaying more than 60% protein homology (Figure 3E).
留言 (0)