2.1 Study Design
This study is an observational, retrospective pharmacovigilance analysis of the FDA Adverse Event Reporting System (FAERS) database. It was designed with a multimodal stepwise approach, combining different criteria toward clinical prioritization of AEs, an approach recently proposed in pharmacovigilance [16, 17]. To this aim, descriptive and multiple disproportionality analyses were implemented. Finally, a case-by-case assessment was carried out to further characterize AEs with high clinical priority. The analyses were performed through the open-source R software (version 4.0.2; 22 June 2022).
2.2 Data Source
The FAERS archive is a publicly available post-marketing surveillance system collecting more than 20 million anonymized ICSRs that were submitted to the FDA by the pharmaceutical industry, healthcare providers, lawyers, and consumers. The FAERS, mainly representative of the USA, also gathers serious AEs from the rest of the world. This publicly available archive has attracted considerable interest among clinicians for safety assessment of anticancer drugs and relevant post-marketing characterization of AEs of special interest and is particularly suited for the detection of rare but serious AEs, which may escape detection and/or reporting within clinical trials [18, 19].
Of note, FAERS offers a unique opportunity to publicly access data and can be accessed through (a) a user-friendly public dashboard (https://www.fda.gov/drugs/questions-and-answers-fdas-adverse-event-reporting-system-faers/fda-adverse-event-reporting-system-faers-public-dashboard), containing many duplicates and limited information and (b) raw quarterly data downloadable as ASCII or XML files (https://fis.fda.gov/extensions/FPD-QDE-FAERS/FPD-QDE-FAERS.html), which need to be pre-processed but allow for more reliable and customized analyses.
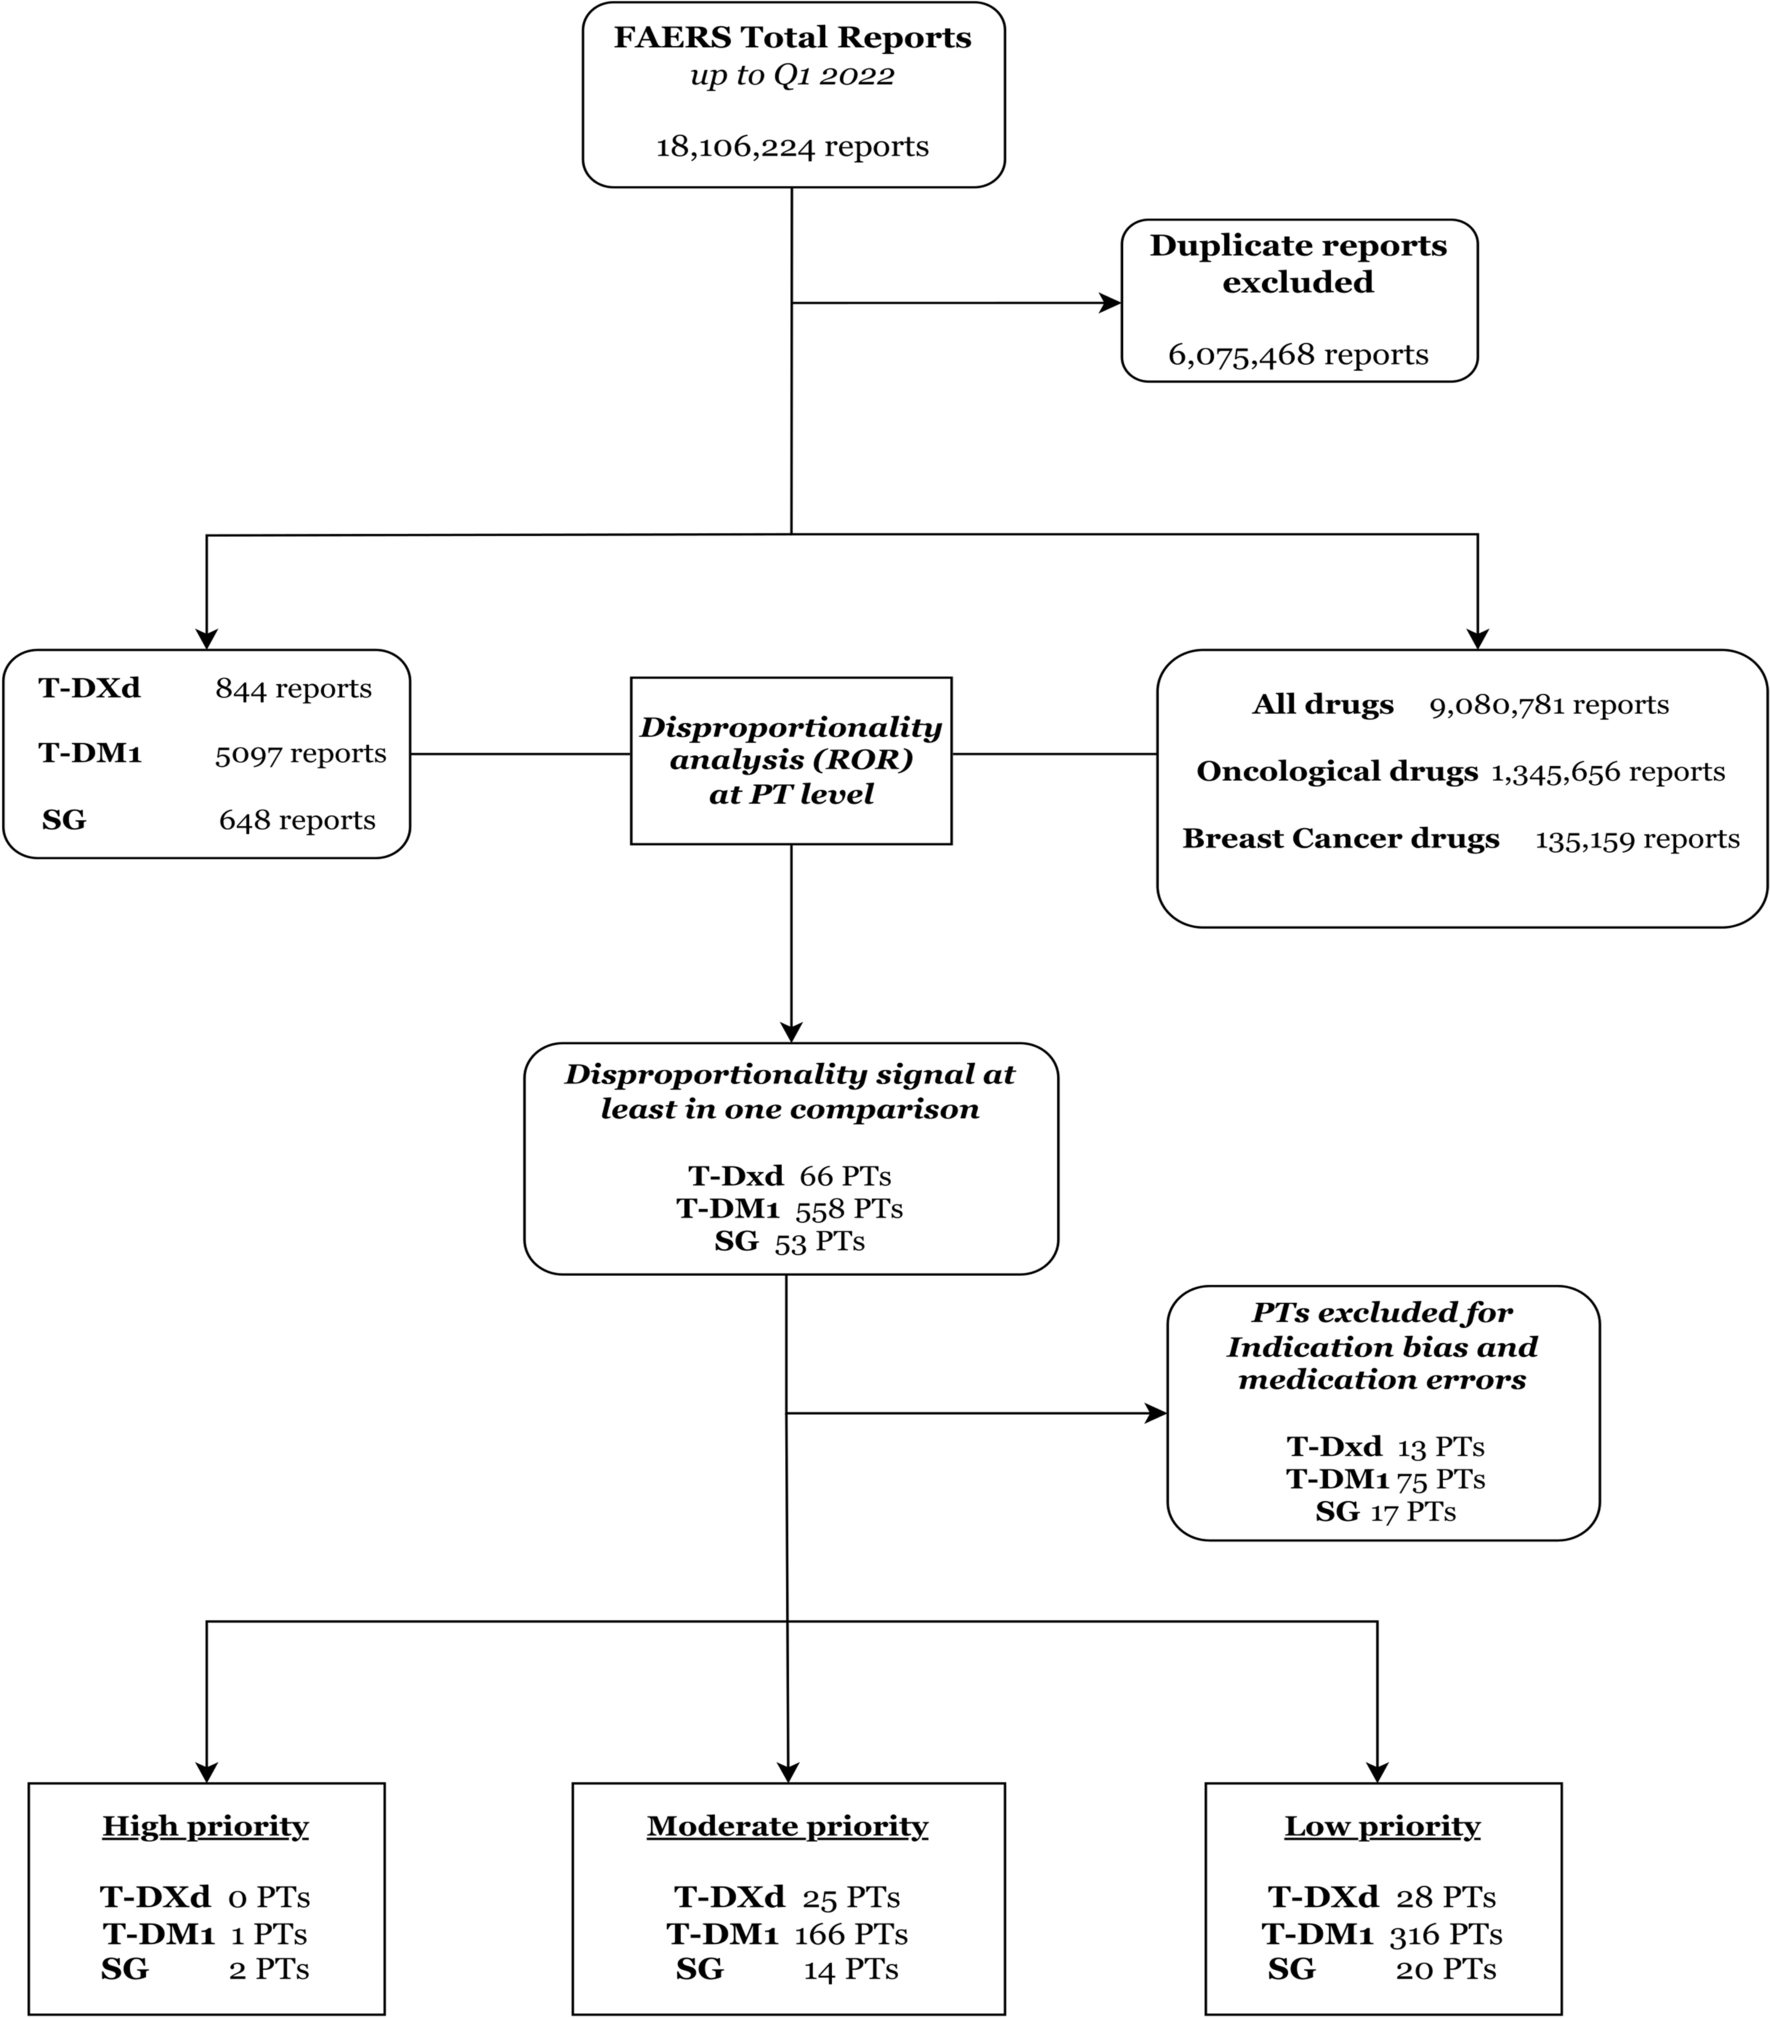
We downloaded the FAERS quarterly data [20] since February 2013 up to the first quarter (January–March) of 2022. The AEs were codified through the Medical Dictionary for Regulatory Activities (MedDRA) terminology at the preferred terms (PTs) level. The drugs are recorded as free text and need a thorough standardization before any analysis. To this end, we used a specifically developed dictionary, known as the DiAna dictionary, to standardize drug names into active ingredients [21]. Duplicates were identified and removed on the basis of the presence of the overlapping data in six key variables (sex, age, reporter country, list of drugs, list of events, event date).
2.3 Drugs of Interest, Cases and Exposure Definition
Three ADCs were selected as study drugs: T-DM1, T-DXd, SG (see Supplementary Material 1 for details on the relevant codification).
Cases of interest were reports where at least one ADC of interest was recorded with different exclusion criteria applied. Considering the FDA approval of the trastuzumab emtansine, we selected only reports submitted since February 2013 to obtain a more homogeneous reference group and minimize the existence of pre-marketing reports. AEs associated with cancer (e.g., metastasis, breast cancer) and lack of efficacy (e.g., disease progression) were removed to minimize the existence of a “reverse causality bias” known as indication bias in pharmacovigilance, for which the indication for the prescribed drug is reported as an AE, a frequent phenomenon especially in oncology [22]. Finally, AEs related to medication errors were excluded.
In FAERS, the exposure to a given drug is classified by the reporter as primary suspect (PS), secondary suspect (SS), concomitant (C), or interacting (I). To avoid potential misclassification of AEs and increase the accuracy of analyses, we removed those reports recording one of the investigated ADCs as C or I. In other words, only reports where ADCs of interest were recorded as PS or SS were retained.
2.4 Descriptive Analysis
Descriptive analysis was carried out to explore and compare characteristics of ADC reports in terms of patient demographics (sex, age, country, type of reporter) and outcomes (seriousness). The reference group included only oncological reports, identified as any report recoding at least one drug listed within L01, L02BA, L02BG, and L02AE classes of the Anatomical Therapeutic Chemical (ATC) classification system, not including T-DXd, TDM-1, and SG records. Descriptive percentages refer to the proportion of reports recording a specific value, and cannot be interpreted as risk estimates. Data were reported as counts and relevant percentages for categorical variables, and as median values and interquartile ranges (IQRs) for continuous variables. Fisher’s exact test and χ2 test were adopted to compare categorical variables, while continuous variables were assessed using Kruskal–Wallis test; results were deemed significant for p < 0.05.
2.5 Disproportionality Analysis
Disproportionality analysis is a consolidated approach used to generate hypotheses on a possible drug-event association by comparing the proportion of reports recording a specific AE for a single drug or pharmacological class with the proportion of reports recording the same AE for a reference group [23]. If the proportion of AEs is greater in patients exposed to a specific drug (cases) than in patients not exposed to the same drug (reference group), a higher-than-expected reporting is detected, and a disproportionality signal can be claimed. Through this so-called case/non-case design, an association can be hypothesized between the specific drug and the event and can inform clinical practice for relevant monitoring or targeted preventive strategies [24].
Different disproportionality measures are available, including Bayesian and frequentist approaches. Since no gold standard exists and the performance of the various measures is comparable, we calculated the frequentist reporting odds ratios (ROR) with relevant two-sided 95% confidence interval (CI). In fact, the ROR is relatively easy to understand, interpret, and compute (using the 2 × 2 contingency table), and allows ICSRs database as a data source for a case-control study [25]. We corrected the ROR for multiple comparison using the Bonferroni test, as recently argued to minimize false positive results [26]. We used common threshold to define a statistically significant disproportionality signal, i.e., a lower limit of 95% CI > 1, with at least three cases reported.
The selection of the most appropriate comparator is debated but crucial in pharmacovigilance to minimize confounders [27]. We conducted a stepwise disproportionality approach using three different comparators: (a) all other drugs recorded in FAERS (a traditional screening approach); (b) all anticancer drugs, identified through the ATC classification system (L01, L02BA, L02BG, L02AE), reported as PS and SS drugs—this strategy allowed to control for major confounders, including confounding by indication (i.e., cancer may be a risk factor per se for a given AE); and (c) anticancer drugs used in breast cancer. To this purpose, indications that specify other tumors and did not contain any reference to breast cancer, according to High Level Term of MedDRA terminology, were excluded. These latter approaches have been described as disproportionality by therapeutic area or active-comparator disproportionality analysis and can be useful to partially mitigate the so-called channeling bias (i.e., selective prescription toward more severe patients, notably for ADCs), thereby further minimizing false-positive results [28, 29], especially in the oncological area [30].
2.6 Classification and Prioritization of Relevant Disproportionality Signals
For each drug, AEs emerging with a significant association in at least one disproportionality analysis were ranked on the basis of a semiquantitative score assessing the following criteria (Table 1):
Clinical relevance: we used the lists of Important Medical Events (IMEs—serious events—version 26.0) and Designated Medical Events (DMEs—rare but serious events likely to be drug induced), provided by the European Medical Agency) [31].
Reporting rate: the proportion of the AE of interest as compared with other AEs (i.e., the ratio between cases and non-cases). To mirror clinical trials, the following traditional categories were used: very common (≥ 10%), common (1–10%), and uncommon (≤ 1%).
Signal stability: consistency/robustness of disproportionality signals across multiple analyses. Maximum score was awarded to full consistency (disproportionality signals in three out of three analyses on the basis of different comparators).
Reported case fatality rate: the proportion of reports where death was recorded, as compared with all AEs. Notably, the mortality rate in oncology is expected to be per se remarkably high regardless of the drug contribution, and it is challenging to discriminate between AEs due to the drug and AEs due to the natural disease progression. For these reasons, we adopted a conservative approach, and the highest score was assigned only when the case fatality rate was > 50%.
Table 1 Criteria and relevant scores to prioritize AEs emerged from disproportionality analysis.A score of 0–2, 3–5, and 6–8 identified, respectively, AEs with low (yellow light), moderate (orange light), or high (red light) priority.
2.7 Case-By-Case Evaluation of AEs with High Clinical Priority
A case-by-case analysis was carried out in the attempt to identify potential drug- and patient-related risk factors. Therefore, reports were further individually inspected to remove potential remaining duplicates (on the basis of high similarity on event date, age, sex, reporter country, co-reported PTs, and co-reported drugs), and to analyze the following clinical features: latency [i.e., time to onset expressed in days with IQR, calculated as the difference between the start of therapy and the date the event occurred], and concomitant drugs as plausible risk factors for AE occurrence or being a proxy of a disease associated with AE susceptibility or a proxy of a preexisting event.

留言 (0)