
記住我


The eastern and southeastern parts of Asia are remarkably rich in gymnosperm diversity (Liu et al., 2022). Many are endemic there, such as the so-called ‘relicts’ and monotypic Ginkgo L. (Ginkgoaceae), Taiwania Hayata and Metasequoia Hu & W.C.Cheng (both Cupressaceae), and Pseudotaxus W.C.Cheng (Taxaceae), that remain in only a few isolated locations, while related species have all become extinct around the world (Tang et al., 2018; Kou et al., 2020; Liu et al., 2022). Other relic gymnosperms residing in East Asia, particularly evergreen gymnosperms, however, are widely distributed and have greatly diversified (López-Pujol et al., 2011; Tang et al., 2018; Liu et al., 2022). Taxus, commonly referred to as the yew tree, is a gymnosperm genus of the order Cupressales which is widely distributed across the temperate Northern Hemisphere region and reaching the tropics in Malesia (Yang et al., 2022). Regions in the contemporary subtropical mainland Asia and Southeast Asia are important refugia for relic species that evolved before the late Tertiary and early Quaternary Periods because continental glaciers did not reach this area during glacial maxima (Axelrod et al., 1998). Glacial–interglacial cycles will have allowed expansions and contractions of populations during cooler and warmer periods, respectively, allowing and severing gene flow in these areas that resulted in the formation of 11 Taxus lineages in East and Southeast Asia by the Late Miocene, with another lineage covering entire Europe (Liu et al., 2011; Liu et al., 2018; Fu et al., 2019).
Due to the intricate topography of East Asia, more recent glacial–interglacial cycles in the Pliocene/Pleistocene may have affected gene flow in Asian yew populations more pronounced (Zhang et al., 2009; Jia et al., 2022). Earlier analyses of the population genetics of the East Asian Taxus species demonstrated a notable level of genetic differentiation across various regions, particularly along separated mountain ranges, specifically among populations of the Himalaya–Hengduan Mts., Qinling Mts., and Mt. Emei and on the east and west sides of the Wuyi–Nanling mountain range (Gao et al., 2007; Zhang et al., 2009; Möller et al., 2013; Liu et al., 2018; Qin et al., 2023).
The distribution of East Asian Taxus species also extends to the continental island of Taiwan and the tropical oceanic islands of the Philippines and Indonesia (Moller et al., 2020; Kamal et al., 2023). However, phylogeographic and genetic diversity studies on island Sumatran yew suggested their genetic identity belongs to T. mairei and there exists no genetic variation among wild populations, indicating they are recent migrants (Rachmat et al., 2016; Kamal et al., 2023). On the other hand, all other phylogeographic analyses on the Northern Hemisphere Taxus using both cpDNA and nuclear markers, although with very limited individual samples, suggest Taiwanese and Philippine yews, diverged as very distinct island-migrating lineages sister to all other southern China Taxus, T. mairei, and T. calcicola (Gao et al., 2007; Zhang et al., 2009; Liu et al., 2011; Liu et al., 2018; Fu et al., 2019; Möller et al., 2020). These Taiwanese and Philippine Taxus may have followed a similar colonization history.
Although the phylogeography and genetic differentiation of Taxus species in continental Asia have been relatively well-studied, much less is known for the migration history and divergence of Taxus species occurring on islands such as those in Taiwan and the Philippines. Based on only one population sample, the cpDNA or ISSR haplotypes of Taiwanese Taxus were found closely linked to Taxus mairei haplotypes in mainland Asia (Gao et al., 2007; Zhang et al., 2009). Interestingly, with only three individuals of Philippine Taxus being included, barcoding analyses suggested that the Philippine yew was very closely related to the Taiwanese yew (Liu et al., 2011; Liu et al., 2018; Fu et al., 2019). Taxus populations from Taiwan and the Philippines have, therefore, been suggested to represent T. phytonii recently (Liu et al., 2018). Molecular clock estimation based on cpDNA markers suggested that colonization of the Taiwanese yew from mainland China was approximately 3.5 million years ago (Mya) likely during a glacial maximum (95% HDP: 1.0–8.3 Mya) (Möller et al., 2020). This implies that these island yews are not young and recent migrants but maybe considerably old.
Although most of the cool temperate origin East Asia Taxus species are distributed in the middle of the genus’ natural range in mainland Asia, the insular T. phytonii populations in Taiwan and the Philippines, therefore, exist as the leading edge for Taxus species, living at their ecological limits, that is, the subtropical and tropical habitats. Because these insular T. phytonii populations are found only surviving at high mountains as isolated interglacial patches, these leading-edge island yews may contain the genetic signature of Pleistocene glacial refugia as important hotspots for preserving the Taxus genetic diversity (Myers et al., 2000; Tang et al., 2018). In comparison to the central populations, the leading edge is important to understand how the founder populations were established and whether these populations confer climate-adaptive traits (Petit et al., 2003; Hampe and Petit, 2005). In particular, the colonized individuals of these subtropical/tropical leading-edge populations might contain heat stress-adapted genetic alleles, which could be very valuable for the conservation of genetic diversity in Taxus species. Genetic identification on these island yew populations is also crucial, providing they are the final missing pieces of the DNA barcode reference library, while all other mainland Asia and global Taxus species have been investigated (Liu et al., 2011; Liu et al., 2018).
Realizing the colonization history of these insular T. phytonii is equally important as this helps unravel the possible routes of usual overseas long-distance dispersal of Taxus migration (e.g., Taiwan Strait >130 km wide; Luzon Strait >250 km). For the dispersal of Taxus from continental Asia to Taiwan, it might be explained by migration during glacial maxima over land bridges connecting mainland China and Taiwan (Ota, 1998). For the migration to the Philippines, this implies not only the occurrence of long-distance dispersal of Taxus species but also hypotheses such as tectonic movement, stepping stone islands, and land bridges (Pleistocene sea level fall during glacial maximum) have been suggested for the formation of Philippines’ flora (Hughes et al., 2015). Taxus seeds are surrounded by red, fleshy arils, which attract birds and are thus well-suited for endozoochorous long-distance dispersal (Wilson et al., 1996; Thomas and Polwart, 2003). Thus, Taxus populations in continental Asia and southeastern Asian islands might have been subjected to migrations and vicariance events, as influenced by climate fluctuations (Jia et al., 2022). Inferring the effects of these events from the molecular evolutionary rates could help reveal the phylogeographic history of insular Taxus in East Asia.
In this study, we have assembled 179 individuals in total from nine and two populations from Taiwan and the Philippines, respectively. Our main aims are, therefore, as follows: (1) to reconstruct phylogenetic trees and haplotype networks using both cpDNA and nuclear markers to infer the genealogical relationships of insular T. phytonii and their sister lineages in East Asia; (2) to perform gene flow direction analyses to deduce the origin and the possible colonization routes of insular T. phytonii; and (3) to calculate the divergence time of insular T. phytonii to interpret the post-divergence migration events between T. phytonii and East Asian Taxus. The results shall extend our understanding of the evolutionary history of these insular Taxus populations and whether they retain the refugial genetic signature for considering conservation.
Materials and methodsTissue sampling and molecular markersYoung, healthy leaves were collected and quickly dried in silica gel from 141 and 38 individual trees of T. phytonii (as T. sumatrana in Liu et al., 2011) from Taiwan and the Philippines, respectively. Serving as comparative materials, samples were also collected from 105 T. mairei (=T. wallichiana var. mairei in Gao et al., 2007), a taxon closely allied to T. phytonii both geographically and phylogenetically (Gao et al., 2007; Liu et al., 2011; Fu et al., 2019). We also included five other Taxus samples from higher elevations (>1,500 m a.s.l.) of Huangshan, China; we followed Möller et al. (2020) to refer to this taxon as the Huangshan type. Given the close geographic proximity of Huangshan to Taiwan, genetic exchanges may also have occurred between these places during past glacial maxima. For yew taxa described above, sampling was carried out in a total of 19 populations (Figure 1; Table 1).
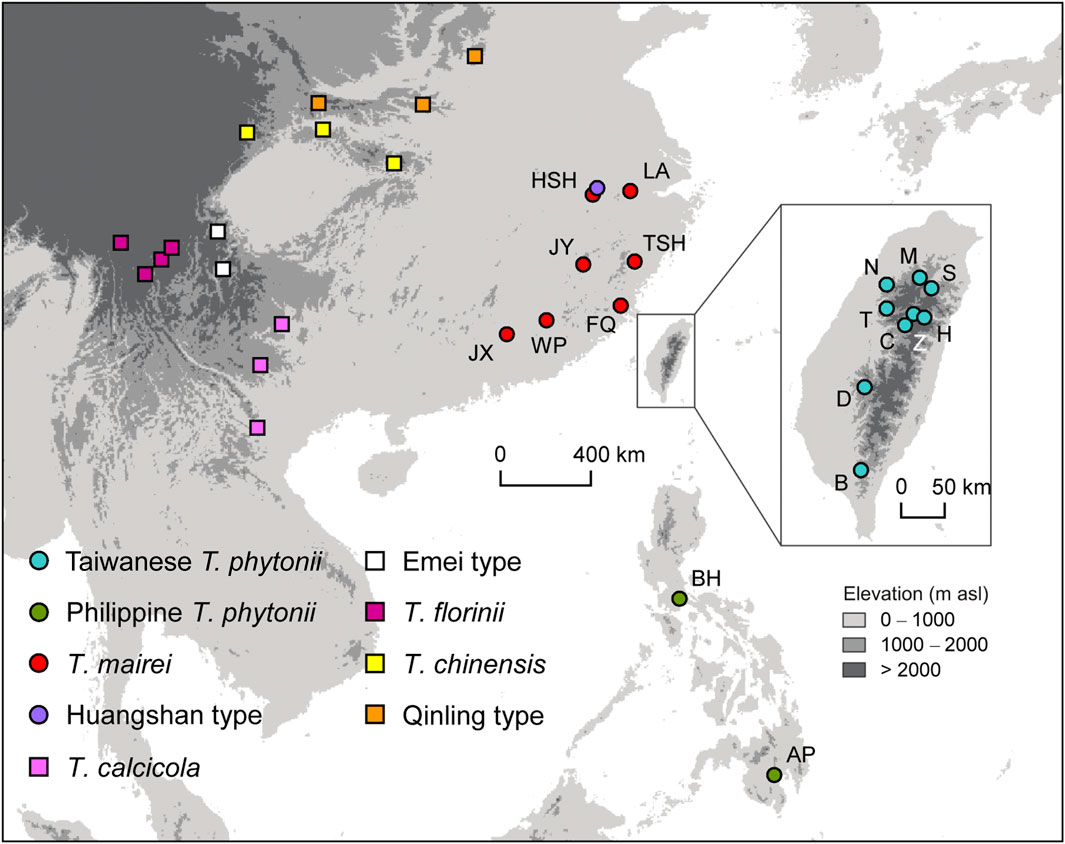
Figure 1. Map showing sampling sites of all Taxus taxa included in the study. Circles and squares denote populations which have DNA sequences newly generated in this study or obtained from public databases, respectively. Codes for taxa marked by circles are shown in Table 1.

Table 1. Sampling of four Taxus taxa. Measures of genetic variability based on chloroplast DNA or the nuclear ITS markers are provided. Based on the ITS variability, samples from Mt. Apo, Mindanao, show a significant deviation from the Hardy–Weinberg equilibrium (FIS shown in bold).
DNA was isolated from silica gel-dried leaves following a standard CTAB procedure (Doyle, 1991), with modifications: buffer consisting of 4% CTAB (Amresco, United States of America) (instead of 2%) and 200 mM Tris-HCl (J.T. Baker, United States of America) (instead of 100 mM); a pinch of PVPP (Sigma, United States of America) was freshly added before adding the CTAB buffer to the ground tissue samples. Among the four cp DNA markers (i.e., trnL-F, trnH-psbA, petG-trnP, and atpI-H) plus one nuclear marker (internal transcribed spacer of the 18S-5.8S-26S ribosomal cistron, and ITS) were selected following previous literature reports. Three of these markers (trnL-F, trnH-psbA, and ITS) were selected following previous literature reports in an attempt to join sequencing efforts, allowing the sample comparison of T. phytonii to other East Asian Taxus. In trying to add up more sequence polymorphism for resolving Taxus phylogeography, two additional chloroplast markers petG-trnP and atpI-H were used because they have been found useful to reconstruct gymnosperm phylogeny (Chou et al., 2011).
Marker amplification protocols and procedures are detailed in Supplementary Appendix S1 (with used primers listed in Supplementary Table S1). For ITS, 169 of the 289 samples (59%) across the four analyzed taxa had heterozygous single-nucleotide positions and/or indels (shown as double peaks in electropherograms at or after specific nucleotide sites), and for each such case, various approaches were undertaken to uncover the two haplotypes for each individual (detailed in Supplementary Appendix S1). Marker-wise sequence alignments were carried out with muscle v3.8.31 (Edgar, 2004) implemented in MEGA 11 (Tamura et al., 2021). The recombination-free inheritance nature of cpDNA (Birky, 2001) would render the cp genome as a whole, behaving as a single locus, although certain cp regions in yews have reported the existence of isomeric forms. Consequently, we concatenated the four cp markers by individuals in all subsequent analyses.
Genetic variability and population clusteringGenetic variability within populations (defined by sampling sites) of the four focal Taxus taxa was assessed with measures including the haplotype diversity (Hd, Nei and Tajima, 1981), nucleotide diversity (π, Nei and Li, 1979), and Watterson’s (1975) theta (θW), all calculated in DnaSP v.6.12.03 (Rozas et al., 2017). The within-individual ITS variation in more than half of the analyzed individuals might indicate that this marker is not completely homogenized as is typically expected (Baldwin et al., 1995). We, thus, assessed conformity of ITS variation to the Hardy–Weinberg equilibrium (HWE), a status presumably achieved when the marker was biparentally inherited as a single locus. Alternatively, a deviation from the HWE in the form of heterozygote excess is expected in cases where incomplete concerted evolution only homogenized intra-locus variation but not that across different loci within the genome (Karvonen and Savolainen, 1993). We treated different ITS haplotypes as different alleles, with which Weir and Cockerham’s (1984) FIS was calculated as a measure of HWE deviation levels (zero for no deviation, and positive and negative values for heterozygote excess and deficiency, respectively). A Markov chain algorithm (Guo and Thompson, 1992) was used to evaluate significance of deviation from the HWE, with Bonferroni multiple-testing corrections applied to control a table-wide error rate of <0.05. These examinations on population-wise HWE were carried out in Genepop v.4.2 (Raymond and Rousset, 1995; Rousset, 2008).
We examined further whether variation among populations of the same taxon was smaller than that among different taxa. To this end, we quantified genetic differentiation between pairwise populations using ΦST (Excoffier et al., 1992). We then constructed cp and ITS neighbor-joining trees (NJ, Saitou and Nei, 1987; Saitou and Nei, 1987) based on ΦST values and examined whether populations were clustered according to the taxon identity. We further conducted Φ-statistic-based analyses of molecular variance (AMOVA, Excoffier et al., 1992) to quantify the genetic variation partitioned along a hierarchical structure of grouping ranks from among taxa to within populations (or within individuals for ITS). Permutation tests were undertaken to assess the significance of partitioned variation at different ranks (2,000 permutations for each). Both ΦST calculations and AMOVA were carried out in Arlequin v.3.5.2.2 (Excoffier and Lischer, 2010), while NJ tree constructions were carried out with the ape and phytools R packages (Revell, 2012; Paradis and Schliep, 2019).
Haplotype tree and network reconstructionsCp and ITS haplotype trees and networks were reconstructed for investigating the genealogical relationships of the four focal taxa with each other and with the other East Asian Taxus. For this, cp sequences from Fu et al. (2019) and ITS sequences from Liu et al. (2011) for East Asian taxa (Supplementary Tables S2, S3 of Supplementary Appendix S1) were pooled with our newly acquired data for combined analyses. The Bayesian calculation implemented in MrBayes v.3.2.7 (Ronquist et al., 2012) was used for haplotype tree reconstructions. To root the trees, two Taxaceae species, Pseudotaxus chienii and Cephalotaxus manni, were included as the outgroup (Supplementary Tables S2, S3 of Supplementary Appendix S1). The GTR + G and the HKY + G nucleotide substitution models (Hasegawa et al., 1985; Tavaré, 1986; Yang, 1994) were specified for the cp and the ITS datasets, respectively, both of which were selected using jModelTest v.2.1.3 (Darriba et al., 2012). For each marker, two replicate runs of Metropolis-coupled Markov chain Monte Carlo (MCMC) were performed, with the incremental heating scheme applied to improve the exploring of the parameter space. The MCMC was run for 1,000,000 iterations (every 500th iteration for a sample), discarding the initial 100,000 iterations as burn-in.
The haplotype networks were built using the statistical parsimony (SP) algorithm (Templeton et al., 1992) implemented in TCS v.1.21 (Clement et al., 2000). In each analysis, a p-value of >0.95 for parsimonious connections was adopted to join haplotypes into a single network; otherwise, separate networks were built. To incorporated indel events into genealogical reconstructions, we applied Simmons and Ochoterena (2000) ‘simple indel coding’ method implemented in FastGap v.1.2 (Borchsenius, 2009).
Post-split migration detectionWe identified from the reconstructed haplotype networks shares of lineages between T. mairei and T. phytonii and between the two T. phytonii gene pools from Taiwan and the Philippines. Such lineage sharing could stem from migrations between divergent taxa (called ‘post-split migrations’ for they occur after the taxa started to diverge) or, alternatively, could represent incomplete lineage sorting events, a legacy of lineages present in the common ancestor of these taxa. To distinguish between these two scenarios, we performed a Bayesian analysis which was based on the isolation with migration (IM) model implemented in IMa2 (Hey and Nielsen, 2007; Hey, 2010) to assess the presence of post-split migrations.
Applied to T. mairei and T. phytonii from Taiwan and the Philippines, respectively, we specified the topology of taxon divergence as [(Taiwanese T. phytonii, Philippine T. phytonii), T. mairei] based on our haplotype network reconstruction results and from aforementioned publications (Liu et al., 2018; Fu et al., 2019; Möller et al., 2020). We specified the HKY nucleotide substitution model (Hasegawa et al., 1985) implemented in IMa2 for both cp and ITS sequence sets. CpDNA is haploid and, in Taxus, paternally inherited (Anderson and Owens, 1999), and our HWE tests suggested ITS, following a single-locus biparental inheritance mode in the focal taxa (see Results). Accordingly, we set inheritance scalars of cpDNA and ITS to 0.25 and 1, respectively. Truncated uniform priors were implemented in IMa2 for demographic parameters including the rescaled post-split migration rates (m), the composite parameters for effective population sizes (q), and the composite parameters for split times between taxa (t). Upper bounds of m, q, and t priors were set to 1.5, 9, and 6, respectively, which were derived under synthetic considerations over the manufacturer’s suggestions (Hey, 2011) and results from pilot exploratory runs (detailed in Settings for demographic priors and Supplementary Table S4 of Supplementary Appendix S1). A Bayesian calculation was carried out with three independent runs of Metropolis-coupled MCMC, using a geometric heating scheme with 40 heated chains and heating parameters ha = 0.95 and hb = 0.80 for each run. The MCMC was initially run for 3,00,000 iterations for burn-in, followed by additional one million iterations for sampling (every 100th iteration for a sample). To convert resultant q and t estimates to effective population sizes (Ne) and divergence times in absolute years, respectively, we specified locus-wide mutation rates of cpDNA and ITS as 1.67E-6 and 1.24E-6 per year, respectively (see Clock rates of chloroplast DNA and ITS for Taxus and Supplementary Table S5 of Supplementary Appendix S1) and a Taxus generation time of 25 years (Wang et al., 2006). Finally, the presence of post-split migrations between taxon pairs was evaluated using likelihood ratio tests proposed by Nielsen and Wakeley (2001) based on estimated population migration rates 2Ne × M (M for the proportion of migrants per population per generation).
Inference of the colonization directionWe performed the cp- and the ITS-based multi-type tree (MTT) analyses to investigate Taxus migration events connecting Taiwan and the Philippines. To infer colonization history, we performed Bayesian analyses based on the single-locus MTT) (Vaughan et al., 2014) coalescent models to trace the location (either Taiwan or Philippines) of individual lineages and their switching between locations along the gene tree. Importantly, De Maio et al. (2015) demonstrated that MTT provided unbiased inferences under highly uneven sample sizes associated with different locations, as in our case. We aimed to infer emigrations from one of the two insular Taxus regions that first time colonized the other one, which resulted in the Taxus origin in the latter region. The entry sequences of our MTT analyses were those constituting the insular haplogroup.
The MTT analyses were performed in BEAST v.2.7.6 (Bouckaert et al., 2019). For both the cp- and ITS-based analyses, we specified nucleotide substitutions, following the F81 model (Felsenstein, 1981), selected using jModelTest v.2.1.3 (Darriba et al., 2012). For time calibrations, we specified the following lognormal clock rate priors: log (mean) = −4.93 and log (standard deviation) = 0.27 for cpDNA; log (mean) = −4.50 and log (standard deviation) = 0.27 for ITS (see Clock rates of chloroplast DNA and ITS for Taxus and Supplementary Table S5 of Supplementary Appendix S1 for details). Truncated uniform priors each with an upper bound = 1 and lognormal priors each with a log (mean) = 0 and log (standard deviation) = 4 were used for population size and migration rate parameters, respectively (see Settings for demographic priors of Supplementary Appendix S1 for setting rationales). For each of the cp- and ITS-based analyses, we constructed two independent MCMC that each was run for 100 million iterations (every 100,000th iteration for a sample) with the initial 10% discarded as burn-in. MCMC convergence between the two replicate runs was examined with Tracer v.1.7.2 (Rambaut et al., 2018), and the results were combined to give an effective sample size (ESS) of >200 per parameter.
ResultsGenetic variability and population clustering of the four focus yew taxaFrom the four focus yew taxa, namely, Taiwanese T. phytonii, Philippine T. phytonii, T. mairei, and Huangshan type, we identified eight cp haplotypes based on the concatenated cp sequences (see Supplementary Figure S1A of Supplementary Appendix S2 for source populations of these haplotypes). The populations of the four taxa showed modest cp genetic variability, with haplotype diversity (Hd), nucleotide diversity (π, per nucleotide site), and Watterson’s theta (θW, per nucleotide site) being 0–0.51, 0–0.00076, and 0–0.00119, respectively (Table 1). We identified from the four taxa totally 32 ITS haplotypes (source populations shown in Supplementary Figure S1B of Supplementary Appendix S2). ITS-based Hd, π, and θW values were between 0.21 and 0.91, 0.00038 and 0.00394, and 0.00046 and 0.00481, respectively (Table 1), which were higher than the corresponding cp-based values. In general, populations of the Philippine T. phytonii bore lower genetic variability compared to those of the other three taxa (Table 1).
All Taxus populations examined had ITS variation conforming to HWE except the Philippine T. phytonii population on Mt. Apo, Mindanao (AP), which showed significant excess of heterozygotes (FIS = −0.9, Markov chain estimation p = 0 after Bonferroni correction; Table 1). Provided that most populations conformed to the HWE and did not show uniformly positive or negative FIS values (refuting that ITS variation was subject to specific systematic biases), we assumed ITS to follow a single-locus biparental inheritance mode in downstream analyses.
Constructed with pairwise ΦST values, the cp- and ITS-based NJ trees consistently grouped the 19 studied populations by taxon (Figure 2), suggesting the four taxa to be genetically well-distinct from one another. Concordant to these findings, cp- and ITS-based AMOVA both assigned much greater fractions of the total genetic variation to inter-taxon differentiation (86.9% and 75.1% for cp- and ITS-based analyses, respectively) than to inter-population differentiation within taxa (5.5% and 3.0% for cp- and ITS-based analyses, respectively) despite significant genetic structure detected at these two hierarchical levels (permutation tests, p < 0.001; Table 2). Overall, the above population clustering analyses indicate each of Taiwanese T. phytonii, Philippine T. phytonii, T. mairei, and Huangshan type, representing a genetically distinct unit.
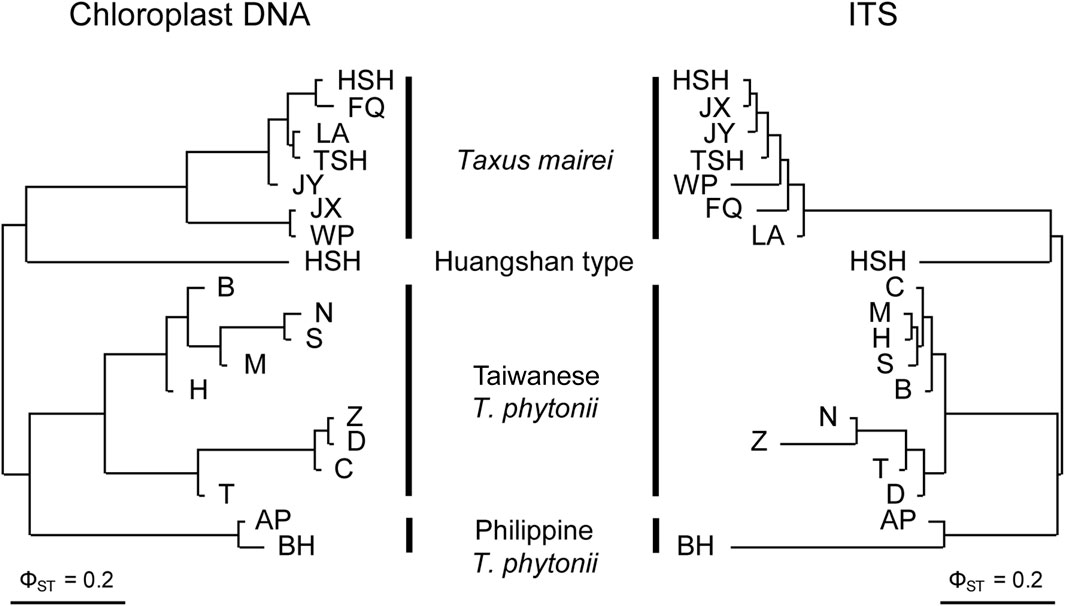
Figure 2. Neighbor-joining clustering trees of Taiwanese T. phytonii, Philippine T. phytonii, T. mairei, and Huangshan-type populations based on chloroplast DNA (left) and nuclear ITS (right) genetic variation. Trees built using pairwise ΦST between populations.

Table 2. Chloroplast (cp) DNA- and ITS-based analyses of molecular variance (AMOVA) for hierarchical genetic structure among and within Taiwanese T. phytonii, Philippine T. phytonii, T. mairei, and Huangshan type. Fixation indices ΦCT and ΦSC measure genetic divergence among taxa and among populations within taxa, respectively, while ΦIS measures inbreeding extent within populations. p-values are obtained through permutation tests (one-tailed tests with 2,000 permutations for each).
Haplotype genealogies connecting the East Asian yew taxaAs consistently revealed by the reconstructed haplotype trees and networks, East Asian Taxus typically had haplotypes grouping according to taxon identities (Figure 3). The recovered genealogies verified that the two insular yew taxa, Taiwanese T. phytonii and Philippine T. phytonii, represented each other’s closest relative (Figure 3). Considering together with the fact that Taiwan and the Philippines were constantly isolated from each other by the Luzon Strait, the aforementioned finding implies a colonization history of either an earlier origin of Taiwanese T. phytonii which later sent migrants to give rise to Philippine T. phytonii or the other way round.
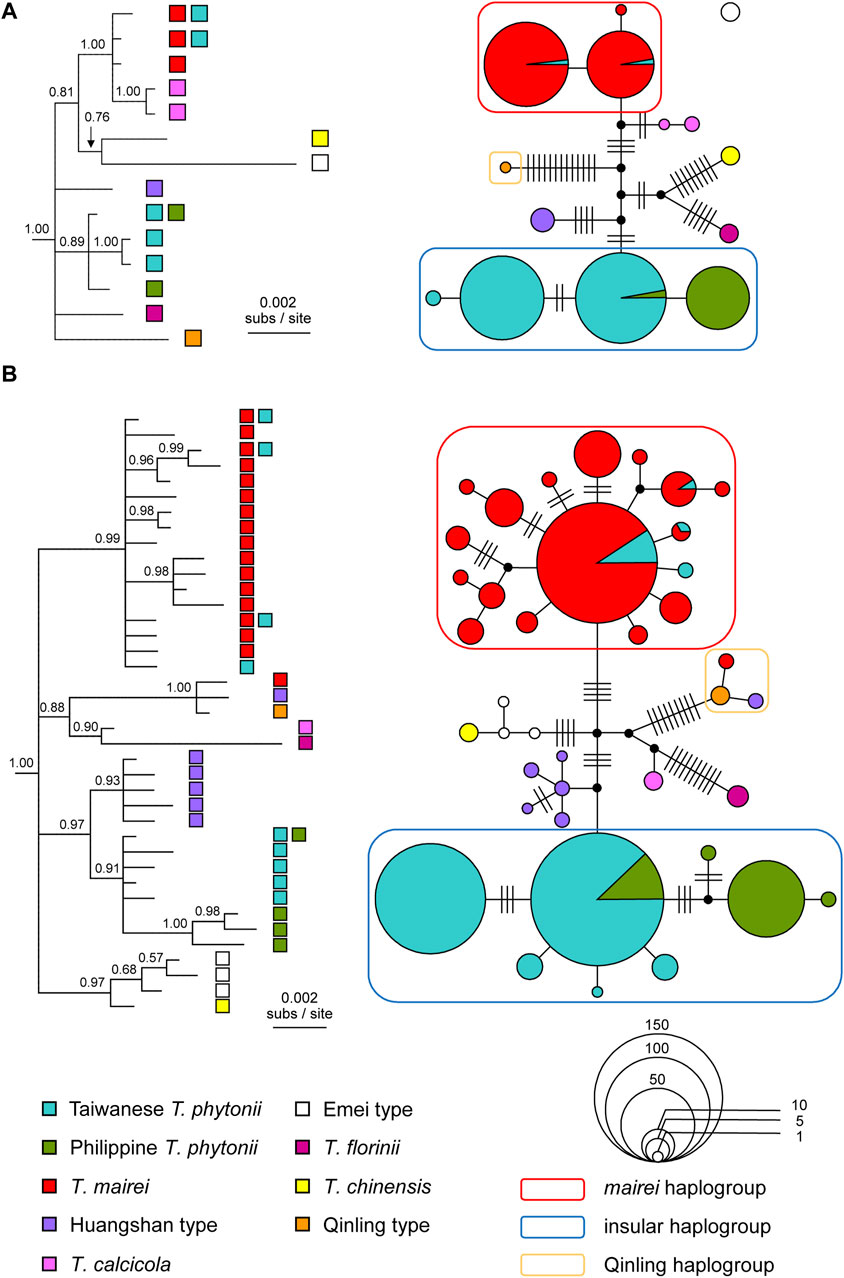
Figure 3. Bayesian consensus trees and statistical parsimony networks reconstructed based on (A) chloroplast DNA and (B) ITS haplotype sequences from selected East Asian Taxus taxa. The trees are rooted with Pseudotaxus chienii and Cephalotaxus manni. Tree tips are labeled with the source taxa of the haplotypes. Node support values are shown above branches as posterior probabilities. The networks, which are unrooted, have individual haplotypes shown by either filled circles or pie charts, colored according to the source taxa and sized in proportion to the sample sizes. Hatch marks denote mutational steps that separate different haplotypes. It should be noted that the statistical parsimony connection algorithm groups cp haplotypes into two separate networks, consisting of a single haplotype from the Taxus Emei type (an empty dot without any connection to all other haplotypes) and all the other haplotypes.
Among identified haplotype groups, one group almost exclusively comprised T. mairei sequences but with a small number of sequences from Taiwanese T. phytonii (the ‘mairei haplogroup’ in Figure 3). There was a second haplotype group which contained all the rest Taiwanese T. phytonii sequences plus all Philippine T. phytonii sequences (the ‘insular haplogroup’). Within this latter haplogroup, all except one haplotype were exclusive to either Taiwan or the Philippines; the only shared haplotype of these two regions was predominant and widespread in Taiwan, while it was less abundant and restricted to Mt. Apo (AP), Mindanao of the Philippines (Figure 3 and Supplementary Figure S1 of Supplementary Appendix S2). These cases of lineage sharing between Taxus taxa, the rarer haplotypes in Taiwan belonging to the mairei haplogroup and the rarer haplotype in the Philippines belonging to the insular haplogroup, could result from recent migration events that brought genes from one taxon to another one, more specifically, from T. mairei to Taiwanese T. phytonii and from Taiwanese T. phytonii to Philippine T. phytonii. Alternatively, shared lineages could be a legacy of those present in the common ancestor of divergent taxa, namely, incomplete lineage sorting. To distinguish between these alternative explanations, we further applied an IM analysis to T. mairei, Taiwanese T. phytonii, and Philippine T. phytonii (see below).
Our ITS-based genealogical reconstructions identified a haplogroup that was remotely related to all the others, comprising a single haplotype from the Taxus Qinling type and other two each from one of T. mairei and the Huangshan type (the ‘Qinling haplogroup’ in Figure 3B). The latter two haplotypes each represented a one-mutational-step outer edge of the Qinling-type haplogroup (Figure 3B), indicating them to be recent descendants of the Qinling type haplotype. In other words, there were recent introgression events from Qinling type into T. mairei and Huangshan type. We excluded the introgressed T. mairei haplotype from the subsequent IM analysis which focused on potential migration events among T. mairei, Taiwanese T. phytonii, and Philippine T. phytonii.
Detections of post-split migrations among Taxus mairei and the two insular T. phytonii populationsConsistent estimations were obtained from the three IM replicate runs, which were then combined to obtain a final result. Among the post-split migration parameters modeled, we obtained non-zero modal estimates for T. mairei to Taiwanese T. phytonii migrations (2Ne × M = 0.40 per generation) and Taiwanese T. phytonii to Philippine T. phytonii (2Ne × M = 0.16 per generation; Figure 4 and Table 3), suggesting the presence of migration events. The likelihood ratio tests gave strong statistical support for the T. mairei to Taiwanese T. phytonii migrations (p < 0.001) but not for the Taiwanese T. phytonii to Philippine T. phytonii migrations (p = 0.066; Table 3). We obtained modal estimates for the effective population sizes (Ne) of T. mairei, Taiwanese T. phytonii, and Philippine T. phytonii as 16,400, 6,900, and 2,700 individuals, respectively (Table 3). We obtained an estimate of the divergence time between Taiwanese T. phytonii and Philippine T. phytonii accompanied with a very broad confidence interval as 1.56 Mya (95% HPD, 0.006–3.52 Mya); additionally, we obtained a modal estimate of the divergence time of 4.12 Mya (95% HPD, 1.51–4.16 Mya) between T. mairei and the common ancestor of the two insular taxa at the set parameter upper bound (Table 3). We emphasize that rather than reflecting an inappropriately set upper bound of the parameter, the reaching of the modal value to the upper bound resulted from an interaction between the priors and the fixed topology of the inter-taxon splits (which imposed a constraint on the sequential divergence times). We demonstrated this by performing an additional IM analysis without inputting data (the ‘prior-only’ analysis). We obtained from this prior-only analysis a modal estimate of the corresponding parameter reaching the set upper bound as in the formal run (Supplementary Figure S2 of Supplementary Appendix S2). In general, the acquired time estimates reflected limited power from a two-locus dataset in resolving the focal parameters with IM models (Hey, 2010).
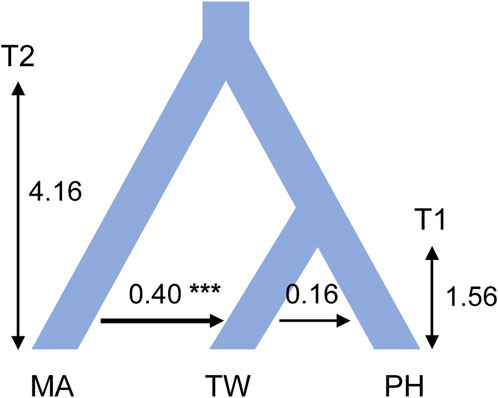
Figure 4. Modal estimates of divergence times and post-split migrations from an isolation with migration analysis that models the divergence process among Taxus mairei (MA), Taiwanese T. phytonii (TW), and Philippine T. phytonii (PH) populations. Sequential divergence times T1 and T2 are in million years. Post-split migrations, with their directions indicated by the arrows, are migrant autosome numbers per generation. The plot only shows post-split migrations that have modal estimates of more than zero (*** denotes p-value of <0.001 from a likelihood-ratio test). Demographic parameters described above have their associated 95% highest probability density intervals provided in Table 3.
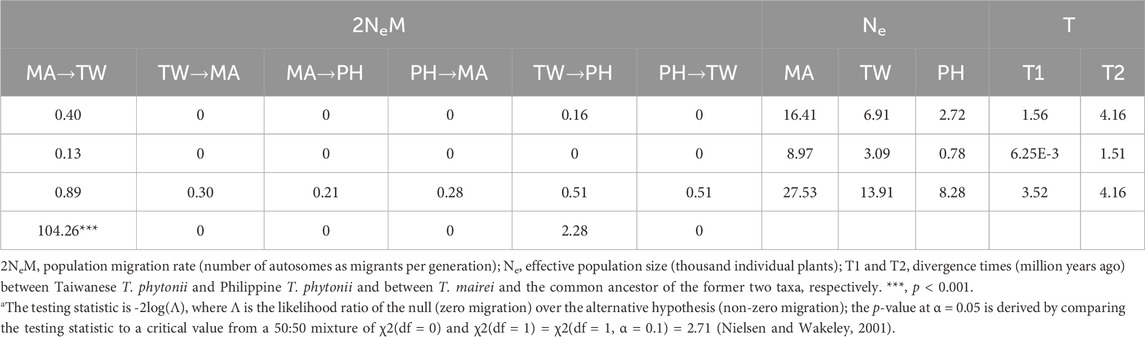
Table 3. Isolation with migration (IM) analysis for the divergence process among T. mairei (MA), Taiwanese T. phytonii (TW), and Philippine T. phytonii (PH). Estimates of demographic parameters are shown in consecutive rows as modes, lower 95% highest probability density limits (95HPDIs) and upper 95HPDIs. For post-split migration rates (2NeM), values are shown in the fourth row for the likelihood ratio test statistica.
Movements of Taxus lineages between Taiwan and the PhilippinesBoth cp- and ITS-based MTT analyses inferred that there were most likely two incursion events from Taiwan to the Philippines but zero from the Philippines to Taiwan (Supplementary Figure S3 of Supplementary Appendix S2). Visualized on the gene trees (Figure 5), the more ancient Taiwan-to-Philippine incursion event resulted in lineages currently distributed in both Philippine sites BH and AP (cp haplotype #8 and ITS haplotypes #28–30 in Supplementary Figure S1). This incursion event, presumably corresponding to the origin of Philippine T. phytonii, was followed by a more recent one in the same direction that contributed to the rarer Philippine T. phytonii lineage found in AP (cp haplotype #5 and ITS haplotype #23 in Supplementary Figure S1).
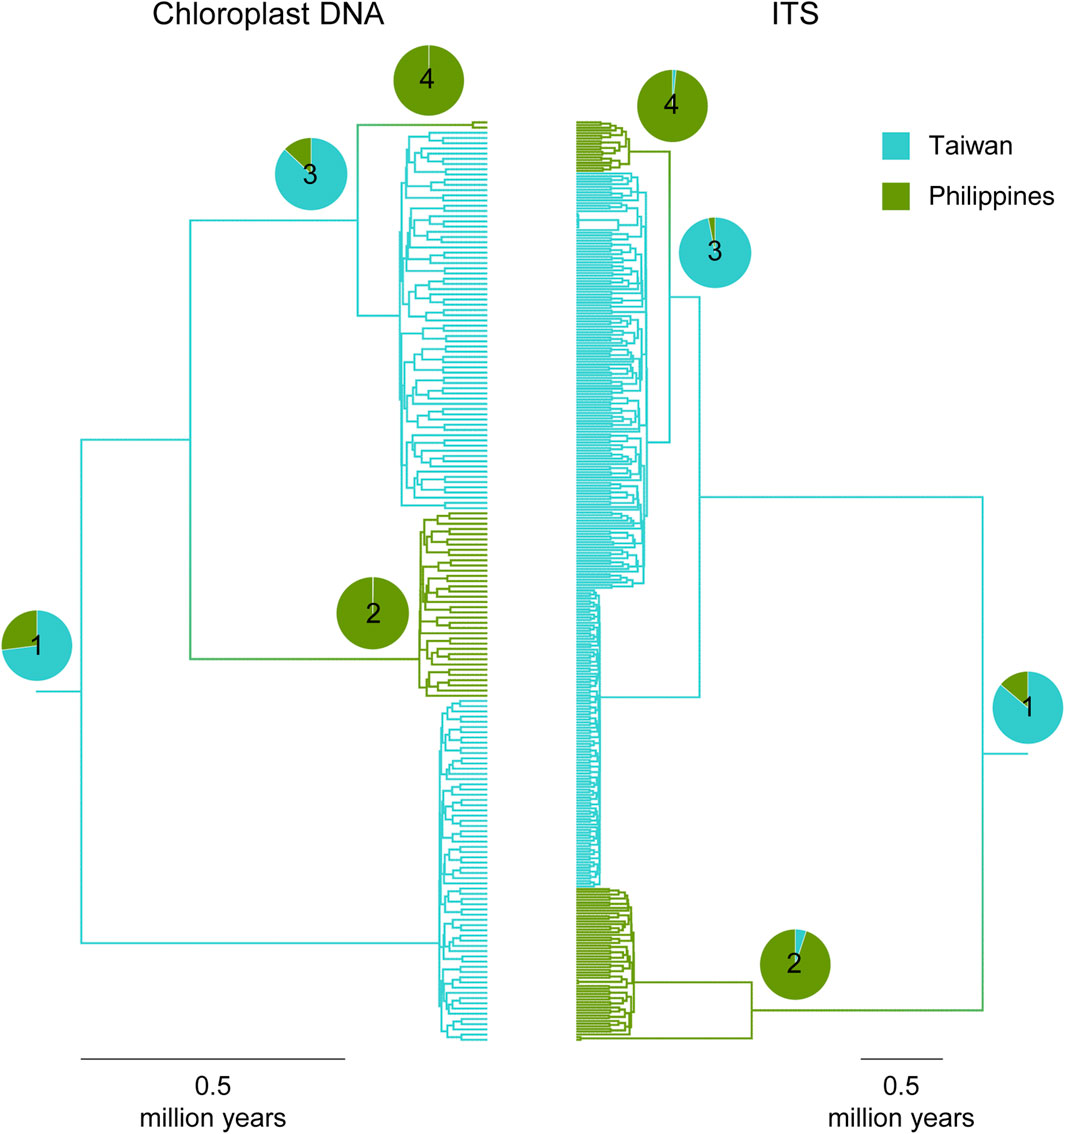
Figure 5. Multi-type tree inferences on ancestry locations (either Taiwan or Philippines) of Taiwanese T. phytonii and Philippine T. phytonii. Plots show maximum clade credibility coalescent trees, with individual lineages colored according to the most likely locations inferred. For selected tree nodes (#1–4), the full posterior distributions regarding their locations are presented by pie charts. Time estimates associated with these selected tree nodes are provided in Supplementary Table S6 of Supplementary Appendix S2.
Regarding the MTT-recovered evolutionary history, we provided date estimates for some time points, described as follows. First, the most recent common ancestor (MRCA) of all Taiwanese T. phytonii and Philippine T. phytonii lineages (node #1 in Figure 5) was dated to 0.77 and 2.49 Mya based on cpDNA and ITS, respectively (mean estimates, with associated 95% confidence sets provided in Supplementary Table S6 of Supplementary Appendix S2). This provided a lower limit when Taiwanese T. phytonii had already existed. Second, the MRCA of the more-ancient lineages of Philippine T. phytonii (node #2 in Figure 5) was dated to 0.13 and 1.08 Mya based on cpDNA and ITS, respectively. Likewise, Philippine T. phytonii had originated before this date. The third and the fourth time points, nodes #3 and #4 in Figure 4, respectively, bracketed the duration when Taiwanese T. phytonii secondarily emerged in the Philippines; the arrival of AP there was dated to 0.03–0.25 and 0.32–0.57 Mya based on cpDNA and ITS, respectively.
DiscussionOrigin and colonization routes of insular T. phytoniiIn this study, population-based pairwise NJ clustering trees from both cpDNA and nuclear markers consistently indicated Taiwanese T. phytonii and Philippine T. phytonii, each representing a genetically distinct unit which was also distinct from the other Chinese mainland-related Taxus populations, T. mairei, and the Huangshan type (Figure 2; Table 2). This relationship was not completely conclusive in previous phylogeographic studies (Gao et al., 2007; Zhang et al., 2009; Möller et al., 2020) or Global/Eurasian yew barcoding analysis (Liu et al., 2011; Liu et al., 2018) due to insufficient or no sampling of both the two insular T. phytonii populations. Furthermore, we dissected the historical genetic relationships between Taiwanese T. phytonii and Philippine T. phytonii, with cp- and ITS-based haplotype genealogies based on samples from nine Taiwanese populations (total n = 141; Table 1) and two Philippine populations (total n = 38). The result revealed a sister relationship between Taiwanese T. phytonii and Philippine T. phytonii to the exclusion of other East Asian Taxus (Figure 3). This was followed by a conclusion from the cp- and ITS-based MTT analyses which inferred the genes’ most recent common ancestors (MRCAs) to be more likely located in Taiwan (Figure 5) and thus supported that Philippine T. phytonii was derived from Taiwanese T. phytonii.
As to the origin of T. phytonii, Möller et al. (2020) suggested a southward diversification wave of Taxus from Central China, with one of several lineages crossing the Taiwan Strait at ∼3.5 Mya to form T. phytonii. This time estimate may be quite reliable because the reconstructed dated phylogeny used 13 chloroplast genes and two nuclear markers and included all 16 extant Taxus taxa lineages of the world. However, the sequential establishments of T. phytonii populations, implied by the above suggestion to be first in Taiwan then in the Philippines, had not been formally tested. Empowered by comprehensive sampling over the two insular regions, our results first time confirmed that Taiwanese T. phytonii sent migrants to colonize the Philippines as a part of the southward Taxus range expansion out of Central China, one of this taxon’s diversity core regions (Möller et al., 2020).
Introgression from Taxus mairei to Taiwanese T. phytonii and Taiwan-to-Philippines incursionsWith DNA sequences from other Chinese mainland Taxus analyzed together, the reconstructed cp- and ITS-based haplotype genealogies revealed T. mairei-related haplotypes in Taiwan (Figure 3), suggesting recent migrations from T. mairei to Taiwanese T. phytonii or retentions of ancestral polymorphism. Using the likelihood ratio test adjoined to the IM analysis, we then gained strong support for the presence of recent migrations (MA- > TW migration rate = 0.40, 95% HPD: 0.13–0.89, Table 3), which due to their occurrence between divergent taxa (visualized in Figure 4), were commonly called post-split migrations or introgression.
Similarly, both cp- and ITS-based haplotype genealogies and the IM analysis suggested recent secondary migrations from Taiwanese T. phytonii to Philippine T. phytonii (TW- > PH migration rate = 0.16, 95% HPD: 0–0.51, Table 3 and Figures 3, 4). Moreover, the cp- and ITS-based MTT analyses further inferred the occurrence of a second-time lineage incursion event from Taiwan to the Philippines (Figure 5 and Supplementary Figure S3 of Supplementary Appendix S2), which occurred within the last 0.6 million years (bracketed by MTT tree nodes #3 and #4). This latter incursion event resulted in a cp and an ITS haplotype that were commonly found in Taiwan and Mindanao but not in Luzon (Figure 3; Supplementary Figure S1 of Supplementary Appendix S2), implying recent long-distance dispersal of Taiwanese T. phytonii to Philippine T. phytonii.
With seeds being able to be primarily transported by frugivorous birds endozoochorously (Martinez et al., 2008; Li et al., 2014; Li et al., 2015; Lavabre et al., 2016) and possibly secondarily transported (diploendozoochory) by raptors which prey on and potentially undertake even farther-reaching flight than frugivorous birds (Hamalainen et al., 2017), Taxus may have an extended capacity of overseas dispersal. We speculate the initial establishment of Philippine Taxus by transportation of seeds of Taiwanese Taxus at least across the full length of the Luzon Strait (>250 km) to reach a suitable habitat such as those surviving Philippine T. phytonii individuals at the summit of Mt. Banahaw (2,158 asl) in the Luzon island because no other high mountains left in between. Until our study, commuting of non-volant, terrestrial taxa between Taiwan and main islands of the Philippines was only genetically evidenced in the herb Euphrasia, which were also inferred to colonize Luzon from Taiwan (Wu et al., 2009). Here, the small seeds (1–1.5 mm long, Wu et al., 2009) are considered to be transported by birds epizoochorously. It remains to be clarified how Taxus seeds were secondarily transported from Taiwan to Luzon, and to Mindanao.
Many bird species use Taiwan as a stopover during their autumn southward migrations to the wintering sites in the Philippines and other places (Shiu and Lee, 2003; Yong et al., 2015). These include thrushes of the genus Turdus whose European congeners are the main disperser of Taxus seeds (Martinez et al., 2008; Lavabre et al., 2016). A peak of thrush arrival has been shown in Taiwan at November–December (Chen et al., 2020), matching the period when Taiwanese yews’ fruits (the cup-like arils surrounding the seeds) turn red (Wang and Chien, 2016). Assuming a similar ripening time of Philippine yews’ fruits, this time would be discrepant from that when the birds start to return northerly at April–May (Billerman et al., 2022). Therefore, the prevalent bird migration patterns in the East Asia could be responsible for the observed unidirectional Taxus introgression from Taiwan to the Philippines. Alternatively, the observed MA- > TW and TW- > PH migrations, but not the other way round, could be simply caused by unequal population sizes of these two insular yew populations; between pairs of populations with contrasting sizes, migrations in the two directions would be imbalanced because larger populations send out more migrants than smaller populations do. In line with this second explanation, our IM analysis inferred the largest population in the mainland (T. mairei), followed by a smaller one in the subtropical island (Taiwanese T. phytonii) and the smallest one in the remote tropical islands where suitable habitats are rare and isolated (Philippine T. phytonii) (Table 3).
Divergence time estimation of insular T. phytoniiThe MTT gave uniformly larger age estimates for corresponding tree nodes in the ITS tree than in the cp tree (Supplementary Figure S6 of Supplementary Appendix S2). We attribute this in part caused by the four-fold effective population size difference between the biparentally inherited autosomal maker (ITS) and the uniparentally inherited plastid marker (cpDNA); according to the coalescent theory (Kingman, 1982), a larger effective population size renders a longer time to reach the common ancestor by coalescence. Since the node ages present timing when their descendant lineages had already existed (and so the taxon bearing these lineages), we use the ITS-derived ages as the lower limits of taxon origin dates.
We, thus, infer the origin of Taiwanese T. phytonii predating 2.49 Mya (the mean age for the MTT tree node #1; visualized in Figure 5); the confidence interval associated with this node age (Supplementary Figure S6 of Supplementary Appendix S2) overlapped with 3.5 Mya from Möller et al. (2020)’s estimation for T. phytonii’s origin. The estimated origin of Taiwanese T. phytonii at 2.49–3.5 Mya implies this taxon to be among the first colonizers that migrated to Taiwan, along with other conifers such as Taiwania (1.9–2.5 Mya) and Chamaecyparis (1.3–2.9 Mya) (Wang et al., 2003; Chou et al., 2011).
Frequent land bridges were emerged in connecting Chinese mainland and Taiwan during glaciation maximum in Pliocene and Pleistocene due to the shallow sea level of the Taiwan Strait (Ota, 1998). Specifically, the proximity of the island to the continent (<200 km) with a shallow continental shelf in between (<100 m in depth) provided chances to immigrations from the continent over land bridges during any glacial periods when the sea level dropped (Voris, 2000). Repeated isolation and reconnection during glacial–interglacial cycles resulted in the co-occurrence of divergent lineages within the Taiwan Island that reflected separate immigration events. Indeed, a range of Taiwanese animals and plants showed such phylogeographic patterns (Yu, 1995; Tzeng et al., 2006; Chiang et al., 2012; Kuo et al., 2015), including Taxus documented here. On the other hand, Taxus, given a hypothetically great capacity of bird-mediated long-distance dispersal as described above and with such capacity suggested by the Taiwan-to-Philippines colonization (see discussion below), may not need the emergences of land bridges for colonization across the Taiwan Strait. It should be noted that the glacial–interglacial cycles were dominated by a periodicity of only 41 thousand years before mid-Pleistocene (∼0.8 Mya) (Tziperman and Gildor, 2003). The uncertainty associated with the estimated origin time of Taiwanese T. phytonii (2.49–3.5 Mya) is too large with respect to such a short periodicity to clarify whether colonization into Taiwan occurred during glacial or interglacial periods.
We infer an origin of Philippine T. phytonii earlier than 1.08 Mya (the mean age for the MTT tree node #2). Philippine islands were volcanic, oceanic, and surrounded by sea that is too deep to form land bridges even when the sea level dropped during glacial maxima (Voris, 2000). The unusually shared floristic elements between Taiwan and the Philippines suggest that the haplotypes of Philippine T. phytonii could be either directly decent from continental Asia Taxus, which is unlikely given the remote distance of Philippine islands which were never connected to continental Asia, or more likely, colonized from Taiwanese T. phytonii, as revealed from our results (Figures 3, 5).
Repeated occurrences of higher introgression levels at ITS than at cpDNA and the possible explanationsIn addition to aforementioned findings, we noticed systematic differences between cpDNA and ITS in their introgression levels across Taxus taxa, suggesting common drivers underlying such between-marker variations. Specifically, the introgression from T. mairei to Taiwanese T. phytonii, revealed by the occurrence of T. mairei-related haplotypes in Taiwan, showed a higher level at ITS than at cpDNA: 16/282 (5.7%) ITS and 2/141 (1.4%) cp sequences represent introgressed sequences. Similarly, 19/76 (25.0%) secondarily incurred (=introgressed) ITS sequences from Taiwanese Taxus to Philippine Taxus were proportionally more abundant than the 2/38 (5.3%) introgressed cp sequences in the same direction. Still, the third example was made of introgression from the Taxus Qinling type to each of the T. mairei and Taxus Huangshan type, with each case showing ITS introgression accompanied with no cpDNA introgression (Figure 3). For Taxus, a dioecious plant with paternal cpDNA inheritance, such a pattern is incompatible with scenario
留言 (0)