
記住我


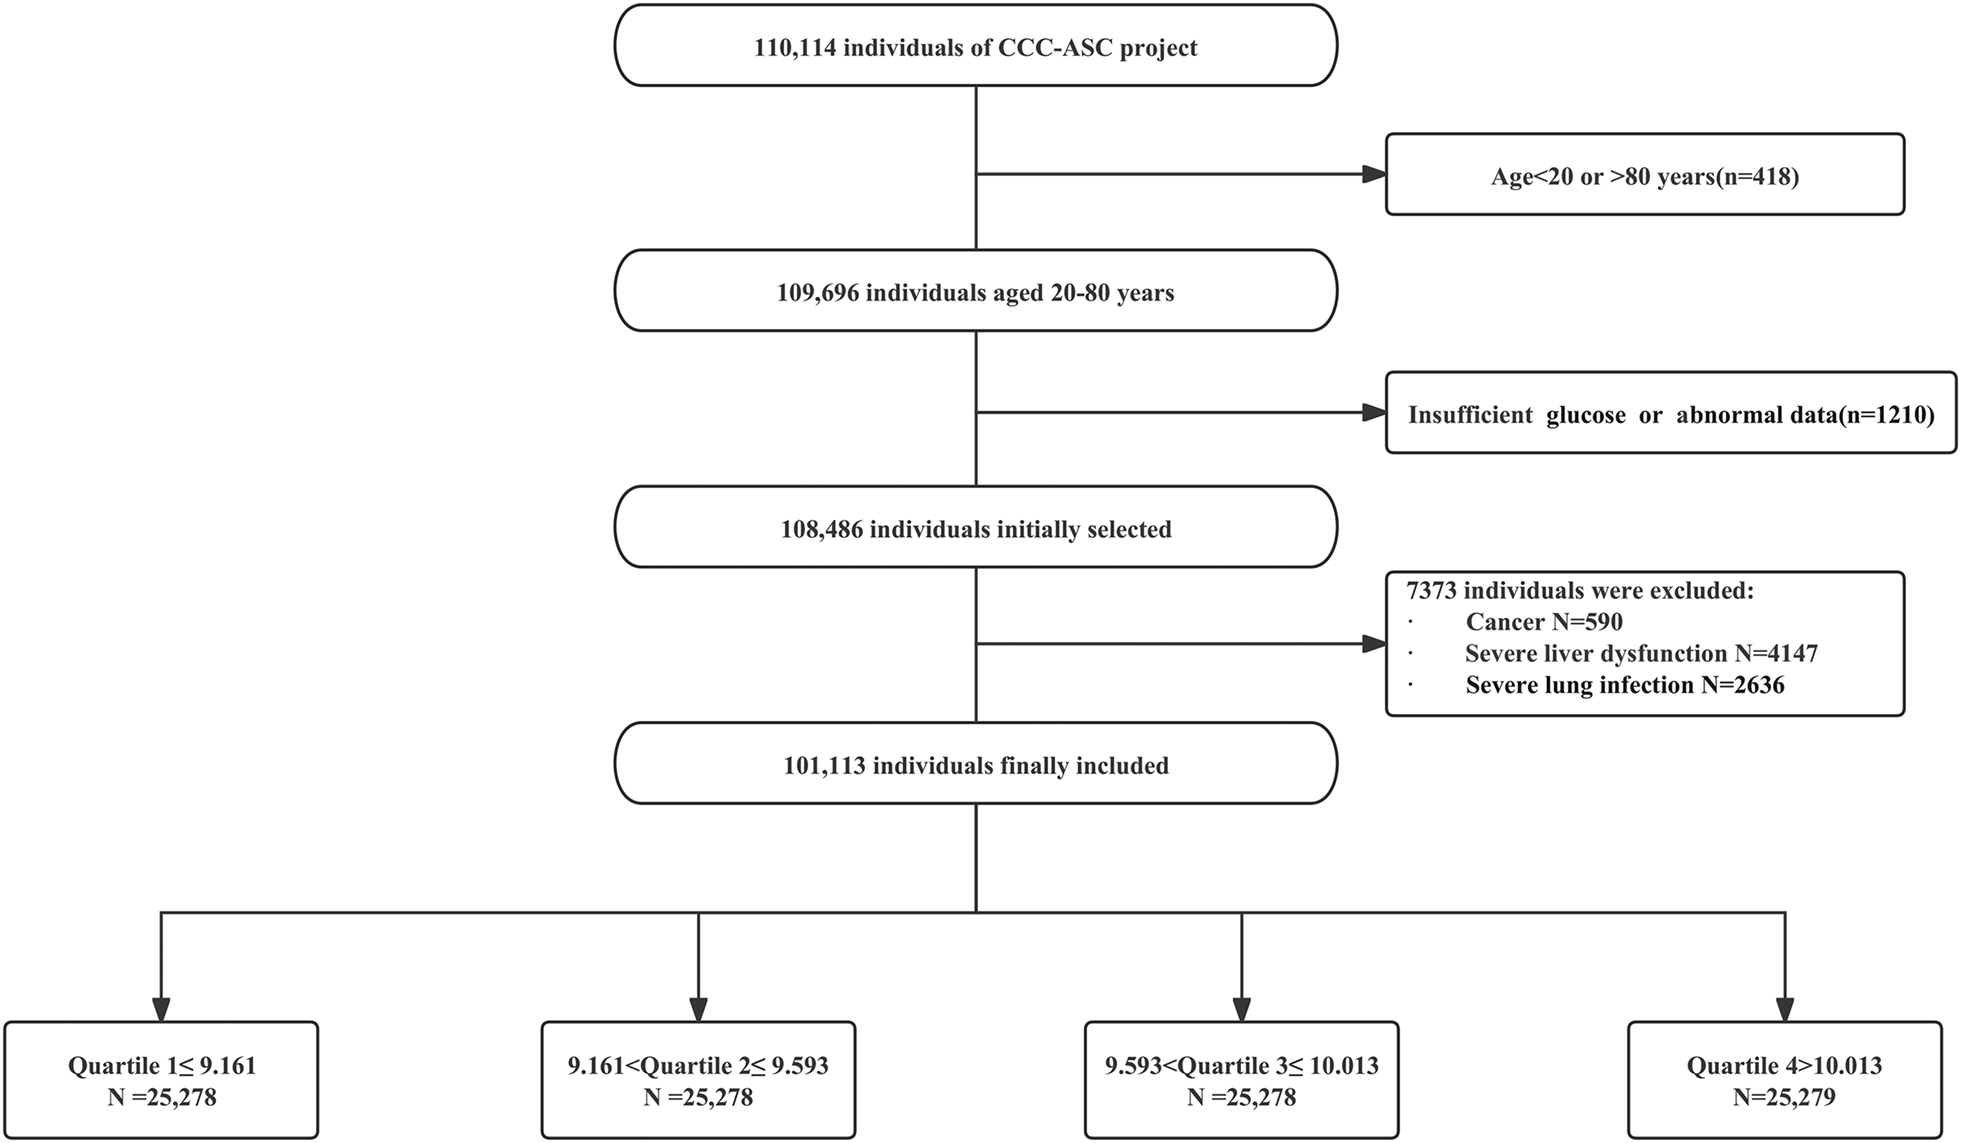


The characteristics of 64,489 participants by quartile of the baseline TyG index are shown in Table 1. The patients enrolled in the study had a mean age of 44.9 ± 8.9 years and the percentage of male was 72.07%. The median (IQR) of the baseline TyG index was 8.57 (8.65 ± 0.70). Compared with the lowest quartile group, the higher TyG index groups have more elders, males, smokers and drinkers and with higher prevalence of hypertension, diabetes mellitus, higher usage rate of antihypertensive agents, antidiabetic agents, lipid-lowering agents, higher BMI, SBP, DBP, TC, LDL-C, hs-CRP, lower HDL-C (all P < 0.05).
Table 1 Baseline characteristics according to quartiles of the TyG indexAssociation of the TyG index with ASCVD events and all-cause mortalityThe median follow-up was 10.8 years (IQR 4.7–14.7 years). During the follow-up period, 1984 participants (3.08%) had composite ASCVD events, with 312 cases of MI, 1104 cases of IS, and 766 revascularization therapies, respectively. A total of 198 patients (0.31%) experienced two or more ASCVD events. In addition, a total of 1392 (2.16%) deaths occurred. The incidence of composite ASCVD events increased from 1.48 (1.31–1.67) per 1000 person-years in Q1 to 5.66 (5.28–6.06) per 1000 person-years in Q4. In addition, the incidence of all-cause mortality also increased from 1.42 (1.25–1.61) per 1000 person-years in Q1 to 3.38 (3.09–3.70) per 1000 person-years in Q4 (Table 2). In addition, the Kaplan-Meier curve revealed that the cumulative incidence of composite ASCVD events, ASCVD events subtypes, and all-cause mortality were higher in Q4 than in the other quartiles (Fig. 2).
Table 2 HR for risk of outcomes according to quartiles of the baseline TyG indexFig. 2
Cumulative incidence of A ASCVD events, B MI, C IS, D revascularization therapy, E all-cause mortality by quartiles of baseline TyG index. ASCVD atherosclerotic cardiovascular disease, MI myocardial infarction, IS ischemic stroke, TyG index triglyceride-glucose index
Cox regression analysis showed that, compared to Q1, the adjusted HR (95% CI) for composite ASCVD events in Q2–Q4 were 1.30 (1.11–1.52), 1.34 (1.15–1.57), and 1.61 (1.38–1.89), respectively (P for trend < 0.001). The adjusted HR (95% CI) for all-cause mortality in Q2–Q4 were 1.18 (1.00-1.40), 1.16 (0.98–1.38) and 1.39 (1.17–1.65), respectively (P for trend = 0.003). In the analysis of ASCVD event subtypes, a higher TyG index (Q4) was significantly associated with higher risks of MI (HR: 2.46, 95% CI 1.60–3.79) (P for trend < 0.001) and revascularization therapy (HR: 2.37, 95% CI 1.81–3.10) (P for trend < 0.001). However, a higher TyG index was only significantly associated with a higher risk of IS in model 1 (HR: 2.22, 95% CI 1.85–2.67) (P for trend < 0.001) (Table 2).
Restricted cubic spline analysis showed that there was a non-linear relationship between the TyG index and the risk of ASCVD events or MI (P for non-linear < 0.01), while there was a linear association between the TyG index and all-cause mortality (P for non-linear = 0.476). However, a significant association between TyG index and IS was not confirmed (Fig. 3).
Fig. 3
Restricted cubic splines for the association of TyG index with A ASCVD events, B MI, C IS, D revascularization therapy, E all-cause mortality. A–E adjusted for age, sex, education, smoking status, drinking status, snoring, BMI, SBP, history of hypertension, history of diabetes mellitus, family history of CVD, use of antidiabetic agents, lipid-lowering agents, antihypertensive medications, TC, HDL-C, LDL-C, hs-CRP and the TyG index. Data were fitted using a Cox regression model of restricted cubic spline with three knots (at the 5th, 50th, and 95th percentiles). Adjusting for potential covariates. The reference point for the TyG index was the median of the reference group. Red lines indicate adjusted hazard ratios, and black lines indicate the 95% confidence interval bands
Sensitivity analysisThe sensitivity analysis between the TyG index and incidence of ASCVD events is shown in Table 3. When the TyG index was considered a continuous variable, the risk of ASCVD events increased by 20% (HR: 1.20, 95% CI 1.12–1.28, P < 0.05) and the risk of all-cause mortality increases by 16% (HR: 1.16, 95% CI 1.07–1.26, P < 0.05) with every increase of 1 unit in the TyG index. After excluding participants who occurred events at the first 2-year follow-up, the fully adjusted risk of composite ASCVD events, ASCVD subtypes events and all-cause mortality remained consistent with the main model.
Table 3 Sensitivity analysis of the association between the TyG index and ASCVD events or all-cause mortalitySubgroup analysisTo further investigate the association between the TyG index and ASCVD events or all-cause mortality across diverse population, we stratified the population based on sex, BMI, history of hypertension, history of diabetes mellitus, smoking status and drinking status. The results showed that the association between the TyG index and ASCVD events were stronger in non-smokers (HR: 1.87, 95% CI 1.53–2.29) compared to smokers (HR: 1.31, 95% CI 1.02–1.67) (P for interaction = 0.042), as well as in non-drinkers (HR: 1.91, 95% CI 1.56–2.33) compared to drinkers (HR: 1.25, 95% CI 0.97–1.60) (P for interaction = 0.001). In addition, the association between the TyG index and all-cause mortality were stronger in participants with BMI ≥ 28 (HR: 1.50, 95% CI 0.95–2.35) compared to participants with BMI < 28 (HR: 1.43, 95% CI 1.18–1.73) (P for interaction = 0.010), as well as in participants without hypertension (HR: 1.60, 95% CI 1.27–2.01) compared to participants with hypertension (HR: 1.11, 95% CI 0.86–1.45) (P for interaction = 0.003) (Table 4).
Table 4 Subgroup analysis of the association between the TyG index and ASCVD events or all-cause mortalityIncremental predictive value of the TyG indexWhen adjusting TG, FBG, or TyG index into the adjusting models on the base of clinical risk factors, the C-index for predicting ASCVD events were 0.7870 (95% CI 0.7776–0.7963) (P < 0.001), 0.7877 (95% CI 0.7783–0.7970) (P < 0.001), and 0.7883 (95% CI 0.7790–0.7976) (P < 0.001); the category-free NRI were 0.1021 (95% CI 0.0588–0.1454) (P < 0.001), 0.0455 (95% CI 0.0009–0.0902) (P = 0.0459), and 0.1607 (95% CI 0.1160–0.2054) (P < 0.001); the IDI are < 0.0001 (95% CI 0–0.0010) (P = 0.3513), 0.0003 (95% CI 0–0.0.0006) (P = 0.0198), and 0.0004 (95% CI 0.0002–0.0006) (P = 0.0003). Although the C-index for predicting ASCVD events in all models were statistically significant, a statistic significance of the IDI by adjusting TG on the base of clinical risk factors was not confirmed.
When adjusting TG, FBG, or TyG index into the adjusting models on the base of clinical risk factors, the C-index for predicting all-cause mortality are 0.7135 (95% CI 0.7007–0.7263) (P < 0.001), 0.7138 (95% CI 0.7011–0.7266) (P < 0.001), and 0.7143 (95% CI 0.7015–0.7271) (P < 0.001); the category-free NRI are 0.0784 (95% CI 0.0275–0.1293) (P = 0.0038), − 0.0309 (95% CI − 0.0837–0.0218) (P = 0.2536), 0.1235 (95% CI 0.0705–0.1766) (P < 0.001); the IDI are < 0.0001 (95% CI 0–0.0001) (P = 0.0890), 0.0010 (95% CI 0.0005–0.0015) (P < 0.001), and 0.0003 (95% CI 0.0002–0.0005) (P < 0.001). Similarly, although the C-index for predicting all-cause mortality in all models were statistically significant, a statistic significance of the IDI by adjusting TG, the category-free NRI by adjusting FBG were not confirmed (Table 5).
Table 5 Incremental predictive value of the TyG index for ASCVD events and all-cause mortality
留言 (0)