
記住我


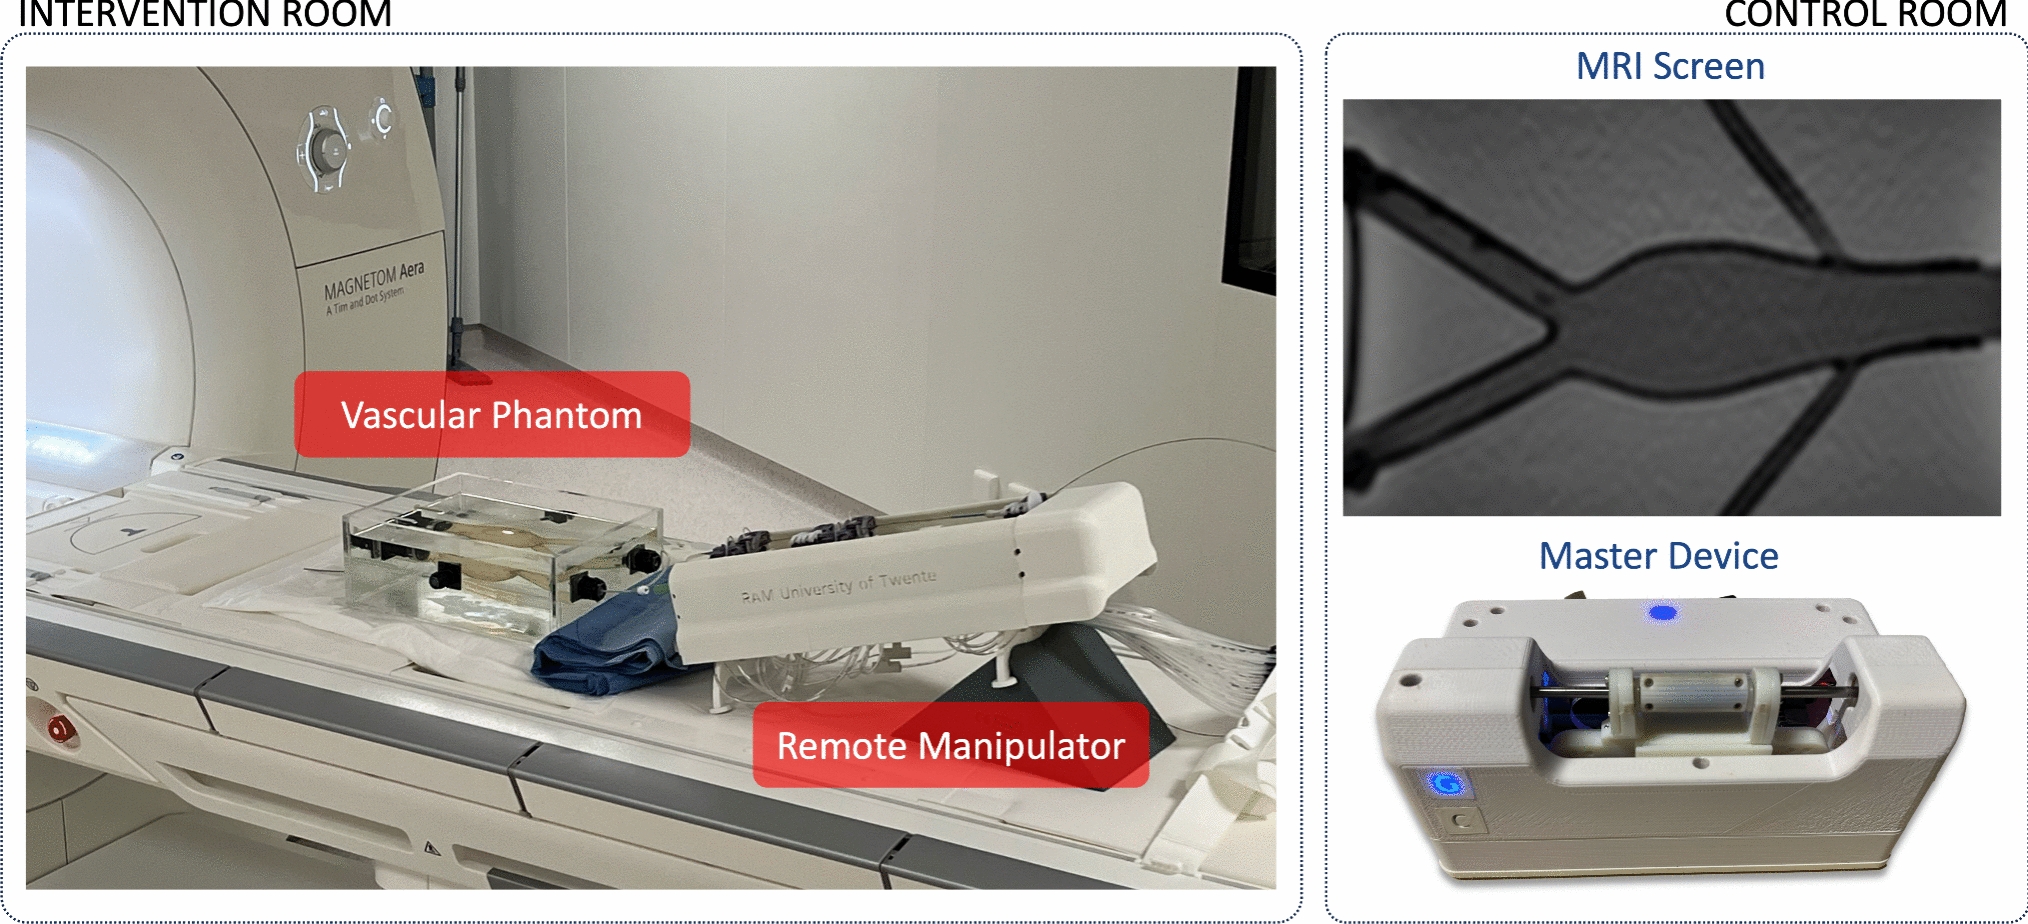


As previously introduced, the MR-based navigation framework here proposed allows the (1) acquisition of real-time MR images; (2) segmentation of the vasculature and tracking of vascular instruments; (3) generation of MR-based guidance. The overall idea is to grab real-time images from the MR scanner, apply image processing to detect the vasculature and track the vascular instrument (in our study a guidewire in the abdominal aorta), and use this information to generate vision-based enhanced guidance in the form of visual guidance (visual information displayed on the screen in the control room), and through haptic guidance via the CathBot’s master manipulator. The surgeon teleoperates the remote manipulator, placed in the intervention room close to the patient, by manipulating the master device from the control room. The navigation system provides visual and haptic guidance to help the surgeon to accomplish the procedure. The video stream provided by the MR scanner is acquired and processed by the navigation system at 30 Hz. Tracking algorithms are applied to the grabbed video stream to capture the pose of vascular instruments and the vessel wall. These data are fed into the high-level controller which processes them in real-time along with motion inputs from the surgeon to generate and render dynamic active constraints on the master device at 200 Hz. Motion commands are finally sent to the remote manipulator which performs the actual manipulation of the vascular instruments. It is worth noting that the navigation system and the haptic control system work at different framerates, 30 Hz and 200 Hz respectively. The higher framerate of the haptic control system is necessary to guarantee proper haptic guidance. Despite the different rate, both systems run on real-time controllers that guarantee the determinism of the process adding an extra level of safety to the procedure.
Figure 2 provides a schematic overview of the system architecture, and a detailed description of the navigation framework are provided in the following sub-sections.
Fig. 2
System architecture. The video stream provided by the MR is acquired and processed by the navigation system to generate haptic and visual guidance. The pose of the vascular instrument and the vasculature are captured and tracked in real time. Haptic algorithms generate haptic guidance to support the clinician during the procedure
3.1 MR images acquisitionIn this study, images are acquired from a Magnetom Aera 1.5 T MRI scanner (Siemens Healthineers, Erlangen, Germany). MR scanning sequences are applied to generate 2D fluoroscopy-like MR images of the vasculature and the vascular instrument in real-time (see the Experimental Validation section for details). Real-time 2D video of this surgical scene is acquired in the PC workstation through an image grabber (DVI2USB3, Epiphan Video, Ottawa, Canada), displayed on a screen in the control room for visual guidance, and processed as follows. The software is written in PyQT and is available in the github at this link https://github.com/Jelle-Bijlsma/UTMR. Please refer to the Supplementary Materials for a technical description of the software. The software acquires the frames provided by the grabber using two functions (filebrowse_png() and get_imlist(), please check the UTMR_main2.py file in the github) that read and make the images available for the processing described in the next sub-section.
3.2 Image processingThe acquired video stream is processed to detect the vessel walls and track the vascular instrument. The image processing pipeline is described in Fig. 3.
Fig. 3
Image processing pipeline. Each acquired frame is firstly smoothened by applying a Gaussian filter. A Canny edge detector defines the vessel walls. Further filtering and masking algorithms are applied to define the region of interest for the marker tracker algorithms (template matching and blob finding algorithms). A quadratic spline interpolation is then applied to the detected markers to define the shape of the instrument. This information is sent to the guidance algorithms for further processing
The first step in the image processing is to apply filtering to the acquired frames. The framework uses a Gaussian filter, to smoothen the image and reduce noise in the edge detection step. The filtering is applied in the frequency domain for speed purposes. Please refer to the /functions/filter.py function in the github for details. Then a Canny edge detection algorithm is used to detect the walls of the arteries (/functions/edge.py). The result is a binary image on which a dilation and erosion operator is applied (square 7 × 7 pattern) to provide a closed contour of the vessel walls in the image. Only the internal area of this contour is considered for instrument tracking purposes, by applying masking. This mask defines the region of interest (ROI) where the tracking algorithm (described here below) is applied, improving its efficiency and preventing false-positive detections (e.g., in region outside the vessel). These a template matching algorithm is applied within the aforementioned ROI to detect and track the position of the vascular instrument inside the anatomy (/functions/template.py). In this study, a commercial MR-visible guidewire from (EPflex Feinwerktechnik GmbH, Dettingen an der Erms, Germany) has been used. The guidewire is 0.89 mm thick and consists of an inner core of braided fibers, which is coated with composite and PTFE. The tip is covered with a large para-magnetic marker, followed by 5 short and evenly spaced markers. The markers afterwards are spaced farther apart. The markers are cylindrical and surround the braided fiber. A local descriptor for the para-magnetic markers is created by using a low discrepancy sampling algorithm. Up to 4 different template descriptors can be stored simultaneously. The function creates the templates to search the markers in the video images. The template is a copy of a small area of the input image that includes the marker. The system stores descriptive data, utilizing it to scan for markers in every video frame. This process involves employing a cross-correlation template matching algorithm, specifically focusing on 2D translations. It determines the optimal position of the template on the image, pinpointing the marker’s best estimated location.
A blob finding algorithm runs in parallel to the template matching algorithm for redundancy ensuring all the markers are properly tracked in each frame (/functions/blob_contour.py). Its operational concept relies on intensity thresholding, being shape-feature-independent for increased robustness against marker distortions compared to the template matching method. Despite a trade-off in localization accuracy, this secondary tracking algorithm can identify and rectify erroneous marker positions, ensuring the necessary safety levels for clinical applications.
The positions of magnetic markers detected by the tracking algorithm are interpolated (quadratic spline) to estimate the shape of the actual guidewire. These interpolated points are used in the following step to calculate the wire-wall distance and tip-wall angle for guidance purposes (/functions/spline.py).
The parameters of the image processing algorithms (namely gaussian filter, Canny edge detector, template matching and blob finder) can be tuned online via the software GUI depending on the application. Examples of parameters that can be tuned include the Gaussian kernel, Canny edge detector’s thresholds, up to 4 template acquisitions, blob finder’s thresholds and blob area. The full list of parameters can be found in the provided software in the github.
3.3 MR-based guidanceThe idea behind the MR-based enhanced guidance is to use the information on the position of the vascular instrument with respect to the vasculature to enhance the instrument navigation. Contacts between the tip of the instrument and the vasculature may result in puncturing injuries. Contacts between the whole body of the instrument and the vessel walls can also be harmful due to forces and frictions that can damage the tissue. In this work we provide the user with enhanced information on the instrument body position via visual feedback, and on the instrument tip position via haptic feedback (Fig. 4) (Dagnino et al. 2018).
Fig. 4
Guidance algorithms. Ray casting and collision detection algorithms are applied to calculate the closest distance between the instrument and the vessel wall. The haptic algorithm is exclusively implemented for a single marker, specifically the one positioned at the tip of the instrument. This information is used to generate the MR-based haptic guidance to mitigate the risk of puncture injuries. However, it is equally crucial to convey information to the user about the overall shape of the instrument, as interactions between the instrument's body and the vessel wall could also lead to injuries. Such information is conveyed through color-coded visual feedback, utilizing the interpolated points
The closer the instrument body is to the vessel wall, the higher is the risk to result in potentially dangerous high-impact contacts between the instrument and the vessel. This information is color-coded and displayed on the video screen in the control room: the vascular instrument assumes different colors according to its distance from the vessel wall, ranging from green (low risk) to red (high risk). The distance between each point of the instrument (after spline interpolation) and the closest point on vessel wall can be calculated. This is done by applying a ray casting algorithm to each point which defines its shape (see Fig. 4). 4 equally spaced rays (0, 30, 60, and 90 degrees) are cast in different directions starting at the actual position of each point Secondly, a collision detection algorithm detects the collisions between the rays and points on the vessel wall. Finally, the algorithm selects the closest point on the vessel wall and calculates the cartesian distance.
Predefined thresholds are set for instrument-wall distances to provide visual feedback to the surgeon. By outlining three different contact risk regions, low, medium, high, a color can be assigned to a line segment. Two thresholds define these three regions as follows. The low-medium threshold is set at the vessel center line ± 20% of the local vessel diameter. The medium–high threshold is set at the vessel center line ± 40% of the local vessel diameter.
When the distance between the instrument and the vessel wall is greater than a low-medium threshold, then the segment color is green (contact risk is low). When the distance between the instrument and the vessel wall is between the low-medium and medium–high thresholds, then the segment color fades from green to yellow (contact risk is medium). Finally, if the distance between the instrument and the vessel wall is lower than the medium–high threshold, then the color the segment color fades from yellow to red (contact risk is high). Figure 6c and d provide two examples.
Haptic guidance is generated via the CathBot’s master manipulator and is perceived as frictions which increase proportionally to the distance between the instrument tip and the vessel wall (i.e., the closer the instrument tip is to the vessel, the higher is the force feedback generated into the master manipulator to inform the surgeon of the proximity of the wall). It is worth noting that the haptic guidance algorithms described here below are only applied to the tip of the instrument, while the visual guidance algorithms are applied to the whole body of the instrument (please refer to Fig. 4).
Friction-like forces were chosen for haptic rendering, instead of other options (e.g., repulsive forces) to minimize the magnitude of the instrument-vessel contacts, which are anyhow required to navigate the vasculature. The 2D pose of the instrument tip Ptip = [xt, yt] is provided by the tracking algorithms (template matching and blob finding algorithms) described in the previous section. The ray casting algorithm is applied to the tip marker and the collision detection algorithm selects the point on the vessel wall Pvessel = [xv, yv,] with minimum distance d from the instrument tip Ptip. This information is then used to model the damping factor f and generate the haptic feedback in the master manipulator motors as follows.
where, Vmotor and Imotor are the motor velocity and current respectively. The damping factor f is modeled as:
$$f=\left|\frac-1\right|\left(_-1\right)+1$$
(2)
where, d is the distance between the instrument tip and the closest point on the vascular wall; D is the local vessel diameter; and fmax is the the maximum friction achievable (user-defined). Equations (1) and (2) describe the following behavior: when the surgeon applies a force on the master manipulator, a motor current Imotor (proportional to the force applied) is generated. The corresponding motor velocity Vmotor is directly proportional to the force applied (described by Imotor) and inversely to the damping factor f. This means that when the surgeon pushes the instrument towards the vessel wall, then the friction generated by the motors increases accordingly. If the instrument tip is in contact with the vessel wall (d = 0), then f is equal to fmax.
If one marker is not detected, visual guidance is withheld. Haptic guidance, however, remains consistently available unless the reference marker at the instrument tip goes undetected. In such case, we keep the friction on the master manipulator constant to prevent unexpected abrupt movements.
留言 (0)