
記住我


Xinjiang Brown cattle is a major breed supporting the development of the cattle industry in Xinjiang, it was the first breed of cattle used for milk and meat purposes after the founding of the People’s Republic of China. In 2023, the number of Xinjiang Brown cattle in stock reached 1.16 million; however, the level of breed improvement was low, with a performance measurement population of <10,000. Therefore, it is important to establish an efficient genomic evaluation system for Xinjiang Brown cattle to improve their genetic level. The application of genome selection technology has significantly enhanced the efficiency of genomic evaluation (Hayes et al., 2016). Because of the implementation of the genome selection for Chinese Holstein cattle in 2008, early and accurate selection of calves and young cattle has been achieved (George et al., 2017), leading to higher accuracy in genomic evaluation and more precise assessment of individual breeding value (Weigel et al., 2010; Dassonneville et al., 2011). In addition, due to early selection and higher accuracy, the rate of genetic progress has doubled (Weller et al., 2017), improving breeding profitability and significantly reducing breeding costs. Although genome selection has been successfully applied to Chinese Holstein cattle population, the low level of production performance measurement and small population size of Xinjiang Brown cattle have hindered the application of genome selection technology. To improve the reliability of genomic predictions, especially for smaller populations, many feasible methods have been proposed, including increasing marker density, constructing linkage disquilibrium (LD) with more markers and causal mutations, and simulation data analysis (de Roos et al., 2009). Simulation and real data analyses (BrØndum et al., 2015) have shown that genomic prediction can play an important role in different populations.
For genome selection, it is necessary to have a reference population with sufficient size and an appropriate genetic structure that simultaneously incorporates genomic and phenotypic information to accurately predict genome estimated breeding values (GEBVs) (Metta et al., 2004; Boichard et al., 2016). Genome selection has recently been widely used in dairy cattle breeding programs. However, its application is limited to populations with a small number of breeds. Establishing a sufficiently large reference population is the most limiting factor for the accurate estimation of SNP effects (Boichard et al., 2016). When conducting genome selection for small populations, the most direct approach to enhancing its reliability is to expand the reference population. Many countries have found effective solutions through international cooperation, leading to joint genomic evaluations (Lund et al., 2011). By connecting France, Germany, Austria, Italy, Slovenia, Switzerland, and the United States of America to the InterGenomics consortium operated by the Interbull Center (Zumbach et al., 2010; Jorjani et al., 2012), genome-wide joint evaluations have been conducted for Brown Swiss bulls and Simmental cattle in Germany and Austria (Edel et al., 2011). Research has shown that by combining different populations of the same breed or related breeds in the reference population, more effective information can be obtained for estimating marker effects. Therefore, more accurate breeding predictions can be obtained from genomic predictions. Accuracy is improved when three related dairy cattle populations, Danish Red, Swedish Red, and Finnish Ayrshire, are combined into a single reference population (Zhou et al., 2014). When four European Holstein populations were combined into a reference population, the reliability increased by 10% (Lund et al., 2011). By combining six Brown Swiss populations, the reliability increased from 6% to 45% (Jorjani et al., 2012). However, multi-breed genomic evaluation of Xinjiang Brown cattle has not yet been conducted, limiting the optimized utilization of genomic selection technology in their genomic evaluation.
Based on the research foundation for domestic and international multi-breed joint genomic evaluation (Pryce et al., 2011; Lund et al., 2014; Steyn et al., 2019; Xu et al., 2019; Palombo et al., 2021), we proposed to integrate Xinjiang Brown cattle and Chinese Holstein cattle to construct a joint reference population for genome selection. In order to expand the Xinjiang brown cattle genome selection reference group, so as to apply multi-breed genome selection in Xinjiang brown cattle population to improve the prediction reliability. This study aimed to analyze the genetic structures of Xinjiang Brown and Chinese Holstein cattle to establish a multi-breed joint reference population. Using a dual-trait single-step genome-wide best linear unbiased prediction (ssGBLUP) approach, we established a genomic evaluation system for the primary lactation traits of Xinjiang Brown cattle, leveraging the joint reference population of Xinjiang Brown and Chinese Holstein cattle. This improves the accuracy of genomic selection for Xinjiang Brown cattle, creating a core breeding herd of genetically superior dairy Xinjiang Brown cows. Consequently, the genetic improvement of Xinjiang Brown cattle population will be expedited, leading to enhanced genetic levels across the breed.
2 Materials and methods2.1 Sample collection and DNA extractionA total of 1,729 blood samples were collected from the tail vein of Xinjiang Brown cattle and added to 10 mL EDTA anticoagulant tubes. The samples were then aliquoted into 1.5 mL centrifuge tubes and stored at −20°C. In addition, 66 frozen semen samples were collected from Xinjiang Brown and Brown Swiss bulls used for the artificial insemination of Xinjiang Brown cattle after 1983.
DNA was extracted from the above samples, and the concentration and purity of the obtained genomic DNA were measured using a NanoDrop 2000c spectrophotometer. The OD260/OD280 ratio was 1.7–1.9, indicating good DNA quality. After assessing DNA concentration, purity, and integrity, the samples were stored at −20°C (Ma, 2015).
2.2 Sample screening and chip detectionPhenotypically complete Xinjiang Brown cattle were screened from various Xinjiang Brown cattle farms for chip detection. After screening, 403 cows and 82 bulls from four core farms in Xinjiang region were selected. Moreover, we included 174 Xinjiang Brown cows from Xinjiang Uygur Autonomous Region State-owned Urumqi breeding farm, 50 Xinjiang Brown cows from Xinjiang Tianshan Animal Husbandry Bioengineering Co., Ltd. breeding farm, 130 Xinjiang Brown cows from the Tacheng Agriculture and Animal Husbandry Technology Co., Ltd., 49 Xinjiang Brown cows from Yili New Brown breeding farm, 71 bulls and 11 Brown Swiss bulls from Xinjiang Tianshan Animal Husbandry Bioengineering Co., Ltd. Bull breeding station. Chip data for Chinese Holstein cows were obtained from 2,633 animals in Beijing, distributed across 18 farms in the region. All of these animals were detected using the Illumina GeneSeek GGP bovine 150 K chip.
2.3 Chip imputation and quality controlA total of 139,376 and 138,892 SNP markers were detected using Xinjiang Brown and Chinese Holstein cattle chip assays, respectively. These data were imputed using Beagle 4.1 software, which infers haplotypes present in the population based on the principle of linkage disequilibrium. To ensure the accuracy of imputation, quality control measures were applied to the chip data.
The quality control criteria were as follows: individuals with a genotyping call rate of <90% were excluded. Only SNPs on chromosomes 1–30 were retained, with an individual genotype missing rate of <10%. SNPs with a minor allele frequency of >0.01 and a Hardy–Weinberg equilibrium p-value >1 × 10⁻⁶ were also included. After quality control using the PLINK software, the SNP genotypes were converted to a 0, 1, and 2 format. Finally, 118,622 and 123,268 SNP markers on the autosomal chromosomes of Xinjiang Brown and Chinese Holstein cattle were retained, respectively. Because the number of SNP markers differed between the two breeds after quality control, an intersection of the SNP markers was taken, which resulted in 118,021 common SNP markers for both breeds (Figure 1).
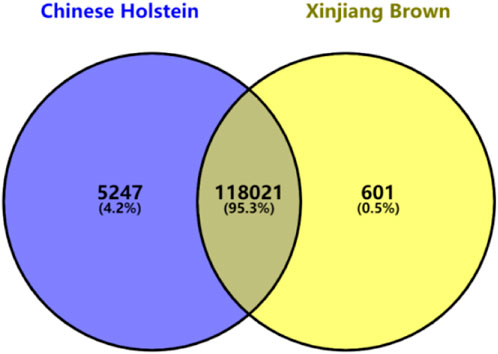
Figure 1. Venn diagram of GeneSeek GGP Bovine 150 k after quality control in Xinjiang Brown cattle and Chinese Holstein cattle.
2.4 Genetic structure analysis2.4.1 Linkage disequilibrium analysisThe.map and. ped files for both breeds were converted to. vcf format using PLINK. The PopLDdecay software was then used to analyze and plot LD decay graphs (https://github.com/BGI-shenzhen/PopLDdecay) (Zhang et al., 2019). The LD metric, r2, was calculated for the four populations (Hill, 1974). The mean r2 value was computed at various marker distances of 1 Kb to demonstrate the degree of LD decay across different populations.
2.4.2 Population structure analysisTo infer ancestral populations based on the allele frequencies of descendant individuals, an unsupervised algorithm was employed (Consortium et al., 2009). In this study, genome-wide SNP data were used to calculate the population structure for ancestral admixture components with K values of 2–4 using admixture (Alexander et al., 2009). Visualization of the population structure was performed using the R package “pophelper”.
Analysis was conducted using the FastTree software (http://www.microbesonline.org/fasttree/), with the maximum likelihood method adopted for estimation. The Jukes–Cantor + CAT model was used as the default model for nucleotide phylogeny. The credibility of the phylogenetic tree branches was tested using 1,000 bootstrap replicates. Finally, the FigTree software was used for visualization.
2.4.3 Principal component analysisThe Gmatrix package in R was used to calculate the genomic kinship matrix (G-matrix) for Xinjiang Brown and Chinese Holstein cattle. Subsequently, principal component analysis (PCA) was performed using the G-matrix. The first three eigenvectors (PCA1, PCA2, and PCA3) were extracted and used as the horizontal and vertical coordinates for plotting. The contribution rates of the principal components were calculated on the basis of the percentage of eigenvalues. Finally, visualization was performed using the R language.
2.5 Multi-breed genomic evaluation using a joint reference population2.5.1 Phenotypic data processingThe data for Xinjiang Brown cattle include production performance measurement records from 1983 to 2018 and DHI measurement records from 2010 to 2017. The data for Chinese Holstein cattle include DHI measurement records from 2001 to 2019. Milk-related traits, including 305-day milk yield (305dMY), milk fat yield (MFY), milk protein yield (MPY), and somatic cell score (SCS), were obtained through collation (Table 1). There were 7,516 and 93,717 milk trait measurements recorded for Xinjiang Brown and Chinese Holstein cattle, respectively.
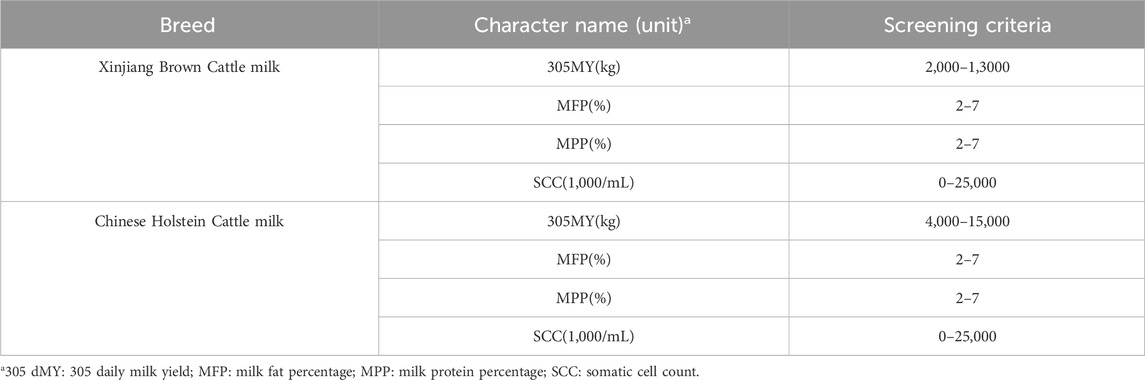
Table 1. The standards for data filtering.
The pedigree file used to analyze Xinjiang Brown cattle had 16,795 cattle, including 676 breeding bulls. Among these bulls, one had a maximum of 619 offspring, whereas 221 had only one offspring. Among the female adult cattle, 583 had only one offspring, whereas 1,623 had two or more offspring, with a maximum of 12 offspring per individual.
For the Chinese Holstein cattle, the pedigree file used for the analysis contained 6,54,390 individuals, including 11,243 breeding bulls. Among these bulls, one had a maximum of 7,884 offspring, whereas 4,695 had only one offspring. Among the female adult cattle, 1,63,781 had only one offspring, whereas 1,11,912 had two or more offspring, with a maximum of 12 offspring per individual (Table 2).

Table 2. Data statistics.
2.5.2 Genotype dataGenotype data for 403 female Xinjiang Brown cattle, 71 male Xinjiang Brown cattle, and 11 male Brown Swiss cattle was considered. In addition, 2,100 Chinese Holstein cattle were randomly selected (According to PCA and Admixture results, PLINK software was used to remove the chip data of Chinese Holstein cows that was inconsistent with the large population of Chinese Holstein cows).
2.5.3 Statistical analysisIn this study, the ssGBLUP method was used to construct the H-matrix based on the pedigree and genomic information from Xinjiang Brown and Chinese Holstein cattle. The two-trait model Bayesian approach was used to estimate the variance components and breeding values for each trait.
To investigate the suitable integral ratio of the Chinese Holstein cattle in the joint reference population, a random gradient grouping approach was applied. The population was gradually accumulated in increments of 300 individuals to construct the joint reference population. A control group was established by excluding the phenotypic and genomic information of the Chinese Holstein cattle (Table 3).
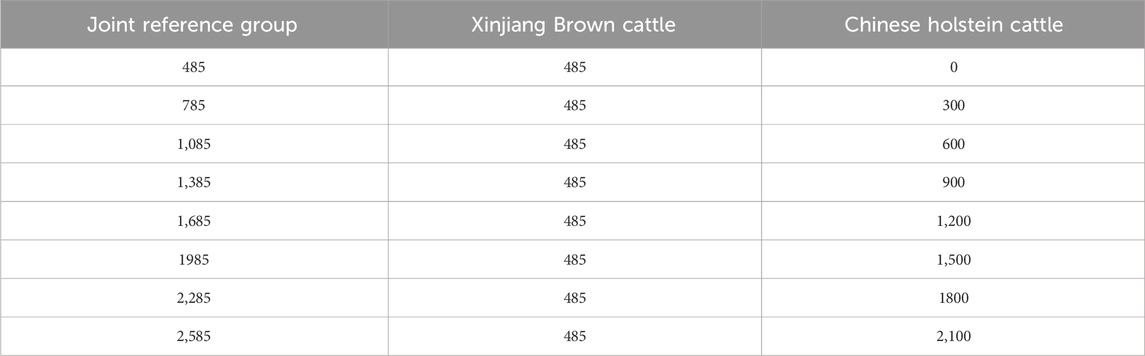
Table 3. Gradient grouping of joint reference group.
Because of the significant differences in milk production traits between Xinjiang Brown and Chinese Holstein cattle (Zhang et al., 2021), a dual-trait animal model was constructed. In this model, each biological trait was treated individually in the two populations, accounting for potential scale inconsistencies that may arise during breeding value estimation due to standardization across different breeds. The milk production traits (305dMY, MFY, MPY, and SCS) of Xinjiang Brown and Chinese Holstein cattle were considered to be two separate traits. A dual-trait linear model was used to estimate the variance components for milk production traits based on the genomic-pedigree combined relationship matrix, H-matrix. The model is described as follows:
y1y2=X100X2β1β2+Z100Z2a1a2+e1e2In the formula, y1 represents the observation value vector of a certain milk trait for each of Xinjiang Brown cattle, and y2 represents Chinese Holstein cattle. β1 and β2 represent the fixed effect vectors for the same milk trait of Xinjiang Brown and Chinese Holstein cattle, respectively, including farm effect, calving year effect, calving season effect, and parity effect. The farm effect was divided into 20 levels based on the phenotypic data sources of the farms where the cattle were raised. The calving years of Xinjiang Brown cattle were divided into seven levels based on phenotypic records: 1985–1995, 1996–2000, 2001–2005, 2006–2008, 2009–2011, 2012–2014, and 2015–2018. The calving years of the Chinese Holstein cattle were divided into six levels: 2001–2005, 2006–2008, 2009–2011, 2012–2014, 2015–2018, and 2019. For the parity effect, Xinjiang Brown and Chinese Holstein cattle were classified into six levels: 1, 2, 3, 4, 5, and 6 (including those with more than six calves). The calving season effect of Xinjiang Brown cattle was divided based on the unique climatic conditions of Xinjiang. According to the method of temperature intervals, April and May were considered spring, June, July, and August were considered summer, September was considered autumn, and January, February, March, October, November, and December were considered winter. Conversely, the calving season effect of Chinese Holstein cattle was determined based on the climatic characteristics of Beijing. Following the same method of temperature intervals, March, April, and May were considered spring, June, July, and August were considered summer, September, October, and November were considered autumn, and December, January, and February were considered winter. a1 and a2 represent the individual additive genetic effect vectors for a certain milk trait of Xinjiang Brown and Chinese Holstein cattle, respectively. e1 and e2 represent the random residual effect vectors for the same milk trait of Xinjiang Brown and Chinese Holstein cattle, respectively. Xi and Zi represent the incidence matrices for the fixed effects and individual random additive genetic effects of the i-th trait, respectively.
Assume α1α2∼N0,H⊗σα12σα1α2σα2α1σα22, e1e2∼N0,I⊗σe1200σe22, In the aforementioned formula, H represents the combined genomic-pedigree relationship matrix. σαi2 denotes the additive genetic variance for the i-th breed, while σα1α2 represents the covariance between breeds. σei2 stands for the residual variance of the i-th breed. Given that Xinjiang Brown and Chinese Holstein cattle are reared in separate populations, there is no residual covariance between the two groups.
The genetic variance–covariance structure of the ssGBLUP additive genetic effect model is represented by a∼N0,Hσa2, where σa2 denotes the additive genetic variance. H, the pedigree–genome relationship matrix, represents a combination of the pedigree-based additive genetic relationship matrix (A matrix) and the genome-based kinship matrix (G-matrix) (Aguilar et al., 2010; Christensen and Lund, 2010).
The formula used to compute H is as follows:
H=A11−A12A22−1A21+A12A22−1GA21A12A22−1GGA22−1A21GSubscripts 1 and 2 in A represent the non-genotyped and genotyped animals in the population, respectively. G represents the genetic relationship matrix. The calculation formula is as follows: G=MM′2∑k=1mpk1−pk. M represents the association matrix for SNP effects, where the elements 0−2pj, 1−2pj, and 2−2pj represent homozygous 11, heterozygous 12 or 21, and homozygous 22 genotypes, respectively. pj represents the minor allele frequency of the jth SNP, and m represents the number of markers. pk denotes the allele frequency of the Kth SNP. Therefore, the H−1 formula is given by H−1=A−1+000G−1+A22−1: where A−1 represents the inverse matrix of all pedigree relationships, G−1 represents the inverse matrix of genomic kinship relationships, and A22−1 represents the inverse matrix of the pedigree relationships for the sequenced individuals. The Bayes method was calculated using the GIBBS1F90 module in the BLUPF90 software along with the Bayes–Gibbs sampling method. In the Bayes method, the total chain length of the samples was 100,000, the burn-in chain length was 10,000, and the thinning interval was 50. The Geweke diagnostic method in POSTGIBBSF90 was used to check the convergence of the Gibbs chain (Zhang et al., 2022).
2.5.4 Calculation of heritabilityThe calculation formula of heritability is as follows:
The formula for the standard error of heritability is shown below:
SE2h2=σa2σp2Varσa2σa22+Varσp2σp22−Covσa2,σp2σa2σp2where h2 is heritability, SE2h2 is the standard error of heritability,σa2 is the additive genetic variance, σe2 is the residual variance. σp2 is the overall phenotypic variance, σp2=σa2+σe2.
2.5.5 Verification of the reliability of genomic breeding valuesTo verify the accuracy of the estimated genomic breeding values for the joint reference populations, 50 offspring individuals born in the past 4 years from 485 genotyped Xinjiang Brown cattle served as a validation group. Genomic predictions were performed in two groups: with and without excluding the phenotypic data of the validation group. This resulted in 16 sets of genetic parameters and genomic estimated breeding values for each milk trait. By comparing the prediction accuracy, estimation bias, and inflation coefficient of the validation group, the optimal number of joint reference populations was determined.
To calculate the prediction accuracy of the genomic estimated breeding values, the correlation coefficient between the genomic breeding values calculated with the phenotypic data of the validation group and those calculated without these data was used to measure the accuracy of estimating genomic breeding values for different joint reference populations. The formula is as follows: RGEBV=CorTBV*,GEBV, where R2 represents reliability or the square of accuracy.
Meanwhile, the regression of TBV* on GEBV is calculated using the formula TBV*=b0+b1GEBV, where the regression coefficient b1 is the inflation coefficient, and the intercept b0 is the estimation bias (Legarra and Reverter, 2019).
b1=covGEBV,yvary=varGEBVvary<1b1=VarGEBVVary=VarGEBVVaraVaraVary=rGEBV2ry2≪1In this context, b1 represents the regression coefficient, which has the following implications: when b1<1, GEBV is inflated, indicating that Var (GEBV) is too large. This means that in the genomic breeding values, the good ones are even better, and the bad ones are even worse. Conversely, when b1>1, GEBV is deflated, suggesting that Var (GEBV) is too small. This indicates that the genomic breeding values are smaller than the true values and are contracted toward the middle.
3 Results3.1 Genetic structure3.1.1 Linkage disequilibrium analysisLinkage disequilibrium analysis was conducted between the two breeds by calculating the linkage disequilibrium coefficients for the two loci and plotting the LD decay graph (Figure 2). The graph shows that the average LD coefficients for Xinjiang Brown cows, Xinjiang Brown bulls, Brown Swiss bulls, and Chinese Holstein cows at a genomic distance of 50 kb were approximately 0.2, 0.25, 0.3, and 0.35, respectively, indicating a gradual increase. Noteworthy, the decay rates of the LD coefficients vary among different populations. Among the breeds, Brown Swiss bulls exhibited the slowest LD decay at 0–40 kb, whereas the Chinese Holstein cows exhibited the fastest LD decay. However, in the range of 40–300 kb, Xinjiang Brown cows exhibited the fastest LD decay, with a decay rate order of Xinjiang Brown cows > Chinese Holstein cows > Xinjiang Brown bulls > Brown Swiss bulls.
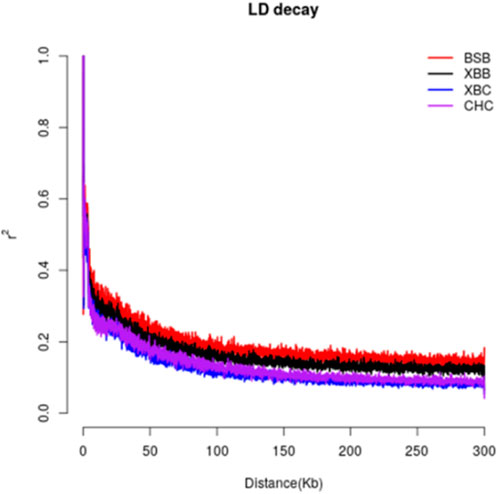
Figure 2. LD decay of Xinjiang Brown cattle and Chinese Holstein cow. BSB is Brown Swiss Bull, CHC is Chinese Holstein cow, XBB is Xinjiang Brown Bull, XBC is Xinjiang Brown Cow.
3.1.2 Population structure analysisTo further investigate the genetic components of Xinjiang Brown and Chinese Holstein cows, population structure and phylogenetic tree analyses were conducted. As shown in Figure 3, when the number of ancestral populations K = 2, there was a clear distinction in the genetic structure among Xinjiang Brown cows, Xinjiang Brown bulls, Brown Swiss bulls, and Chinese Holstein cows. However, the genetic structure within each group differed insignificantly. As shown in Figure 4, Xinjiang Brown cows, Xinjiang Brown bulls, and Brown Swiss bulls were clustered, whereas the Chinese Holstein cows were clustered separately. In addition, Xinjiang Brown cows, Xinjiang Brown bulls, and Brown Swiss bulls appear at the end of a certain branch within the Chinese Holstein population.
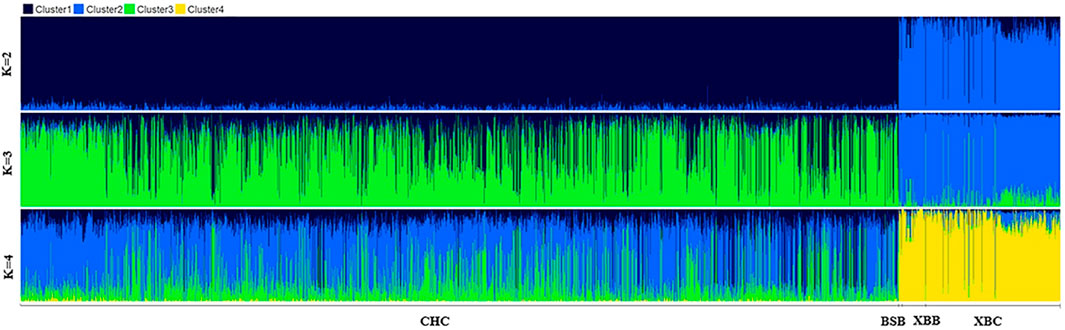
Figure 3. Analysis chart of population structure in Xinjiang Brown cattle and Chinese Holstein cow. BSB is Brown Swiss Bull, CHC is Chinese Holstein cow, XBB is Xinjiang Brown Bull, XBC is Xinjiang Brown Cow.
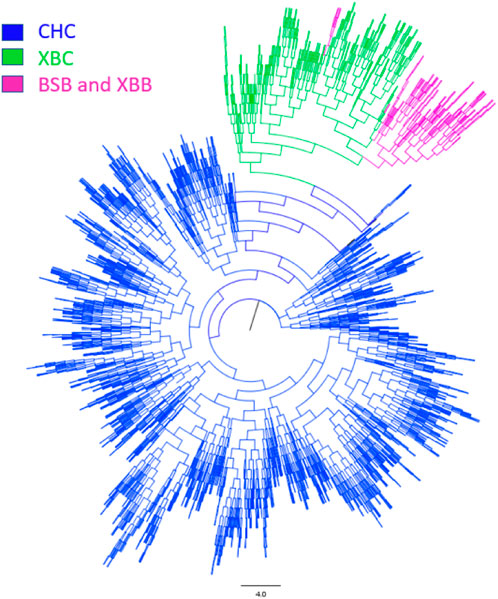
Figure 4. Phylogenetic tree of Xinjiang Brown cattle and Chinese Holstein cow. BSB is Brown Swiss Bull, CHC is Chinese Holstein cow, XBB is Xinjiang Brown Bull, XBC is Xinjiang Brown Cow.
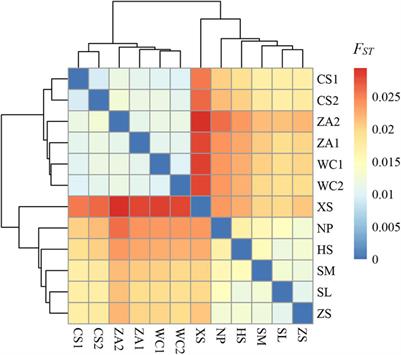
3.1.3 Genetic relatedness between Xinjiang Brown and Chinese Holstein cowsUsing the SNP genotyping information from 403 Xinjiang Brown cows, 71 Xinjiang Brown bulls, 11 Brown Swiss bulls, and 2,633 Chinese Holstein cows, a G-matrix was constructed. Figure 5 was then generated on the basis of the actual genetic relatedness among individuals in the G-matrix. Figure 5 shows that the kinship coefficients among Xinjiang Brown cows, Xinjiang Brown bulls, and Brown Swiss bulls populations were approximately 0.5, which is significantly higher than those among individuals within the Chinese Holstein cow population. The kinship coefficients between Xinjiang Brown cows, Xinjiang Brown bulls, Brown Swiss bulls, and Chinese Holstein cows populations tend toward 0.
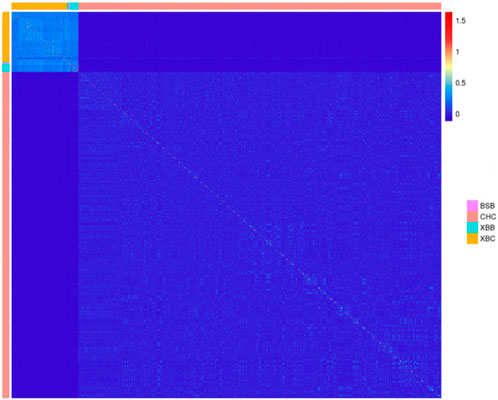
Figure 5. Genomic relationship matrix of Xinjiang Brown cattle and Chinese Holstein cow. BSB is Brown Swiss Bull, CHC is Chinese Holstein cow, XBB is Xinjiang Brown Bull, XBC is Xinjiang Brown Cow.
3.1.4 PCAPCA was performed using the genomic kinship relationship matrix (G-matrix) among individuals from the two breeds (Figures 2–7). The results revealed that the first principal component (PC1, accounting for 4.75%) separated Xinjiang Brown cows, Xinjiang Brown bulls, Brown Swiss bulls, and Chinese Holstein cows into distinct groups. Specifically, Xinjiang Brown cows, Xinjiang Brown bulls, and Brown Swiss bulls were closely clustered. The second principal component (PC2, accounting for 1.76%) could not distinguish between Xinjiang Brown cows, Xinjiang Brown bulls, and Brown Swiss bulls; however, it separated the Chinese Holstein cows into two distinct groups. The third principal component (PC3, accounting for 1.22%) further distinguished the Chinese Holstein cows into two groups.

Figure 6. Principal Component Analysis of Xinjiang Brown Cattle and Chinese Holstein cow.
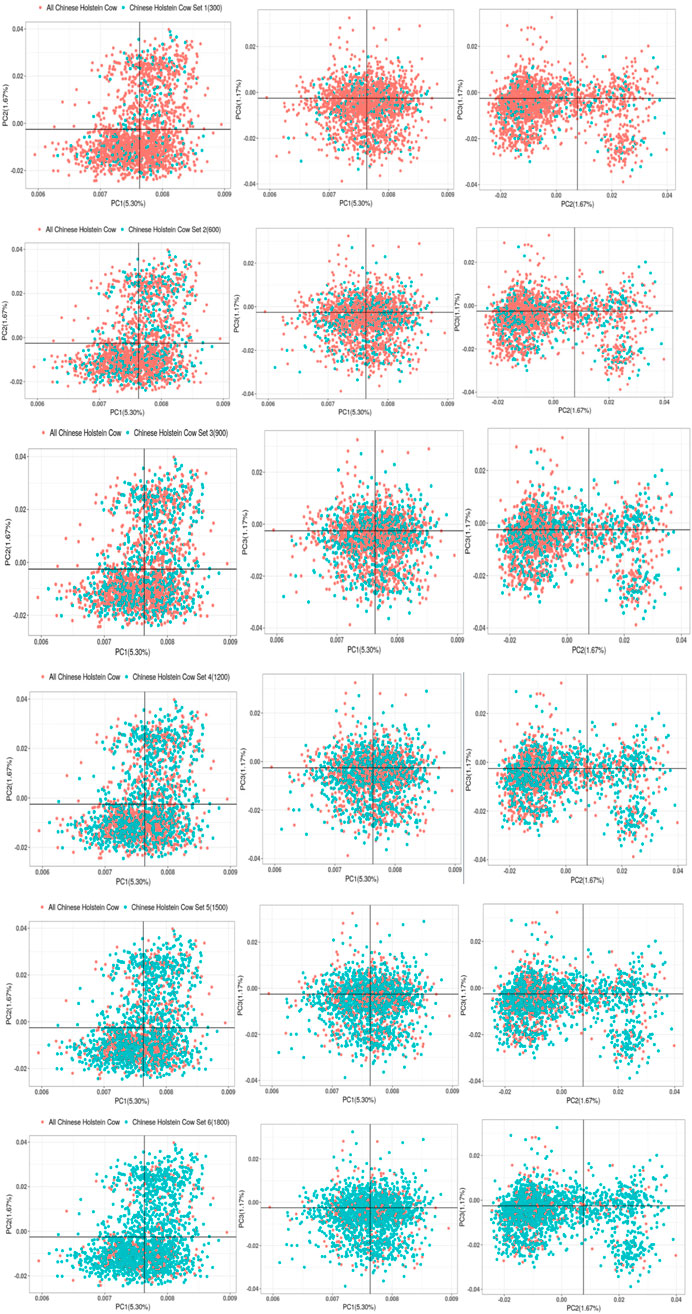
Figure 7. Gradient grouping of PCA analysis in joint reference group.
3.2 Multi-breed genomic evaluation using a joint reference population3.2.1 Descriptive statistics of the dairy traits of Xinjiang brown and Chinese Holstein cattleTable 4 lists the statistics, including sample size, minimum value, maximum value, mean, standard deviation, and coefficient of variation of the observed dairy traits of Xinjiang Brown and Chinese Holstein cattle. 305dMY, MFY, MPY, and SCS between Xinjiang Brown and Chinese Holstein cattle differed significantly.

Table 4. Description of milk traits in Xinjiang Brown Cattle and Chinese Holstein Cattle.
3.2.2 Random gr
留言 (0)