
記住我


Total shoulder arthroplasty (TSA), including both anatomic and reverse shoulder arthroplasty, is an increasingly used surgical treatment. More than 800,000 people in the United States are estimated to be living with a type of shoulder arthroplasty.1,2 Approximately 31.8 per 100,000 people each year undergo TSA. The recent rise in TSA utilization is likely due in part to the expanding indications for the reverse prosthesis; initially devised for rotator cuff arthropathy, indications for reverse TSA now include some cases of osteoarthritis, proximal humerus fractures, and irreparable rotator cuff tears.3
More than six million people in the United States require chronic anticoagulation therapy for the prevention of thromboembolism, and these therapies are frequently interrupted for major invasive procedures.4,5 One measure of the coagulation pathway is the international normalized ratio (INR), which is calculated as the ratio of the patient's prothrombin time divided by the mean normal laboratory prothrombin time.6 Patients undergoing total joint arthroplasty have high bleeding risk according to the American Association of Orthopaedic Surgeons and the American College of Cardiology, and historically, preoperative INR ≤ 1.5 has been used as a threshold for these major surgeries.4,7 However, the safe INR threshold for orthopaedic procedures has been recently called into question, with some studies suggesting no increased risk of bleeding with preoperative INR levels above the historical cutoff,8–14 and others suggesting increased risk of bleeding and mortality at even lower INR levels.15–17 Only one previous study has investigated the association between preoperative INR levels and episode-of-care adverse events after TSA, and the optimal preoperative threshold INR level for TSA has not been well established.18
The primary objective of this study was to assess whether preoperative INR levels were associated with major postoperative bleeding events after TSA using a large national database over a recent 10-year period. Secondary objectives of this study were to assess for associations between preoperative INR levels and 30-day postoperative complications, revision surgery, readmission, and hospital length of stay after TSA.
Methods Study Design and CohortA retrospective database study was done to determine the effect of preoperative INR on 30-day perioperative outcomes after TSA. Patients were identified using the American College of Surgeons National Surgical Quality Improvement Program (NSQIP) database. This database includes patients who undergo major surgical procedures at approximately 700 participating hospitals. Preoperative through 30-day postoperative data, including demographics, comorbidities, hospital length of stay, complications, readmission, and revision surgery, are collected in this database. The data are collected through medical record review and verified at the end of the 30-day postsurgery timeframe by telephone or written patient survey. Data accuracy is ensured by random audits and clinical reviews.19
The NSQIP database was queried for patients who underwent TSA from January 1, 2011, to December 31, 2020, by querying the current procedural terminology code 23472 (arthroplasty, glenohumeral joint; total shoulder [glenoid and proximal humeral replacement]). This procedural code is common to both anatomic and reverse shoulder arthroplasty, and therefore, the data were not sensitive to differences between these two types of shoulder arthroplasties; this procedural code includes primary rather than revision arthroplasty.
The initial database query yielded 33,489 patients who underwent TSA during the study period. Only patients with preoperative INR values within 2 days of the TSA were included in the study as done by Rudasill et al,17 and 31,084 patients were excluded for this reason. After exclusions, the study cohort consisted of 2,405 patients who underwent TSA.
Outcome VariablesOur primary outcome variable was postoperative bleeding requiring blood transfusion within 72 hours of surgery. Our secondary outcome variables included measured 30-day postoperative complications within the NSQIP database, specifically, superficial surgical site infection, deep surgical site infection, organ/space surgical site infection, wound dehiscence, pneumonia, unplanned reintubation, pulmonary embolism, persistent ventilator requirement, renal failure, urinary tract infection, stroke, cardiac arrest, myocardial infarction, blood transfusion, deep vein thrombosis, and sepsis/septic shock. Detailed definitions for each complication are available from NSQIP.19 In addition, our secondary outcome variables included a composite variable for 30-day postoperative complication, scored positively if a patient had one or more complications as measured by the NSQIP database, as well as a composite variable for 30-day infectious complication, scored positively if a patient had one or more of superficial surgical site infection, deep surgical site infection, organ/space surgical site infection, and wound dehiscence. Finally, our secondary outcome variables also included hospital length of stay, 30-day revision surgery, and 30-day hospital readmission.
Explanatory VariablesOur explanatory variables included INR within 2 days of TSA, stratified into four groups as per the work of Rudasill et al and Sivasundaram et al: (1) INR ≤ 1.0, (2) 1.0 < INR ≤ 1.25, (3) 1.25 < INR ≤ 1.5, and (4) INR > 1.5.16–18 Moreover, the following patient-related variables were collected: age, sex, race, BMI, diabetes mellitus, current smoking status, functional status (independent, partial dependent, or totally dependent), chronic obstructive pulmonary disease, congestive heart failure, hypertension requiring medication, disseminated cancer, chronic steroid or immunosuppressive therapy, bleeding disorder, and American Society of Anesthesiologists (ASA) classification.
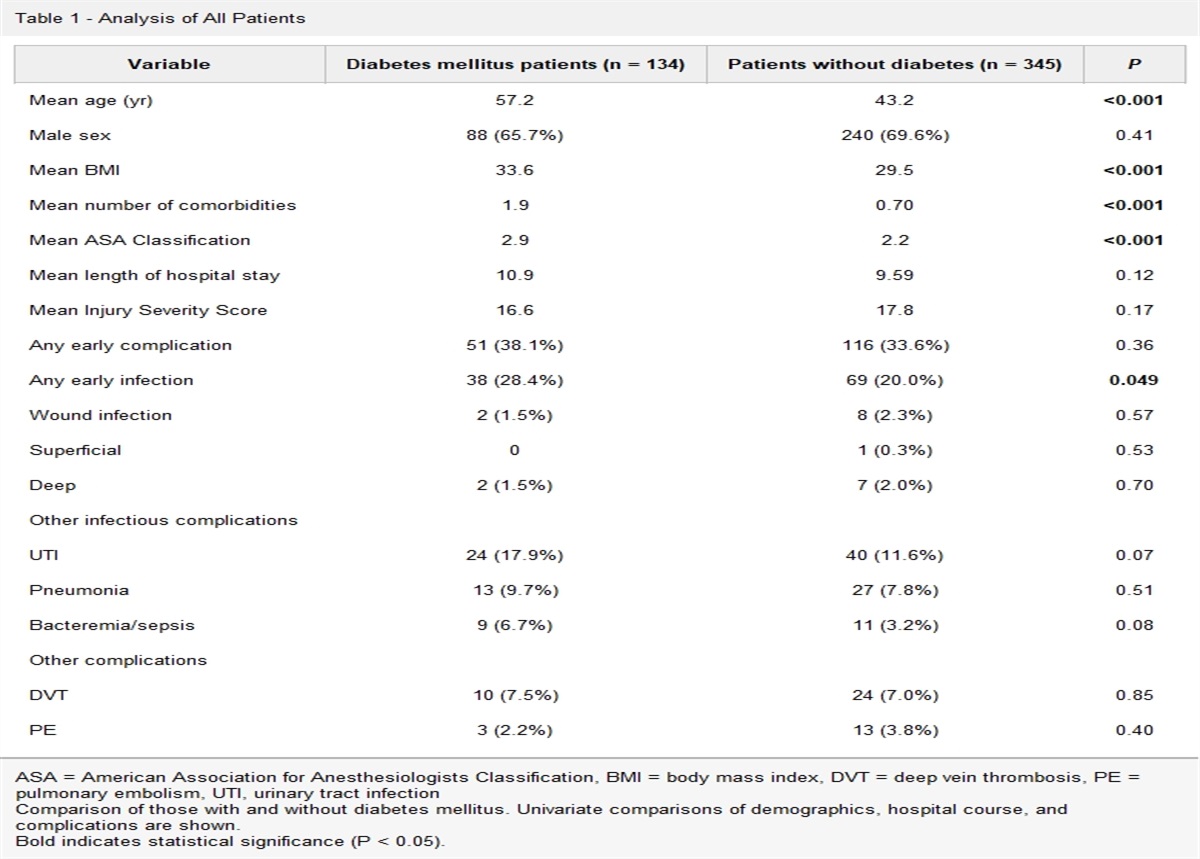
Statistical AnalysisDescriptive statistics were calculated for the final cohort. All variables had greater than 98% complete data, except race, which had 87% complete data. Statistical analyses were done using complete data sets only, and missing data are given in Table 1. The Kruskal-Wallis tests were used for continuous explanatory variables and the chi-squared test for categorical explanatory variables. Unadjusted simple logistic regression was used to assess the effect of INR level on the risk of dichotomous outcomes such as bleeding, complication, and readmission in the 30-day postoperative period. Then, multivariable logistic regression was used to assess the effect of INR level adjusted for sex, age, diabetes mellitus, smoking, and ASA classification on the risks of these outcomes. Unadjusted simple linear regression was used to assess the effect of INR level on hospital length of stay. Then, multivariable linear regression was used to assess the effect of INR level adjusted for sex, age, diabetes mellitus, smoking, and ASA classification on hospital stay duration. α = 0.05 was used as the criterion for statistical significance. Data curation was done with R, and statistical tests were done with SAS.
Table 1 - Baseline Patient Characteristics of the Study Cohort Stratified by the INR Level (n = 2,405) Variable INR Level P INR ≤ 1.0 (n = 1,147) 1.0 < INR ≤ 1.25 (n = 1,047) 1.25 < INR ≤ 1.5 (n = 176) INR > 1.5 (n = 35) Mean (SD) Mean (SD) Mean (SD) Mean (SD) Age (years)a 70.1 (9.6) 72.5 (9.2) 74.8 (8.2) 73.3 (8.0) <0.0001 BMI 30.5 (7.6) 31.3 (7.7) 31.3 (7.9) 30.0 (9.5) 0.1 n (%) n (%) n (%) n (%) Female sex 744 (64.9) 556 (53.1) 102 (58.0) 22 (62.9) <0.0001 Racea 0.6 White 895 (91.8) 874 (93.2) 148 (93.7) 28 (90.3) Black or African American 46 (4.7) 46 (4.9) 8 (5.1) 2 (6.5) Native American 16 (1.6) 10 (1.1) 2 (1.3) 1 (3.2) Asian 17 (1.7) 6 (0.6) 0 (0) 0 (0) Pacific Islander 1 (0.1) 2 (0.2) 0 (0) 0 (0) ASA classificationa <0.0001 1 13 (1.1) 10 (1.0) 0 (0) 0 (0) 2 386 (33.7) 224 (21.4) 20 (11.4) 5 (14.3) 3 697 (60.8) 728 (69.6) 134 (76.1) 22 (62.9) 4 51 (4.5) 83 (7.9) 22 (12.5) 8 (22.9) 5 0 (0) 1 (0.1) 0 (0) 0 (0) Diabetes mellitus 235 (20.5) 230 (22.0) 34 (19.3) 11 (31.4) 0.4 Current smoker 135 (11.8) 84 (8.0) 10 (5.7) 5 (14.3) 0.005 COPD 104 (9.1) 78 (7.5) 19 (10.8) 4 (11.4) 0.3 CHF 8 (0.7) 27 (2.6) 5 (2.8) 2 (5.7) 0.001 Hypertension 771 (67.2) 779 (74.4) 137 (77.8) 28 (80) 0.0002 Disseminated cancer 7 (0.6) 7 (0.7) 3 (1.7) 0 (0) 0.4 Steroids/immunosuppression 65 (5.7) 56 (5.4) 6 (3.4) 2 (5.7) 0.7 Bleeding disorder 80 (7.0) 131 (12.5) 39 (22.2) 13 (37.1) <0.0001 Functional statusa 0.07 Independent 1102 (96.7) 976 (94.0) 164 (94.3) 34 (100) Partially dependent 35 (3.1) 57 (5.5) 10 (5.8) 0 (0) Totally dependent 3 (0.3) 5 (0.5) 0 (0) 0 (0)COPD = chronic obstructive pulmonary disease, CHF = congestive heart failure, INR = international normalized ratio
aComplete data sets were used for statistical analyses. Data were partially missing for the variables of race (n = 303), age (n = 42), functional status (n = 19), and ASA classification (n = 1).
Italics denote statistical significance.
A total of 2,405 patients who underwent TSA with preoperative INR values within 2 days of surgery were included in the study cohort. The cohort had an average age of 71.5 years, and 40.8% of patients were male sex. The cohort exhibited average BMI of 30.9. Most of the patients were ASA 3 classification (65.8%), followed by ASA 2 classification (26.4%).
When stratified by INR into four groups (INR ≤ 1.0, 1.0 < INR ≤ 1.25, 1.25 < INR ≤ 1.5, and INR > 1.5), the groups were significantly different in age, sex, ASA classification, smoking status, comorbid congestive heart failure, comorbid hypertension, and comorbid bleeding disorder (Table 1). Mean preoperative INR was similar from 2011 to 2020 (Figure 1).
 Figure 1:
 Diagram showing the yearly mean preoperative international normalized ratio values from 2011 to 2020.
Bleeding Requiring TransfusionThe risk of postoperative bleeding requiring blood transfusion within 72 hours of surgery significantly increased with increasing INR levels (P < 0.0001) (Table 2). In the unadjusted logistic regression analysis, when compared against patients with INR ≤ 1.0 as the reference, patients with 1.0 < INR ≤ 1.25 had 1.9 times the odds of bleeding, patients with 1.25 < INR ≤ 1.5 had 3.2 times the odds of bleeding, and patients with INR > 1.5 had 4.2 times the odds of bleeding (Table 3). In the multivariable logistic regression analysis adjusted for sex, age, diabetes mellitus, smoking, and ASA classification, when compared against patients with INR ≤ 1.0 as the reference, patients with 1.0 < INR ≤ 1.25 had 1.7 times the odds of bleeding, patients with 1.25 < INR ≤ 1.5 had 2.5 times the odds of bleeding, and patients with INR > 1.5 had 3.2 times the odds of bleeding. Older age was associated with increased odds of bleeding (OR 1.028, 95% CI 1.007 to 1.049), and male sex was associated with decreased odds of bleeding (OR 0.583, 95% CI 0.409 to 0.830) (Table 4).
Table 2 - Tabulated 30-day Postoperative Complications, Reoperations, Readmissions, and Hospital Lengths of Stay Stratified by the INR Level (n = 2405) Outcome INR Level P INR ≤ 1.0 (n = 1147) 1.0 < INR ≤ 1.25 (n = 1047) 1.25 < INR ≤ 1.5 (n = 176) INR > 1.5 (n = 35) n (%) n (%) n (%) n (%) Bleeding requiring transfusion 54 (4.7) 88 (8.4) 24 (13.6) 6 (17.1) <0.0001 Complicationa 86 (7.5) 122 (11.7) 33 (18.8) 7 (20.0) <0.0001 Infectious complicationa 7 (0.6) 8 (0.8) 1 (0.6) 0 (0) 0.9 Superficial surgical site infection 4 (0.4) 3 (0.3) 0 (0) 0 (0) 0.9 Deep surgical site infection 1 (0.1) 0 (0) 0 (0) 0 (0) 0.8 Organ/space surgical site infection 1 (0.1) 5 (0.5) 1 (0.6) 0 (0) 0.3 Wound dehiscence 1 (0.1) 1 (0.1) 0 (0) 0 (0) 0.9 Pneumonia 4 (0.4) 13 (1.2) 7 (4.0) 2 (5.7) <0.0001 Unplanned reintubation 4 (0.4) 4 (0.4) 3 (1.7) 0 (0) 0.09 Pulmonary embolism 4 (0.4) 4 (0.4) 0 (0) 0 (0) 0.9 Ventilator requirement 4 (0.4) 1 (0.1) 2 (1.1) 0 (0) 0.1 Renal insufficiency 2 (0.2) 1 (0.1) 1 (0.6) 0 (0) 0.6 Urinary tract infection 15 (1.3) 18 (1.7) 2 (1.1) 0 (0) 0.7 Stroke 1 (0.1) 0 (0) 2 (0.1) 0 (0) 0.001 Cardiac arrest 2 (0.2) 1 (0.1) 0 (0) 0 (0) 0.9 Myocardial infarction 4 (0.4) 5 (0.5) 1 (0.6) 1 (2.9) 0.2 Deep vein thrombosis 3 (0.3) 5 (0.5) 2 (1.1) 0 (0) 0.4 Sepsis/septic shock 4 (0.4) 3 (0.3) 0 (0) 0 (0) 0.9 Revision Surgeryb 19 (1.7) 27 (2.6) 3 (1.7) 1 (2.9) 0.5 Readmissionb 48 (4.2) 59 (5.7) 17 (9.7) 1 (2.9) 0.02 Mean (SD) Mean (SD) Mean (SD) Mean (SD) Hospital length of stayb 2.4 (2.3) 2.8 (3.0) 3.0 (3.2) 5.5 (7.7) 0.003INR = international normalized ratio
aThe figures shown denote the number of unique patients with one or more of the class of complications in the 30-day postoperative period. Patients may have had more than one of such complications, counted only once for analytical statistics to maintain the assumption of independent events.
bComplete data sets were used for statistical analyses. Data were partially missing for the outcomes of revision surgery (n = 2), readmission (n = 10), and hospital length of stay (n = 2).
Italics denote statistical significance.
OR = odds ratio, CI = confidence interval, INR = international normalized ratio
Italics denote statistical significance.
OR = odds ratio, CI = confidence interval, INR = international normalized ratio
Reference group for age is minus 1 unit.
Italics denote statistical significance.
The increasing INR level was significantly associated with increased risk of postoperative complications (P < 0.0001), pneumonia (P < 0.0001), urinary tract infection (P = 0.001), and hospital readmission (P = 0.02). Revision surgery was not associated with the INR level (P = 0.5) (Table 2).
The unadjusted logistic regression analysis demonstrated a stepwise increase in the odds of complications with increasing INR levels. The risk of hospital readmission was higher for the 1.25 < INR ≤ 1.5 group compared with the INR ≤ 1.0 group (Table 3). In the multivariable logistic regression analysis adjusted for sex, age, diabetes mellitus, smoking, and ASA classification, when compared against patients with INR ≤ 1.0 as the reference, patients with 1.0 < INR ≤ 1.25 had 1.5 times the odds of complications and patients with 1.25 < INR ≤ 1.5 had 2.2 times the odds of complications. Older age was associated with increased odds of complications (OR 1.026, 95% CI 1.008 to 1.043), and male sex was associated with decreased odds of complications (OR 0.652, 95% CI 0.486 to 0.874). In the multivariable logistic regression analysis, patients with 1.0 < INR ≤ 1.25 compared with patients with INR ≤ 1.0 had 2.0 times the odds of hospital readmission (Table 4).
Hospital Stay DurationIncreasing INR levels were significantly associated with longer hospital lengths of stay in a stepwise manner (P = 0.003) (Table 2). The unadjusted linear regression analysis showed that each higher tier of INR level was associated with a half-day increase in total hospital length of stay (P < 0.0001) (Table 5). Higher INR level, older age, female sex, higher ASA classification, diabetes mellitus, and current smoking were associated with greater hospital length of stay in the multivariable linear regression analysis (Table 6).
Table 5 - Simple Linear Regression Analysis on the Effect of INR Level on Hospital Length of Stay Variable Hospital length of stay β (95% CI) P INR level 0.511 (0.345, 0.677) <0.0001β = β regression coefficient, CI = confidence interval, INR = international normalized ratio
Italics denote statistical significance.
留言 (0)