
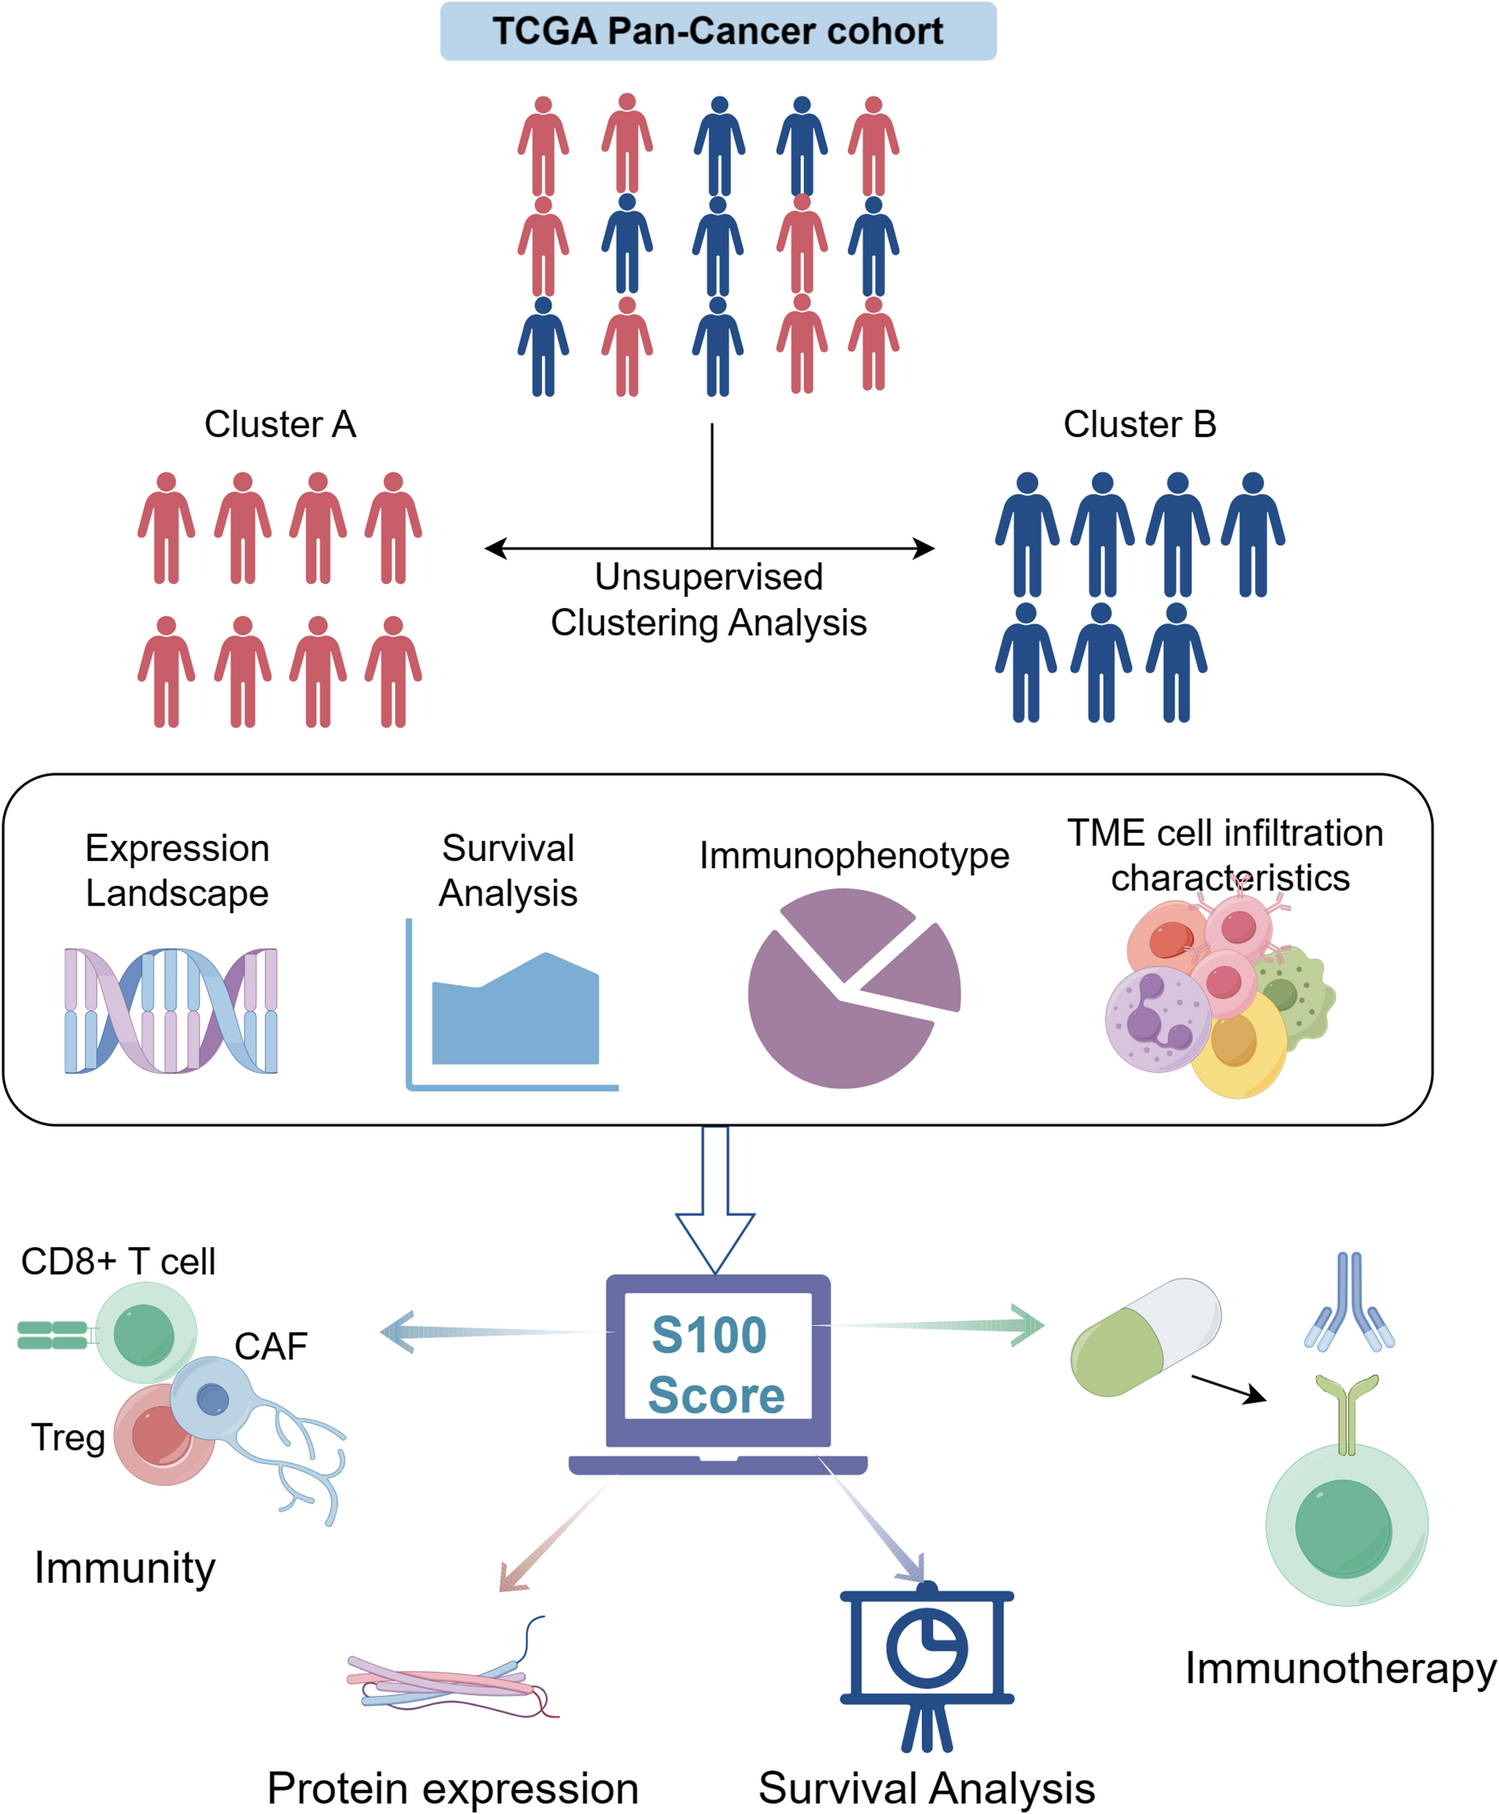
記住我


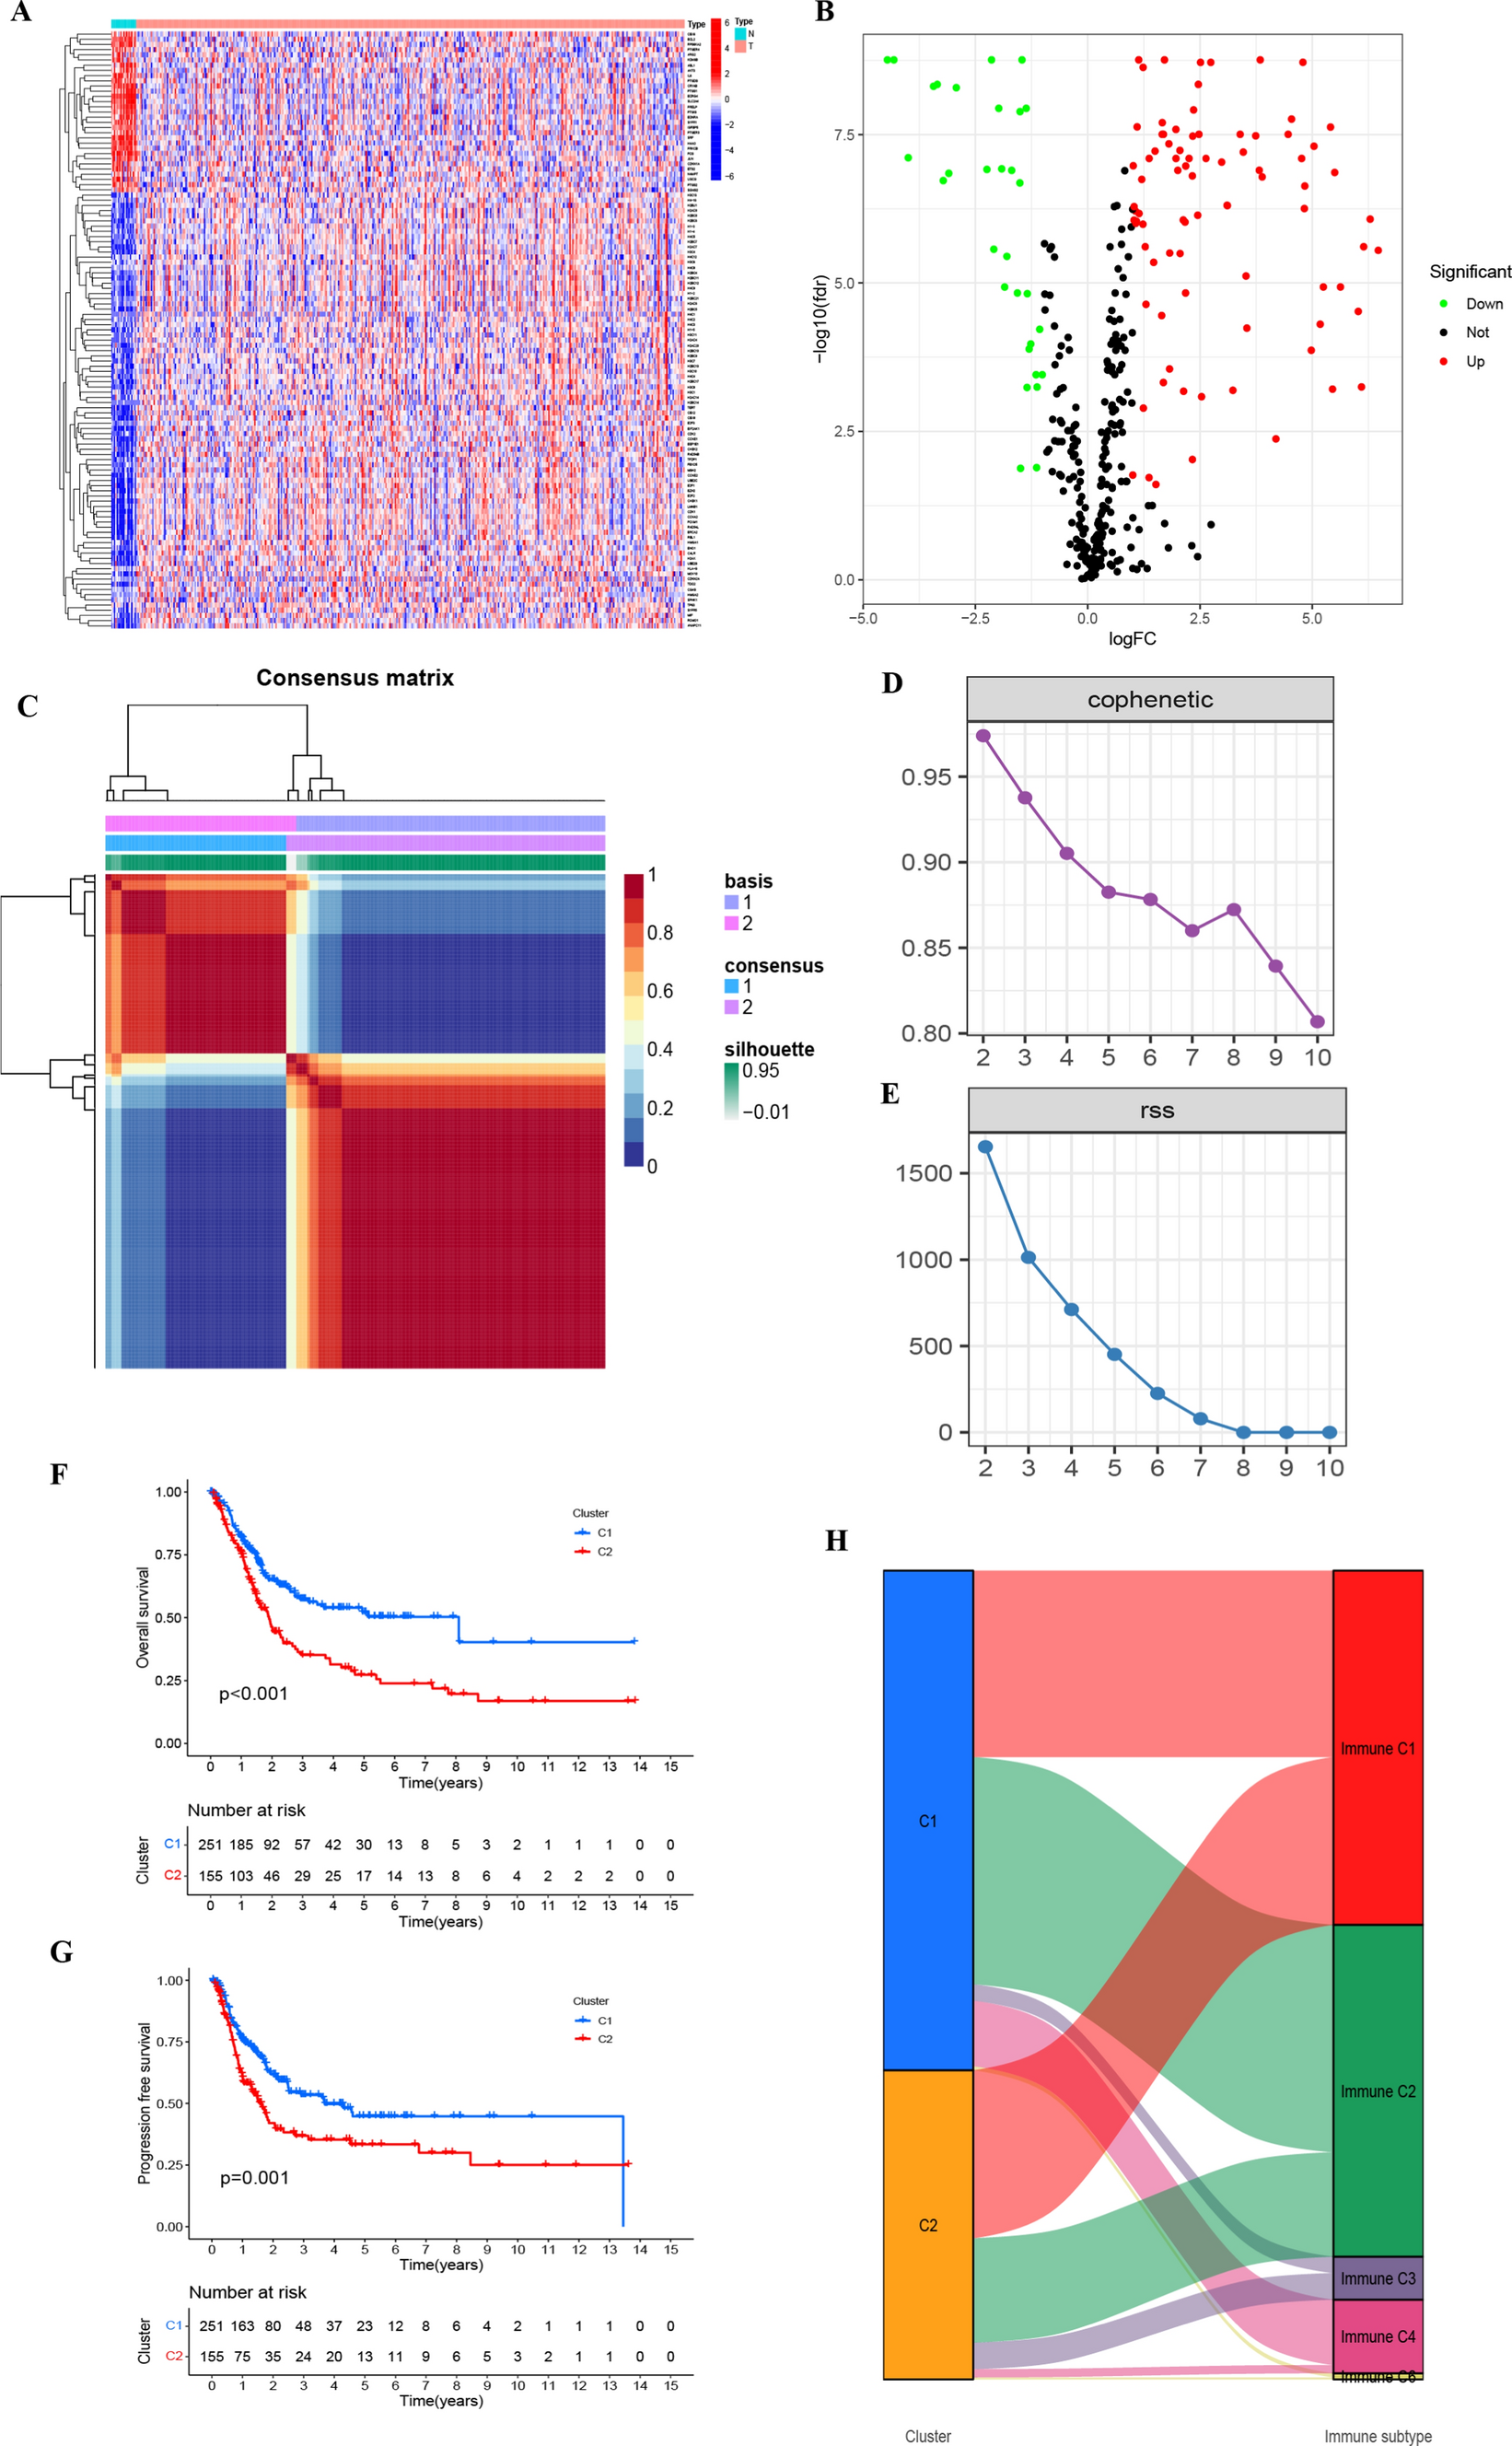

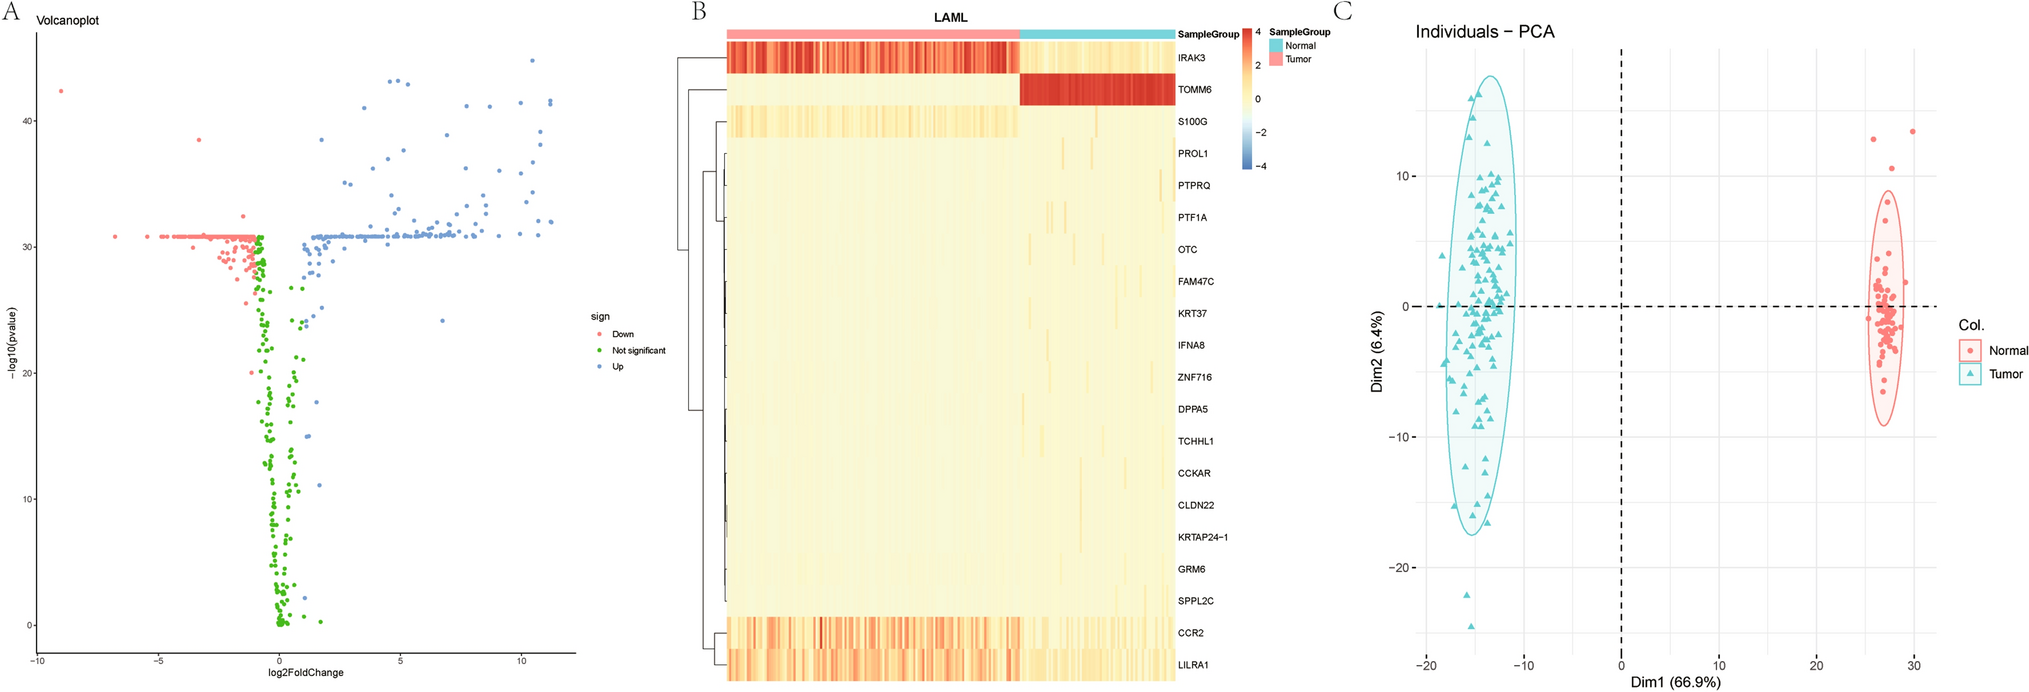
From the TCGA–BLCA dataset, we secured 406 neoplastic tissue specimens, coupled with their clinical data, and an additional 19 typical tissue specimens. Following the rectification of batch discrepancies, we instituted data standardization procedures. Setting our criteria at FDR < 0.05 and an absolute value of log2 (FC) surpassing 1, we discerned 115 genes with differential expression (Fig. 1A, Table S2). Figure 1B depicts a volcano plot illustrating all DEGs based on our selection criteria, emphasizing their significance and expression changes.
Fig. 1
A Illustrates the expression levels of senescence-associated genes across various TCGA–BLCA samples. B Volcano plot depicting differentially expressed genes. C Clustering map derived through NMF algorithm. D, E Assessment of performance and stability pertaining to clusters through multiple methods. F Notable variance in overall survival observed between C1 and C2. G Significant disparity in progression-free survival between C1 and C2. H Distribution of C1 and C2 across immune molecule subtypes C1–C6
3.2 Application of NMF in analyzing molecular subtypes of senescence-associated genesTranscriptomic data from TCGA–BLCA were analyzed using the NMF clustering technique, with cophenetic and RSS parameters directing the process to ensure stability and optimal clustering outcomes. The optimal cluster number was identified as K = 2, facilitating the segregation into two distinct subgroups, namely C1 and C2 (Fig. 1C–E, Table S3). When evaluating survival curves, C1 samples manifested enhanced survival probabilities in contrast to C2 samples (Fig. 1F, G). We categorize tumor samples into six immune subtypes to elucidate the tumor microenvironment’s complexity: wound healing (C1), IFN-γ dominant (C2), inflammatory (C3), lymphocyte depleted (C4), immunologically quiet (C5), and TGF-β dominant (C6). Such analysis also illuminated the correlation between C1 and C2 clusters and the conventional immune classifications (Immune C1–C6) (Fig. 1H) [19]. Notably, marked variations in the composition of immune and stromal cell infiltrations between C1 and C2 were discerned (Fig. 2A–F). This underscores that the molecular categories arising from clustering based on senescence-associated genes seem intricately connected to diverse cell infiltrations within the tumor milieu.
Fig. 2
A–G Highlights the differential manifestations of C1 and C2 at the immune cellular level within the tumor microenvironment
3.3 Construction and validation of prognostic models for senescence-associated genesStarting with 115 differentially expressed genes, identified by stringent criteria of an absolute log2 fold change > 1 and an adjusted P-value (FDR) < 0.05, we further refined our analysis to focus on their prognostic significance. Through the application of univariate Cox regression, 18 genes of pronounced prognostic relevance were discerned (P < 0.05, Table S4, Fig. 3A). To counteract potential overfitting, these genes underwent lasso and multivariate COX regression evaluations, pinpointing ten pivotal genes (CALR, HLA-G, HMGA1, HMGA2, RAD54B, JUN, MOV10, PTGER3, PTGER4, UGCG) in BLCA with diagnostic significance (Fig. 3B, C). The formulation for RiskScore was: (0.3286 * CALR) − (0.3575 * HLA-G) + (0.2063*HMGA1) + (0.2359 * HMGA2) − (0.3606 * RAD54B) + (0.1659 * JUN) − (0.2371 * MOV10) + (0.3914 * PTGER3) − (0.1126 * PTGER4) − (0.3114 * UGCG). The coefficients for each gene in the RiskScore formula were derived using a multivariate Cox proportional hazards regression model. This model assesses the independent effect of each gene’s expression level on patient survival, assigning a weighted coefficient that quantifies its impact, as exemplified by the coefficient 0.3286 for CALR.
Fig. 3
A Forest plot revealing the Univariate Cox regression analysis results pertaining to 18 senescence-associated genes and overall survival. B, C LASSO coefficient profiles for the 18 genes, characterized by vertical lines corresponding to tenfold cross-validation values. Ten cross-validations employed for tuning parameter selection in lasso regression, with vertical lines indicating the optimal data based on the minimum criterion and 1 standard error criterion. The left vertical line represents the 14 genes finally identified. D Kaplan–Meier curve analysis conducted on the TCGA database, highlighting the survival disparity between the HRG and LRG. E Kaplan–Meier curve analysis performed on the GEO database, indicating survival differences between HRG and LRG. F Validation of prognostic risk scores in the GEO cohort. G Risk score distribution for the polygenic model in the GEO cohort. H Survival status and duration for BLCA patients in the GEO cohort. I Validation of prognostic risk scores in the TCGA cohort. J Risk score distribution for the polygenic model in the TCGA cohort. K Survival status and duration for BLCA patients in the TCGA cohort
Using the median of the derived risk scores, tumor specimens were delineated into a high-risk category (HRG) and a counterpart low-risk category (LRG). Subsequent survival evaluations indicated superior outcomes for the LRG (Fig. 3D, E). Similar RiskScore distribution trends were observed in both GEO and TCGA cohorts, as illustrated in Fig. 3F–K. This consistency across different datasets reinforces the robustness and generalizability of our RiskScore as a prognostic tool in bladder cancer.
3.4 Development of a risk nomogramROC curve analyses were executed, producing areas under the curve values of 0.705, 0.708, and 0.717, highlighting noteworthy prognostic potential (Fig. 4A). An encompassing evaluation over 5 years, factoring in risk score, age, gender, tumor gradation, and clinicopathological staging (Fig. 4B–D), posited the risk score as a paramount predictor in comparison to other clinical parameters. Both univariate and multivariate Cox regression investigations validated age, disease stage, and risk score as standalone predictors of prognosis in BLCA patients (Fig. 4E, F). Leveraging the deduced risk scores and clinical metrics, a predictive nomogram was constructed to forecast survival probabilities at 1, 3, and 5-year intervals (Fig. 4G). The fidelity of this model was accentuated by the accompanying calibration plots (Fig. 4H) [20, 21].
Fig. 4
A–D ROC analysis forecasting 1-year, 3-year, and 5-year overall survival. E Univariate Cox regression analysis results of overall survival. F Multivariate Cox regression analysis results of overall survival. G Nomograph predicting survival outcomes. H Calibration curve for the Nomograph
3.5 Examination of the function of senescence-associated genesThrough Gene Set Enrichment Analysis (GSEA), we explored the functional roles associated with the elevated and diminished expressions of the ten pivotal genes. Using KEGG enrichment evaluation, it was discerned that enhanced expression levels of HMGA2 and MOV10 were affiliated with pathways such as Versus-Host-Disease and Receptor-Interaction, among others. Augmentation of the Olfactory-Transduction pathway appeared to influence the surge in RAD54B expression. Enhanced expressions of PTGER3 and PTGER4 were speculated to correlate with the activation of pathways like Neuroactive-Ligand-Receptor-Interaction and other relevant signaling processes (Fig. 5A–J).
Fig. 5
Functional enrichment analysis. A Enrichment gene set for samples expressing high levels of CALR in KEGG. B Enrichment gene set for samples expressing high levels of HLA-G in KEGG. C Enrichment gene set for samples expressing high levels of HMGA1 in KEGG. D Enrichment gene set for samples expressing high levels of HMGA2 in KEGG. E Enrichment gene set for samples expressing high levels of JUN in KEGG. F Enrichment gene set for samples expressing high levels of MOV10 in KEGG. G Enrichment gene set for samples expressing high levels of PTGER3 in KEGG. H Enrichment gene set for samples expressing high levels of PTGER4 in KEGG. I Enriched gene set for RAD54B high-expression samples in KEGG. J Enriched gene set for UGCG high-expression samples in KEGG
3.6 Connection of risk factors with clinicopathological parametersClinicopathological parameters were displayed for both the HRG and LRG (Fig. 6A), and proportional diagrams were plotted to depict the clinical variables in both groups (Fig. 6B–F), unveiling significant differences between the HRG and LRG. Notably, the high-risk group was more frequently associated with advanced tumor stages (T3–T4), metastatic involvement (M1), and lymph node positivity (N+), as detailed in the proportional comparisons of Fig. 6C–F. These trends underscore the prognostic implications of the risk score in correlating with more aggressive disease features.
Fig. 6
A Heatmap depicting the distribution of clinical characteristics and associated risk scores within each sample. Incidence of clinical variable subtypes in high and low risk score groups. B WHO grade, C distant metastasis M, D lymph node involvement N, E stage, F T, G Kaplan–Meier curve for TMB high and low groups. H Kaplan–Meier curve for patients within TMB high and low risk score groups. I Creation of HRG oncoPrint. J Creation of low-risk score oncoPrint
3.7 Tumor mutational burden related clinical featuresThe analysis of survival curves revealed an extended overall survival for patients possessing elevated TMB (P < 0.001, Fig. 6G). By integrating both TMB and risk evaluations, patients were stratified into four distinct categories. There were marked prognostic variations between the HRG and LRG within both high and low TMB classifications (P < 0.001, Fig. 6H), suggesting the predictive prowess of the risk metric in gauging the efficacy of immunotherapy.
To delve into the relationship between risk evaluations and genetic aberrations, we delineated waterfall plots highlighting the top 20 frequently mutated genes (Fig. 6I, J). A survey of significant gene alterations revealed a predominant mutation rate for KMT2D in the HRG (30% vs 21%) and for MUC16 in the LRG (22% vs 26%). Such insights hold potential value for integrating senescence in BLCA therapeutic strategies [22, 23].
3.8 Exploration of risk characteristics within the immune microenvironmentWe further explored the association between the risk score and immune cell infiltration employing seven unique analytical approaches (Fig. 7A). we observed notable variances across databases, including discrepancies in CD8+ and CD4+ T cell prevalence. While the EPIC analysis highlighted the predominance of CD4+ T cells in the tumor microenvironment, contrasting findings were observed when analyzing data from other platforms, where CD8+ T cells also showed significant infiltration patterns. This discrepancy underscores the complexity of the tumor immune landscape, suggesting that both cell types play crucial roles in bladder cancer’s immune contexture. The ESTIMATE [24] assessment revealed an ascending trajectory in both stromal and estimate scores across the HRG and LRG groups (Fig. 7B).
Fig. 7
A Spearman analysis on the correlation between HRG patients and tumor-infiltrating immune cells. B ESTIMATE analysis of the TME score for HRG and LRG. C Correlation between KEGG’s representative pathway and risk score. D Correlation between Hallmark’s representative pathway and risk score. E Correlation between gene expression levels at immune checkpoints and risk scores. F Distribution chart for IPS scores. G Sensitivity analysis of cisplatin in high and low risk score groups. H Sensitivity analysis of cyclopamine in high and low risk score groups. I Sensitivity analysis of sorafenib in high and low risk score groups
3.9 Enrichment examination of biological functions and signal pathwaysThrough gene set variation analysis centered on the ten pivotal genes, we deepened our understanding of the biological functions associated with distinct risk classifications (Fig. 7C, D). Observations highlighted an augmented activation of the PPAR signaling pathway in subjects within the LRG, while pathways like the RIG-I-Like-Receptor and NOD-Like-Receptor exhibited enhanced activity in those categorized as HRG.
3.10 Prognostication of patient outcomes following immunotherapySubsequent detailed analysis pinpointed 47 genes associated with checkpoint blockade. The inclusion of immune-related genes in our senescence-focused analysis is predicated on the emerging evidence that senescence can influence the tumor immune microenvironment. To elucidate this relationship, we specifically curated a set of immune-related genes known to interact with senescent cells or pathways, thus providing a comprehensive view of how senescence may modulate immune evasion and therapy response. The majority manifested a negative association with the risk score and were deemed significant (Fig. 7E). Prognostic models presented diminished IPS scores for those in the high-risk category, hinting that such patients might not be optimal recipients for PD-1 and CTLA-4 immunotherapies (Fig. 7F). This robust data suggests a noteworthy linkage between risk scores and immunotherapy responses, endorsing its potential use in forecasting prognosis.
3.11 Forecasting chemotherapeutic responsivenessThrough the application of the pRRophetic algorithm, we assessed the IC50 values for three therapeutic agents (cisplatin, cyclopamine, sorafenib) among BLCA patients. Elevated IC50 values were observed for cisplatin, cyclopamine, and sorafenib within the LRG (P < 0.001), indicating a potential diminished drug responsiveness (P < 0.001) (Fig. 7G–I). Such findings may inform tailored drug recommendations for patients based on their specific risk profiles.
留言 (0)